如何在Matplotlib中处理鼠标点击事件
在数据可视化的过程中,交互式图表能够提供更多的信息和更加直观的数据理解方式。Matplotlib是Python中一个广泛使用的绘图库,它不仅支持生成高质量的图形,还支持基本的交互式事件处理。本文将详细介绍如何在Matplotlib中处理鼠标点击事件,以及如何利用这些事件来增强图表的交互性。
1. 基本概念
在Matplotlib中,处理点击事件主要依赖于matplotlib.pyplot模块中的connect方法。该方法允许用户定义一个事件处理函数,当特定的事件发生时,该函数将被自动调用。对于鼠标点击事件,Matplotlib提供了button_press_event事件来捕捉。
2. 示例代码
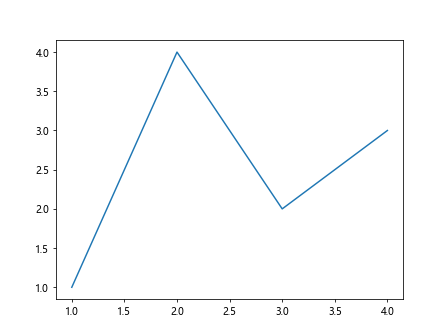
示例1:基础点击事件处理
import matplotlib.pyplot as plt

def onclick(event):
    print(f"Clicked at: {event.xdata}, {event.ydata}")

fig, ax = plt.subplots()
ax.plot([1, 2, 3, 4], [1, 4, 2, 3])
fig.canvas.mpl_connect('button_press_event', onclick)
plt.show()
Output:
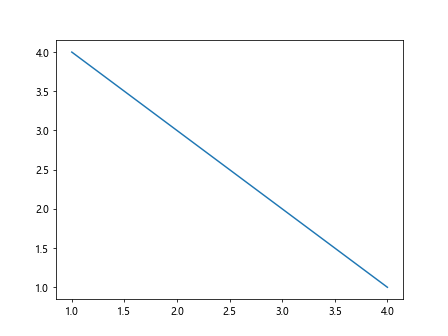
示例2:区分不同鼠标按钮的点击事件
import matplotlib.pyplot as plt

def onclick(event):
    if event.button == 1:
        print(f"Left Click at: {event.xdata}, {event.ydata}")
    elif event.button == 3:
        print(f"Right Click at: {event.xdata}, {event.ydata}")

fig, ax = plt.subplots()
ax.plot([1, 2, 3, 4], [4, 3, 2, 1])
fig.canvas.mpl_connect('button_press_event', onclick)
plt.show()
Output:
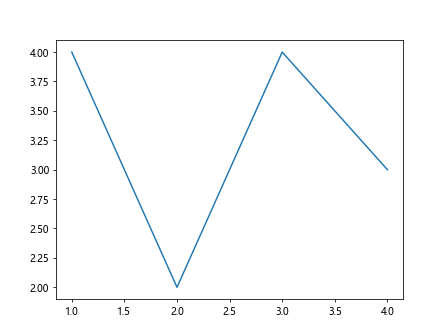
示例3:使用类方法处理点击事件
import matplotlib.pyplot as plt

class ClickHandler:
    def __init__(self, figure):
        self.figure = figure
        self.cid = figure.canvas.mpl_connect('button_press_event', self.onclick)

    def onclick(self, event):
        print(f"Clicked at: {event.xdata}, {event.ydata}")

fig, ax = plt.subplots()
click_handler = ClickHandler(fig)
ax.plot([1, 2, 3, 4], [4, 2, 4, 3])
plt.show()
Output:
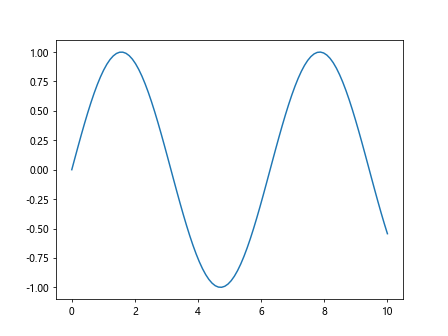
示例4:动态更新图表数据
import matplotlib.pyplot as plt
import numpy as np

x = np.linspace(0, 10, 100)
y = np.sin(x)

fig, ax = plt.subplots()
line, = ax.plot(x, y)

def onclick(event):
    if event.inaxes == ax:
        new_y = np.sin(x + event.xdata)
        line.set_ydata(new_y)
        fig.canvas.draw()

fig.canvas.mpl_connect('button_press_event', onclick)
plt.show()
Output:
示例5:在点击位置添加文本标注
import matplotlib.pyplot as plt

fig, ax = plt.subplots()
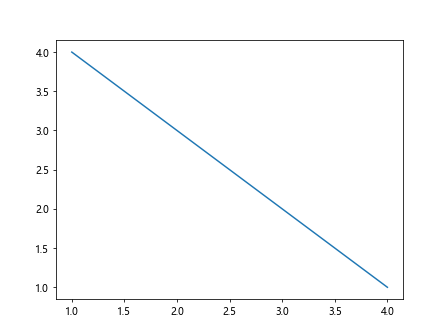
ax.plot([1, 2, 3, 4], [4, 3, 2, 1])

def onclick(event):
    ax.text(event.xdata, event.ydata, 'how2matplotlib.com', fontsize=9)
    fig.canvas.draw()

fig.canvas.mpl_connect('button_press_event', onclick)
plt.show()
Output:
示例6:结合键盘事件增强交互性
import matplotlib.pyplot as plt

fig, ax = plt.subplots()
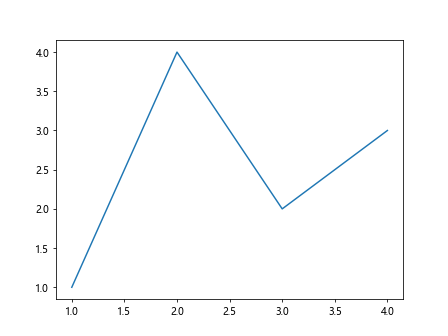
ax.plot([1, 2, 3, 4], [1, 4, 2, 3])

def onclick(event):
    if event.key == 'shift':
        ax.plot(event.xdata, event.ydata, 'ro')
    else:
        ax.text(event.xdata, event.ydata, 'how2matplotlib.com', fontsize=9)
    fig.canvas.draw()

fig.canvas.mpl_connect('button_press_event', onclick)
plt.show()
Output:
示例7:使用事件属性定制交互
import matplotlib.pyplot as plt

fig, ax = plt.subplots()
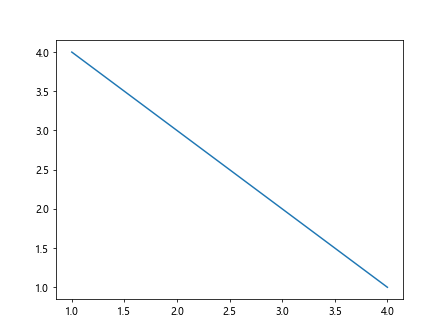
ax.plot([1, 2, 3, 4], [4, 3, 2, 1])

def onclick(event):
    if event.dblclick:
        ax.text(event.xdata, event.ydata, 'Double Clicked!', fontsize=12, color='red')
    else:
        ax.text(event.xdata, event.ydata, 'Single Click', fontsize=10)
    fig.canvas.draw()

fig.canvas.mpl_connect('button_press_event', onclick)
plt.show()
Output:
示例8:处理鼠标释放事件
import matplotlib.pyplot as plt

def onrelease(event):
    print(f"Released at: {event.xdata}, {event.ydata}")

fig, ax = plt.subplots()
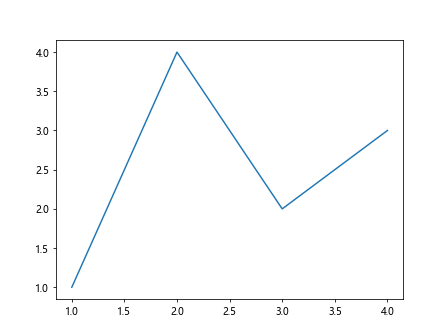
ax.plot([1, 2, 3, 4], [1, 4, 2, 3])
fig.canvas.mpl_connect('button_release_event', onrelease)
plt.show()
Output:
示例9:结合点击和释放事件实现区域选择
import matplotlib.pyplot as plt

click_position = None

def onclick(event):
    global click_position
    click_position = (event.xdata, event.ydata)

def onrelease(event):
    global click_position
    if click_position:
        ax.add_patch(plt.Rectangle(click_position, event.xdata - click_position[0], event.ydata - click_position[1], fill=False))
        fig.canvas.draw()
        click_position = None

fig, ax = plt.subplots()
fig.canvas.mpl_connect('button_press_event', onclick)
fig.canvas.mpl_connect('button_release_event', onrelease)
plt.show()
Output:
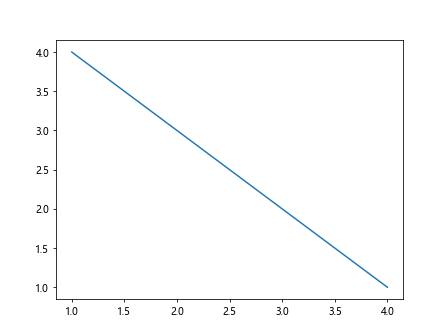
示例10:利用事件处理实现图表的缩放功能
import matplotlib.pyplot as plt

def onclick(event):
    ax.set_xlim(event.xdata - 1, event.xdata + 1)
    ax.set_ylim(event.ydata - 1, event.ydata + 1)
    fig.canvas.draw()

fig, ax = plt.subplots()
ax.plot([1, 2, 3, 4], [4, 3, 2, 1])
fig.canvas.mpl_connect('button_press_event', onclick)
plt.show()
Output:
以上示例代码展示了如何在Matplotlib中处理鼠标点击事件,包括基础的点击事件处理、区分不同鼠标按钮的点击、动态更新图表数据、在点击位置添加文本标注、结合键盘事件增强交互性、处理鼠标释放事件以及实现区域选择和图表缩放等功能。通过这些示例,你可以了解到Matplotlib在交互式数据可视化方面的强大功能,进而在自己的项目中根据需要定制交互式图表。
 极客笔记
极客笔记