Matplotlib 复选框控件:交互式数据可视化的强大工具
Matplotlib 是 Python 中最流行的数据可视化库之一,它不仅能创建静态图表,还提供了丰富的交互式功能。其中,复选框控件(Checkbox Widget)是一个非常实用的交互式工具,能让用户通过简单的点击来控制图表的显示内容。本文将深入探讨 Matplotlib 中的复选框控件,从基本概念到高级应用,帮助你掌握这一强大的数据可视化工具。
1. 复选框控件简介
复选框控件是 Matplotlib 中的一种交互式小部件,它允许用户通过勾选或取消勾选来控制图表中某些元素的显示或隐藏。这种控件特别适合用于多数据集的可视化,让用户能够自由选择想要查看的数据。
1.1 基本概念
复选框控件通常由以下几个部分组成:
– 复选框:用户可以点击的方框
– 标签:描述复选框功能的文本
– 回调函数:当复选框状态改变时执行的函数
1.2 创建复选框的基本步骤
- 导入必要的模块
- 创建图形和轴对象
- 绘制初始图形
- 创建复选框控件
- 定义回调函数
- 显示图形
让我们来看一个简单的例子:
import matplotlib.pyplot as plt
from matplotlib.widgets import CheckButtons
import numpy as np

# 创建数据
x = np.linspace(0, 10, 100)
y1 = np.sin(x)
y2 = np.cos(x)

# 创建图形和轴对象
fig, ax = plt.subplots()

# 绘制初始图形
line1, = ax.plot(x, y1, label='sin(x)')
line2, = ax.plot(x, y2, label='cos(x)')

# 创建复选框控件
rax = plt.axes([0.05, 0.4, 0.1, 0.15])
check = CheckButtons(rax, ('sin(x)', 'cos(x)'), (True, True))

# 定义回调函数
def func(label):
    if label == 'sin(x)':
        line1.set_visible(not line1.get_visible())
    elif label == 'cos(x)':
        line2.set_visible(not line2.get_visible())
    plt.draw()

check.on_clicked(func)

plt.title('How2matplotlib.com: Checkbox Widget Example')
plt.show()
Output:
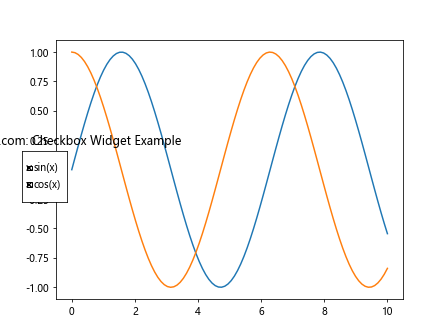
在这个例子中,我们创建了两条曲线(正弦和余弦),并添加了一个复选框控件来控制它们的显示。用户可以通过点击复选框来切换每条曲线的可见性。
2. 复选框控件的高级应用
2.1 多数据集控制
复选框控件非常适合用于控制多个数据集的显示。我们可以为每个数据集创建一个复选框,让用户自由选择想要查看的数据。
import matplotlib.pyplot as plt
from matplotlib.widgets import CheckButtons
import numpy as np

# 创建数据
x = np.linspace(0, 10, 100)
y1 = np.sin(x)
y2 = np.cos(x)
y3 = np.tan(x)
y4 = x**2

# 创建图形和轴对象
fig, ax = plt.subplots()

# 绘制初始图形
lines = []
lines.append(ax.plot(x, y1, label='sin(x)')[0])
lines.append(ax.plot(x, y2, label='cos(x)')[0])
lines.append(ax.plot(x, y3, label='tan(x)')[0])
lines.append(ax.plot(x, y4, label='x^2')[0])

# 创建复选框控件
rax = plt.axes([0.05, 0.4, 0.1, 0.15])
labels = [line.get_label() for line in lines]
visibility = [line.get_visible() for line in lines]
check = CheckButtons(rax, labels, visibility)

# 定义回调函数
def func(label):
    index = labels.index(label)
    lines[index].set_visible(not lines[index].get_visible())
    plt.draw()

check.on_clicked(func)

plt.title('How2matplotlib.com: Multiple Dataset Control')
plt.show()
Output:
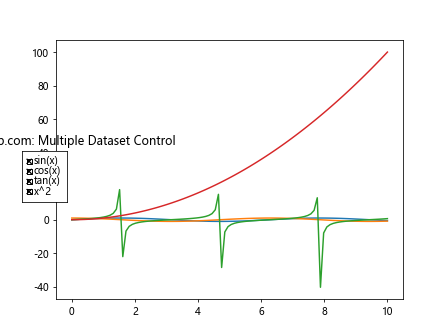
这个例子展示了如何使用复选框控件来控制多个数据集的显示。我们创建了四条不同的曲线,并为每条曲线添加了一个复选框。用户可以通过点击复选框来选择想要查看的曲线。
2.2 样式控制
除了控制数据集的显示与隐藏,复选框还可以用来改变图表的样式。例如,我们可以使用复选框来切换线条的样式、颜色或标记。
import matplotlib.pyplot as plt
from matplotlib.widgets import CheckButtons
import numpy as np

# 创建数据
x = np.linspace(0, 10, 100)
y = np.sin(x)

# 创建图形和轴对象
fig, ax = plt.subplots()

# 绘制初始图形
line, = ax.plot(x, y, 'b-', lw=2)

# 创建复选框控件
rax = plt.axes([0.05, 0.4, 0.1, 0.15])
check = CheckButtons(rax, ('Dashed', 'Red', 'Markers'), (False, False, False))

# 定义回调函数
def func(label):
    if label == 'Dashed':
        line.set_linestyle('--' if line.get_linestyle() == '-' else '-')
    elif label == 'Red':
        line.set_color('r' if line.get_color() == 'b' else 'b')
    elif label == 'Markers':
        line.set_marker('o' if line.get_marker() == '' else '')
    plt.draw()

check.on_clicked(func)

plt.title('How2matplotlib.com: Style Control with Checkboxes')
plt.show()
Output:
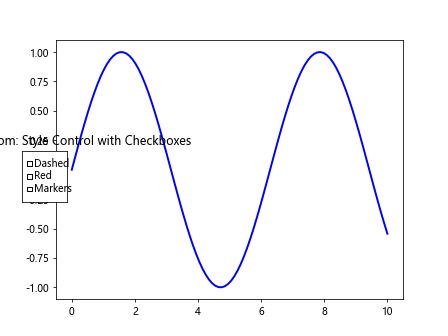
在这个例子中,我们使用复选框来控制线条的样式(实线/虚线)、颜色(蓝色/红色)和是否显示标记。用户可以通过点击复选框来改变这些样式属性。
2.3 动态数据更新
复选框控件还可以用于控制动态数据的更新。我们可以创建一个复选框来启动或停止数据的实时更新。
import matplotlib.pyplot as plt
from matplotlib.widgets import CheckButtons
import numpy as np
from matplotlib.animation import FuncAnimation

# 创建数据
x = np.linspace(0, 10, 100)
y = np.sin(x)

# 创建图形和轴对象
fig, ax = plt.subplots()

# 绘制初始图形
line, = ax.plot(x, y)

# 创建复选框控件
rax = plt.axes([0.05, 0.4, 0.1, 0.15])
check = CheckButtons(rax, ('Update',), (True,))

# 定义更新函数
def update(frame):
    if check.get_status()[0]:
        line.set_ydata(np.sin(x + frame / 10))
    return line,

# 创建动画
anim = FuncAnimation(fig, update, frames=200, interval=50, blit=True)

plt.title('How2matplotlib.com: Dynamic Data Update with Checkbox')
plt.show()
Output:
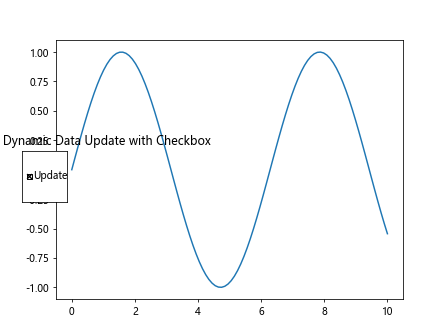
在这个例子中,我们创建了一个动画,显示一个移动的正弦波。复选框控制着动画的更新:当复选框被选中时,动画会继续更新;当复选框未被选中时,动画会暂停。
3. 复选框控件的自定义
3.1 自定义外观
Matplotlib 允许我们自定义复选框控件的外观,包括颜色、大小和字体等。
import matplotlib.pyplot as plt
from matplotlib.widgets import CheckButtons
import numpy as np

# 创建数据
x = np.linspace(0, 10, 100)
y1 = np.sin(x)
y2 = np.cos(x)

# 创建图形和轴对象
fig, ax = plt.subplots()

# 绘制初始图形
line1, = ax.plot(x, y1, label='sin(x)')
line2, = ax.plot(x, y2, label='cos(x)')

# 创建复选框控件
rax = plt.axes([0.05, 0.4, 0.1, 0.15])
check = CheckButtons(rax, ('sin(x)', 'cos(x)'), (True, True))

# 自定义复选框外观
check.rectangles[0].set_facecolor('lightblue')
check.rectangles[1].set_facecolor('lightgreen')
for text in check.labels:
    text.set_fontsize(10)
    text.set_color('navy')

# 定义回调函数
def func(label):
    if label == 'sin(x)':
        line1.set_visible(not line1.get_visible())
    elif label == 'cos(x)':
        line2.set_visible(not line2.get_visible())
    plt.draw()

check.on_clicked(func)

plt.title('How2matplotlib.com: Custom Checkbox Appearance')
plt.show()
Output:
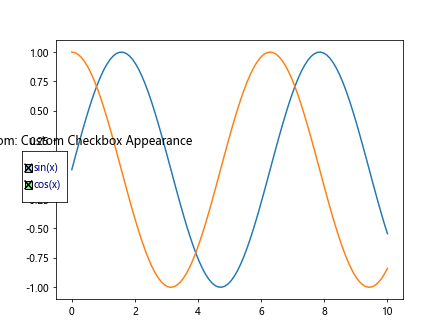
在这个例子中,我们自定义了复选框的背景颜色、标签字体大小和颜色。这样可以让复选框控件更好地融入到整体图表设计中。
3.2 自定义布局
我们还可以自定义复选框控件的布局,例如改变其位置、大小或排列方式。
import matplotlib.pyplot as plt
from matplotlib.widgets import CheckButtons
import numpy as np

# 创建数据
x = np.linspace(0, 10, 100)
y1 = np.sin(x)
y2 = np.cos(x)
y3 = np.tan(x)

# 创建图形和轴对象
fig, ax = plt.subplots()

# 绘制初始图形
lines = []
lines.append(ax.plot(x, y1, label='sin(x)')[0])
lines.append(ax.plot(x, y2, label='cos(x)')[0])
lines.append(ax.plot(x, y3, label='tan(x)')[0])

# 创建复选框控件
rax = plt.axes([0.05, 0.5, 0.2, 0.3])
labels = [line.get_label() for line in lines]
visibility = [line.get_visible() for line in lines]
check = CheckButtons(rax, labels, visibility)

# 自定义布局
check.set_orientation('vertical')
check.set_spacing(0.1)

# 定义回调函数
def func(label):
    index = labels.index(label)
    lines[index].set_visible(not lines[index].get_visible())
    plt.draw()

check.on_clicked(func)

plt.title('How2matplotlib.com: Custom Checkbox Layout')
plt.show()
在这个例子中,我们将复选框控件设置为垂直排列,并增加了复选框之间的间距。这种布局可能更适合某些特定的图表设计。
4. 复选框控件与其他交互式工具的结合
复选框控件可以与 Matplotlib 的其他交互式工具结合使用,创造出更丰富的交互体验。
4.1 与滑块结合
我们可以将复选框控件与滑块控件结合,实现更复杂的交互功能。
import matplotlib.pyplot as plt
from matplotlib.widgets import CheckButtons, Slider
import numpy as np

# 创建数据
x = np.linspace(0, 10, 100)
y1 = np.sin(x)
y2 = np.cos(x)

# 创建图形和轴对象
fig, ax = plt.subplots()

# 绘制初始图形
line1, = ax.plot(x, y1, label='sin(x)')
line2, = ax.plot(x, y2, label='cos(x)')

# 创建复选框控件
check_ax = plt.axes([0.05, 0.5, 0.1, 0.15])
check = CheckButtons(check_ax, ('sin(x)', 'cos(x)'), (True, True))

# 创建滑块控件
slider_ax = plt.axes([0.1, 0.02, 0.8, 0.03])
slider = Slider(slider_ax, 'Frequency', 0.1, 10.0, valinit=1)

# 定义复选框回调函数
def check_func(label):
    if label == 'sin(x)':
        line1.set_visible(not line1.get_visible())
    elif label == 'cos(x)':
        line2.set_visible(not line2.get_visible())
    plt.draw()

# 定义滑块回调函数
def slider_func(val):
    freq = slider.val
    line1.set_ydata(np.sin(freq * x))
    line2.set_ydata(np.cos(freq * x))
    fig.canvas.draw_idle()

check.on_clicked(check_func)
slider.on_changed(slider_func)

plt.title('How2matplotlib.com: Checkbox and Slider Combination')
plt.show()
Output:
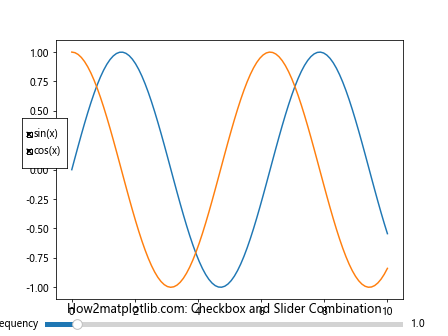
在这个例子中,我们结合了复选框和滑块控件。复选框用于控制曲线的显示与隐藏,而滑块用于调整曲线的频率。这种组合为用户提供了更丰富的交互选项。
4.2 与按钮结合
复选框控件还可以与按钮控件结合,实现更多的交互功能。
import matplotlib.pyplot as plt
from matplotlib.widgets import CheckButtons, Button
import numpy as np

# 创建数据x = np.linspace(0, 10, 100)
y1 = np.sin(x)
y2 = np.cos(x)

# 创建图形和轴对象
fig, ax = plt.subplots()

# 绘制初始图形
line1, = ax.plot(x, y1, label='sin(x)')
line2, = ax.plot(x, y2, label='cos(x)')

# 创建复选框控件
check_ax = plt.axes([0.05, 0.5, 0.1, 0.15])
check = CheckButtons(check_ax, ('sin(x)', 'cos(x)'), (True, True))

# 创建按钮控件
button_ax = plt.axes([0.8, 0.05, 0.1, 0.075])
button = Button(button_ax, 'Reset')

# 定义复选框回调函数
def check_func(label):
    if label == 'sin(x)':
        line1.set_visible(not line1.get_visible())
    elif label == 'cos(x)':
        line2.set_visible(not line2.get_visible())
    plt.draw()

# 定义按钮回调函数
def button_func(event):
    line1.set_visible(True)
    line2.set_visible(True)
    check.set_active(0)
    check.set_active(1)
    plt.draw()

check.on_clicked(check_func)
button.on_clicked(button_func)

plt.title('How2matplotlib.com: Checkbox and Button Combination')
plt.show()
在这个例子中,我们结合了复选框和按钮控件。复选框用于控制曲线的显示与隐藏,而按钮用于重置图表到初始状态。这种组合为用户提供了更多的控制选项。
5. 复选框控件在实际应用中的使用
复选框控件在许多实际应用中都有广泛的用途。让我们来看几个具体的例子。
5.1 数据分析工具
在数据分析工具中,复选框控件可以用来选择要分析的特征或数据集。
import matplotlib.pyplot as plt
from matplotlib.widgets import CheckButtons
import numpy as np

# 创建模拟数据
np.random.seed(0)
data = {
    'Feature A': np.random.randn(100),
    'Feature B': np.random.randn(100),
    'Feature C': np.random.randn(100),
    'Feature D': np.random.randn(100)
}

# 创建图形和轴对象
fig, ax = plt.subplots()

# 绘制初始图形
lines = []
for feature, values in data.items():
    line, = ax.plot(values, label=feature)
    lines.append(line)

# 创建复选框控件
rax = plt.axes([0.05, 0.4, 0.1, 0.15])
labels = list(data.keys())
visibility = [True] * len(labels)
check = CheckButtons(rax, labels, visibility)

# 定义回调函数
def func(label):
    index = labels.index(label)
    lines[index].set_visible(not lines[index].get_visible())
    plt.draw()

check.on_clicked(func)

plt.title('How2matplotlib.com: Data Analysis Tool')
plt.legend()
plt.show()
在这个数据分析工具的例子中,用户可以通过复选框来选择要显示的特征,从而比较不同特征的分布情况。
5.2 多图层地图
在地图可视化中,复选框控件可以用来控制不同图层的显示。
import matplotlib.pyplot as plt
from matplotlib.widgets import CheckButtons
import numpy as np

# 创建模拟地图数据
np.random.seed(0)
map_data = np.random.rand(10, 10)
roads = np.random.rand(10, 10) > 0.8
buildings = np.random.rand(10, 10) > 0.9

# 创建图形和轴对象
fig, ax = plt.subplots()

# 绘制初始图形
base_map = ax.imshow(map_data, cmap='terrain')
road_layer = ax.imshow(roads, cmap='binary', alpha=0.5)
building_layer = ax.imshow(buildings, cmap='cool', alpha=0.5)

# 创建复选框控件
rax = plt.axes([0.05, 0.4, 0.1, 0.15])
layers = ['Roads', 'Buildings']
visibility = [True, True]
check = CheckButtons(rax, layers, visibility)

# 定义回调函数
def func(label):
    if label == 'Roads':
        road_layer.set_visible(not road_layer.get_visible())
    elif label == 'Buildings':
        building_layer.set_visible(not building_layer.get_visible())
    plt.draw()

check.on_clicked(func)

plt.title('How2matplotlib.com: Multi-layer Map')
plt.show()
Output:
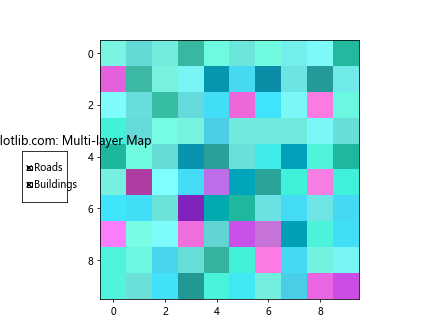
在这个多图层地图的例子中,用户可以通过复选框来控制道路和建筑物图层的显示,从而自定义地图的显示内容。
5.3 股票市场分析工具
在股票市场分析工具中,复选框控件可以用来选择要显示的股票或指标。
import matplotlib.pyplot as plt
from matplotlib.widgets import CheckButtons
import numpy as np

# 创建模拟股票数据
np.random.seed(0)
dates = np.arange('2023-01-01', '2023-12-31', dtype='datetime64[D]')
stocks = {
    'Stock A': 100 + np.cumsum(np.random.randn(len(dates))),
    'Stock B': 100 + np.cumsum(np.random.randn(len(dates))),
    'Stock C': 100 + np.cumsum(np.random.randn(len(dates)))
}

# 创建图形和轴对象
fig, ax = plt.subplots(figsize=(12, 6))

# 绘制初始图形
lines = []
for stock, prices in stocks.items():
    line, = ax.plot(dates, prices, label=stock)
    lines.append(line)

# 创建复选框控件
rax = plt.axes([0.05, 0.4, 0.1, 0.15])
labels = list(stocks.keys())
visibility = [True] * len(labels)
check = CheckButtons(rax, labels, visibility)

# 定义回调函数
def func(label):
    index = labels.index(label)
    lines[index].set_visible(not lines[index].get_visible())
    plt.draw()

check.on_clicked(func)

plt.title('How2matplotlib.com: Stock Market Analysis Tool')
plt.xlabel('Date')
plt.ylabel('Price')
plt.legend()
plt.show()
在这个股票市场分析工具的例子中,用户可以通过复选框来选择要显示的股票,从而比较不同股票的价格走势。
6. 复选框控件的性能优化
当处理大量数据或复杂图表时,复选框控件的性能可能会成为一个问题。以下是一些优化建议:
6.1 使用 blitting
Blitting 是一种优化技术,可以显著提高动画和交互的性能。
import matplotlib.pyplot as plt
from matplotlib.widgets import CheckButtons
import numpy as np

# 创建数据
x = np.linspace(0, 10, 1000)
y1 = np.sin(x)
y2 = np.cos(x)

# 创建图形和轴对象
fig, ax = plt.subplots()

# 绘制初始图形
line1, = ax.plot(x, y1, label='sin(x)')
line2, = ax.plot(x, y2, label='cos(x)')

# 创建复选框控件
rax = plt.axes([0.05, 0.4, 0.1, 0.15])
check = CheckButtons(rax, ('sin(x)', 'cos(x)'), (True, True))

# 定义回调函数
def func(label):
    if label == 'sin(x)':
        line1.set_visible(not line1.get_visible())
    elif label == 'cos(x)':
        line2.set_visible(not line2.get_visible())
    fig.canvas.draw_idle()

check.on_clicked(func)

# 启用 blitting
fig.canvas.draw()
background = fig.canvas.copy_from_bbox(fig.bbox)

def on_draw(event):
    fig.canvas.restore_region(background)
    ax.draw_artist(line1)
    ax.draw_artist(line2)
    fig.canvas.blit(fig.bbox)

fig.canvas.mpl_connect('draw_event', on_draw)

plt.title('How2matplotlib.com: Performance Optimization with Blitting')
plt.show()
Output:
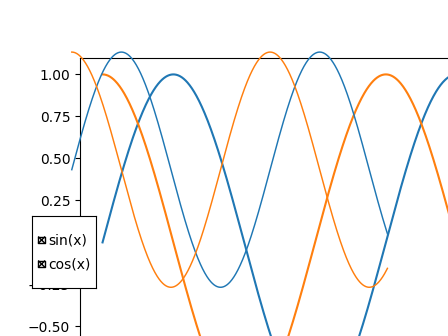
在这个例子中,我们使用了 blitting 技术来优化复选框控件的性能。这种方法特别适用于处理大量数据或复杂图表时。
6.2 减少重绘次数
另一种优化方法是减少重绘的次数,只在必要时更新图表。
import matplotlib.pyplot as plt
from matplotlib.widgets import CheckButtons
import numpy as np

# 创建数据
x = np.linspace(0, 10, 1000)
y1 = np.sin(x)
y2 = np.cos(x)

# 创建图形和轴对象
fig, ax = plt.subplots()

# 绘制初始图形
line1, = ax.plot(x, y1, label='sin(x)')
line2, = ax.plot(x, y2, label='cos(x)')

# 创建复选框控件
rax = plt.axes([0.05, 0.4, 0.1, 0.15])
check = CheckButtons(rax, ('sin(x)', 'cos(x)'), (True, True))

# 定义回调函数
def func(label):
    if label == 'sin(x)':
        line1.set_visible(not line1.get_visible())
    elif label == 'cos(x)':
        line2.set_visible(not line2.get_visible())

    # 只更新需要更新的部分
    ax.draw_artist(line1)
    ax.draw_artist(line2)
    fig.canvas.blit(ax.bbox)

check.on_clicked(func)

plt.title('How2matplotlib.com: Reducing Redraw Frequency')
plt.show()
Output:
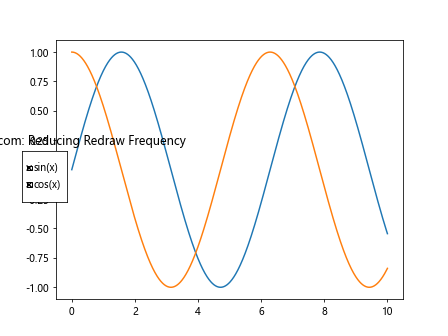
在这个例子中,我们只更新了需要更新的部分,而不是重绘整个图表。这种方法可以显著提高性能,特别是在处理大量数据时。
结论
Matplotlib 的复选框控件是一个强大而灵活的工具,可以大大增强数据可视化的交互性。通过本文的详细介绍和丰富的示例,我们探讨了复选框控件的基本概念、高级应用、自定义方法以及与其他交互式工具的结合使用。我们还讨论了复选框控件在实际应用中的使用场景,以及如何优化其性能。
无论是用于数据分析、地图可视化还是金融市场分析,复选框控件都能为用户提供直观、灵活的交互体验。通过掌握这一工具,你可以创建更加动态、信息丰富的数据可视化作品,让你的数据故事更具吸引力和说服力。
 极客笔记
极客笔记