Matplotlib 交互式按钮控件:如何使用 Button Widget 增强数据可视化
Matplotlib 是 Python 中最流行的数据可视化库之一,它不仅能够创建静态图表,还提供了一系列交互式工具来增强用户体验。其中,Button Widget(按钮控件)是一个非常实用的交互式元素,可以让用户通过点击按钮来控制图表的显示和更新。本文将深入探讨 Matplotlib 中的 Button Widget,从基本用法到高级应用,帮助你掌握这一强大的可视化工具。
1. Button Widget 简介
Button Widget 是 Matplotlib 中的一个交互式控件,它允许用户通过点击按钮来触发特定的操作。这个控件属于 matplotlib.widgets 模块,可以轻松地添加到现有的 Matplotlib 图表中。使用 Button Widget 可以实现诸如更新数据、切换图表类型、调整显示范围等功能,从而使得数据可视化更加灵活和交互。
以下是一个简单的示例,展示了如何创建一个基本的 Button Widget:
import matplotlib.pyplot as plt
from matplotlib.widgets import Button

fig, ax = plt.subplots()
plt.subplots_adjust(bottom=0.2)

def button_click(event):
    print("Button clicked! - how2matplotlib.com")

ax_button = plt.axes([0.4, 0.05, 0.2, 0.075])
button = Button(ax_button, 'Click Me!')
button.on_clicked(button_click)

plt.show()
Output:
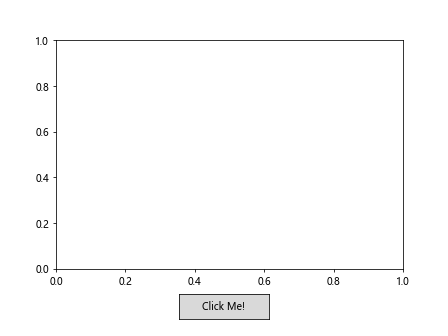
在这个例子中,我们创建了一个简单的按钮,并定义了一个回调函数 button_click,当按钮被点击时,它会打印一条消息。
2. Button Widget 的基本属性
Button Widget 有几个重要的属性,可以用来自定义按钮的外观和行为:
label:按钮上显示的文本color:按钮的背景颜色hovercolor:鼠标悬停时的按钮颜色
让我们通过一个示例来展示如何设置这些属性:
import matplotlib.pyplot as plt
from matplotlib.widgets import Button

fig, ax = plt.subplots()
plt.subplots_adjust(bottom=0.2)

ax_button = plt.axes([0.3, 0.05, 0.4, 0.1])
button = Button(ax_button, 'Custom Button - how2matplotlib.com', color='lightblue', hovercolor='lightgreen')

def button_click(event):
    print("Custom button clicked!")

button.on_clicked(button_click)

plt.show()
Output:
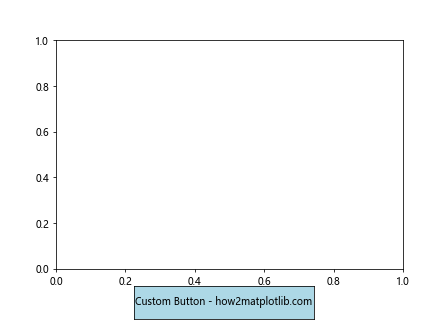
在这个例子中,我们创建了一个自定义的按钮,设置了背景颜色为浅蓝色,鼠标悬停时的颜色为浅绿色。
3. 使用 Button Widget 更新图表
Button Widget 的一个常见用途是更新图表的内容。我们可以通过按钮点击来改变数据、调整样式或切换图表类型。下面是一个示例,展示了如何使用按钮来切换折线图和散点图:
import matplotlib.pyplot as plt
import numpy as np
from matplotlib.widgets import Button

fig, ax = plt.subplots()
plt.subplots_adjust(bottom=0.2)

x = np.linspace(0, 10, 100)
y = np.sin(x)

line, = ax.plot(x, y, label='how2matplotlib.com')
scatter = ax.scatter([], [], color='red', label='Scatter')
ax.legend()

def toggle_plot(event):
    if line.get_visible():
        line.set_visible(False)
        scatter.set_offsets(np.column_stack((x, y)))
    else:
        line.set_visible(True)
        scatter.set_offsets(np.empty((0, 2)))
    fig.canvas.draw_idle()

ax_button = plt.axes([0.4, 0.05, 0.2, 0.075])
button = Button(ax_button, 'Toggle Plot')
button.on_clicked(toggle_plot)

plt.show()
Output:
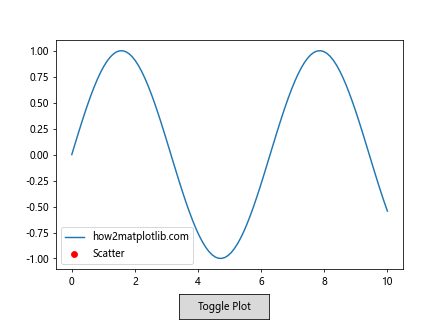
这个例子创建了一个按钮,可以在折线图和散点图之间切换。每次点击按钮时,toggle_plot 函数会被调用,切换图表的显示状态。
4. 多个 Button Widget 的使用
在复杂的可视化应用中,我们可能需要多个按钮来控制不同的功能。Matplotlib 允许我们轻松地添加多个 Button Widget。下面是一个示例,展示了如何使用多个按钮来控制图表的不同方面:
import matplotlib.pyplot as plt
import numpy as np
from matplotlib.widgets import Button

fig, ax = plt.subplots()
plt.subplots_adjust(bottom=0.3)

x = np.linspace(0, 10, 100)
y = np.sin(x)
line, = ax.plot(x, y)

def change_color(event):
    line.set_color('red')
    fig.canvas.draw_idle()

def change_style(event):
    line.set_linestyle('--')
    fig.canvas.draw_idle()

def reset(event):
    line.set_color('blue')
    line.set_linestyle('-')
    fig.canvas.draw_idle()

ax_color = plt.axes([0.2, 0.05, 0.2, 0.075])
ax_style = plt.axes([0.45, 0.05, 0.2, 0.075])
ax_reset = plt.axes([0.7, 0.05, 0.2, 0.075])

btn_color = Button(ax_color, 'Change Color')
btn_style = Button(ax_style, 'Change Style')
btn_reset = Button(ax_reset, 'Reset')

btn_color.on_clicked(change_color)
btn_style.on_clicked(change_style)
btn_reset.on_clicked(reset)

plt.title('Multiple Buttons - how2matplotlib.com')
plt.show()
Output:
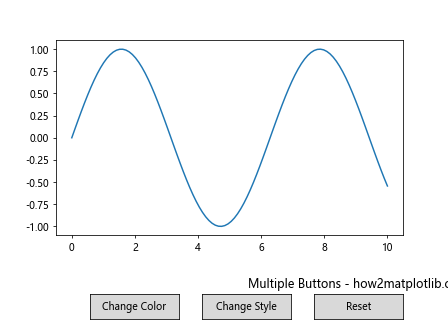
这个例子创建了三个按钮,分别用于改变线条颜色、改变线条样式和重置图表。每个按钮都有自己的回调函数,用于执行相应的操作。
5. Button Widget 与其他交互式控件的结合
Button Widget 可以与 Matplotlib 的其他交互式控件结合使用,以创建更复杂的交互式可视化。例如,我们可以将 Button Widget 与 Slider 控件结合,允许用户通过滑块调整参数,然后使用按钮来应用更改。
以下是一个结合 Button 和 Slider 的示例:
import matplotlib.pyplot as plt
import numpy as np
from matplotlib.widgets import Button, Slider

fig, ax = plt.subplots()
plt.subplots_adjust(bottom=0.3)

x = np.linspace(0, 10, 100)
y = np.sin(x)
line, = ax.plot(x, y)

ax_freq = plt.axes([0.2, 0.15, 0.6, 0.03])
slider_freq = Slider(ax_freq, 'Frequency', 0.1, 10.0, valinit=1)

def update(val):
    freq = slider_freq.val
    line.set_ydata(np.sin(freq * x))
    fig.canvas.draw_idle()

def apply_changes(event):
    update(slider_freq.val)
    plt.title(f'Sine Wave (f={slider_freq.val:.2f}) - how2matplotlib.com')

slider_freq.on_changed(update)

ax_button = plt.axes([0.4, 0.05, 0.2, 0.075])
button = Button(ax_button, 'Apply Changes')
button.on_clicked(apply_changes)

plt.show()
Output:
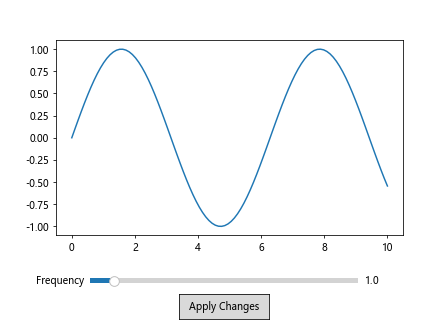
在这个例子中,我们创建了一个滑块来调整正弦波的频率,以及一个按钮来应用更改并更新图表标题。用户可以使用滑块实时预览变化,然后点击按钮确认更改。
6. 自定义 Button Widget 的样式
Matplotlib 允许我们自定义 Button Widget 的样式,以更好地适应整体的可视化设计。我们可以通过修改按钮的属性来改变其外观。以下是一个展示如何自定义按钮样式的示例:
import matplotlib.pyplot as plt
from matplotlib.widgets import Button

fig, ax = plt.subplots()
plt.subplots_adjust(bottom=0.2)

class CustomButton(Button):
    def __init__(self, *args, **kwargs):
        super().__init__(*args, **kwargs)
        self.ax.patch.set_facecolor('lightgray')
        self.ax.patch.set_edgecolor('darkgray')
        self.ax.patch.set_alpha(0.8)
        self.label.set_fontsize(12)
        self.label.set_weight('bold')

def button_click(event):
    print("Custom styled button clicked! - how2matplotlib.com")

ax_button = plt.axes([0.3, 0.05, 0.4, 0.1])
button = CustomButton(ax_button, 'Styled Button')
button.on_clicked(button_click)

plt.show()
Output:
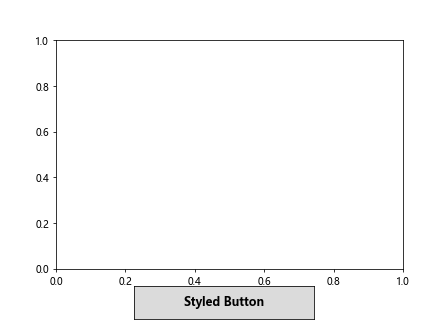
在这个例子中,我们创建了一个 CustomButton 类,继承自 Button,并在其中自定义了按钮的样式。这包括设置背景颜色、边框颜色、透明度以及文本的字体大小和粗细。
7. 使用 Button Widget 控制动画
Button Widget 还可以用来控制 Matplotlib 中的动画。我们可以创建开始、暂停和重置按钮来控制动画的播放。以下是一个使用按钮控制简单动画的示例:
import matplotlib.pyplot as plt
import numpy as np
from matplotlib.animation import FuncAnimation
from matplotlib.widgets import Button

fig, ax = plt.subplots()
plt.subplots_adjust(bottom=0.2)

x = np.linspace(0, 2 * np.pi, 100)
line, = ax.plot(x, np.sin(x))

ani = None
paused = False

def animate(frame):
    line.set_ydata(np.sin(x + frame / 10))
    return line,

def start_animation(event):
    global ani
    if ani is None:
        ani = FuncAnimation(fig, animate, frames=200, interval=50, blit=True)
    elif paused:
        ani.resume()
    plt.title('Animation Running - how2matplotlib.com')

def pause_animation(event):
    global paused
    if ani is not None:
        if not paused:
            ani.pause()
            paused = True
            plt.title('Animation Paused - how2matplotlib.com')
        else:
            ani.resume()
            paused = False
            plt.title('Animation Running - how2matplotlib.com')

def reset_animation(event):
    global ani, paused
    if ani is not None:
        ani.event_source.stop()
        ani = None
    paused = False
    line.set_ydata(np.sin(x))
    plt.title('Animation Reset - how2matplotlib.com')
    fig.canvas.draw_idle()

ax_start = plt.axes([0.2, 0.05, 0.2, 0.075])
ax_pause = plt.axes([0.45, 0.05, 0.2, 0.075])
ax_reset = plt.axes([0.7, 0.05, 0.2, 0.075])

btn_start = Button(ax_start, 'Start')
btn_pause = Button(ax_pause, 'Pause/Resume')
btn_reset = Button(ax_reset, 'Reset')

btn_start.on_clicked(start_animation)
btn_pause.on_clicked(pause_animation)
btn_reset.on_clicked(reset_animation)

plt.show()
Output:
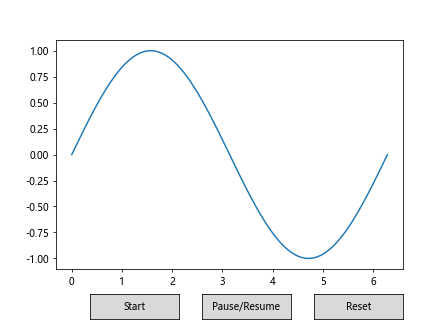
这个例子创建了一个简单的正弦波动画,并使用三个按钮来控制动画的开始、暂停/恢复和重置。
8. Button Widget 的事件处理
Button Widget 的核心功能是响应用户的点击事件。我们可以通过 on_clicked 方法为按钮添加事件处理函数。但有时,我们可能需要更复杂的事件处理逻辑。以下是一个展示如何处理不同类型鼠标事件的示例:
import matplotlib.pyplot as plt
from matplotlib.widgets import Button

fig, ax = plt.subplots()
plt.subplots_adjust(bottom=0.2)

class AdvancedButton(Button):
    def __init__(self, *args, **kwargs):
        super().__init__(*args, **kwargs)
        self.connect_event('button_press_event', self._on_press)
        self.connect_event('button_release_event', self._on_release)

    def _on_press(self, event):
        if event.inaxes == self.ax:
            self.ax.set_facecolor('red')
            self.ax.figure.canvas.draw_idle()

    def _on_release(self, event):
        if event.inaxes == self.ax:
            self.ax.set_facecolor('lightgray')
            self.ax.figure.canvas.draw_idle()
            print(f"Button clicked with {event.button} - how2matplotlib.com")

ax_button = plt.axes([0.3, 0.05, 0.4, 0.1])
button = AdvancedButton(ax_button, 'Advanced Button')

plt.show()
Output:
在这个例子中,我们创建了一个 AdvancedButton 类,它可以响应按下和释放事件。当鼠标按下时,按钮变红;当鼠标释放时,按钮恢复原色并打印一条消息。
9. 使用 Button Widget 实现图表导出功能
Button Widget 还可以用来实现一些实用功能,比如将当前图表导出为图片文件。以下是一个示例,展示如何使用按钮来保存图表:
import matplotlib.pyplot as plt
import numpy as np
from matplotlib.widgets import Button

fig, ax =plt.subplots()
plt.subplots_adjust(bottom=0.2)

x = np.linspace(0, 10, 100)
y = np.sin(x)
ax.plot(x, y)
ax.set_title('Sine Wave - how2matplotlib.com')

def save_figure(event):
    fig.savefig('sine_wave_plot.png')
    print("Figure saved as 'sine_wave_plot.png' - how2matplotlib.com")

ax_button = plt.axes([0.4, 0.05, 0.2, 0.075])
button = Button(ax_button, 'Save Figure')
button.on_clicked(save_figure)

plt.show()
Output:
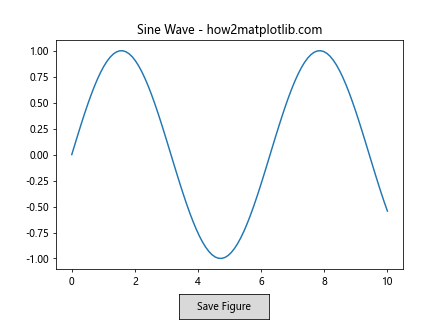
这个例子创建了一个按钮,点击后可以将当前图表保存为 PNG 文件。这种功能在创建交互式数据分析工具时特别有用。
10. Button Widget 与子图的结合使用
在复杂的可视化中,我们可能需要在多个子图上使用 Button Widget。以下是一个示例,展示如何在包含多个子图的图表中使用按钮:
import matplotlib.pyplot as plt
import numpy as np
from matplotlib.widgets import Button

fig, (ax1, ax2) = plt.subplots(2, 1, figsize=(8, 10))
plt.subplots_adjust(bottom=0.2)

x = np.linspace(0, 10, 100)
y1 = np.sin(x)
y2 = np.cos(x)

line1, = ax1.plot(x, y1)
line2, = ax2.plot(x, y2)

ax1.set_title('Sine Wave - how2matplotlib.com')
ax2.set_title('Cosine Wave - how2matplotlib.com')

def update_sine(event):
    y1_new = np.sin(2 * x)
    line1.set_ydata(y1_new)
    ax1.set_title('Updated Sine Wave - how2matplotlib.com')
    fig.canvas.draw_idle()

def update_cosine(event):
    y2_new = np.cos(2 * x)
    line2.set_ydata(y2_new)
    ax2.set_title('Updated Cosine Wave - how2matplotlib.com')
    fig.canvas.draw_idle()

ax_button1 = plt.axes([0.2, 0.05, 0.2, 0.075])
ax_button2 = plt.axes([0.6, 0.05, 0.2, 0.075])

button1 = Button(ax_button1, 'Update Sine')
button2 = Button(ax_button2, 'Update Cosine')

button1.on_clicked(update_sine)
button2.on_clicked(update_cosine)

plt.show()
Output:
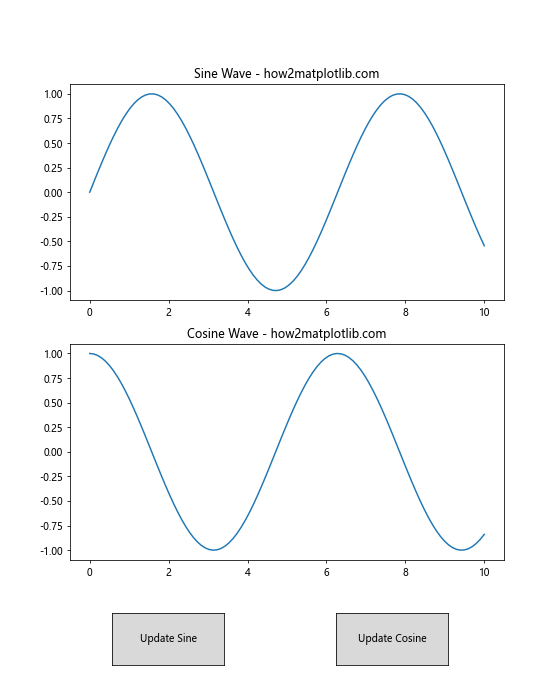
这个例子创建了两个子图,分别显示正弦波和余弦波。我们添加了两个按钮,可以分别更新这两个子图的内容。
11. 使用 Button Widget 实现图表缩放功能
Button Widget 还可以用来实现图表的缩放功能。以下是一个示例,展示如何使用按钮来放大和缩小图表:
import matplotlib.pyplot as plt
import numpy as np
from matplotlib.widgets import Button

fig, ax = plt.subplots()
plt.subplots_adjust(bottom=0.2)

x = np.linspace(0, 10, 100)
y = np.sin(x)
line, = ax.plot(x, y)

ax.set_xlim(0, 10)
ax.set_ylim(-1.5, 1.5)

def zoom_in(event):
    xlim = ax.get_xlim()
    ylim = ax.get_ylim()
    ax.set_xlim(xlim[0] * 0.9, xlim[1] * 0.9)
    ax.set_ylim(ylim[0] * 0.9, ylim[1] * 0.9)
    fig.canvas.draw_idle()

def zoom_out(event):
    xlim = ax.get_xlim()
    ylim = ax.get_ylim()
    ax.set_xlim(xlim[0] * 1.1, xlim[1] * 1.1)
    ax.set_ylim(ylim[0] * 1.1, ylim[1] * 1.1)
    fig.canvas.draw_idle()

ax_zoomin = plt.axes([0.3, 0.05, 0.2, 0.075])
ax_zoomout = plt.axes([0.55, 0.05, 0.2, 0.075])

btn_zoomin = Button(ax_zoomin, 'Zoom In')
btn_zoomout = Button(ax_zoomout, 'Zoom Out')

btn_zoomin.on_clicked(zoom_in)
btn_zoomout.on_clicked(zoom_out)

plt.title('Zoomable Plot - how2matplotlib.com')
plt.show()
Output:
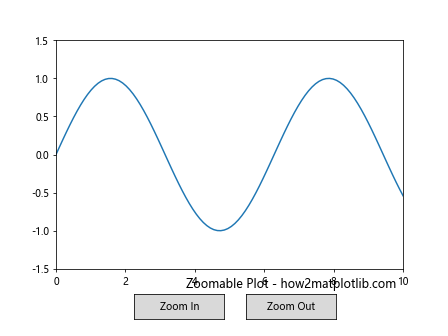
这个例子创建了两个按钮,允许用户放大和缩小图表。每次点击按钮时,图表的显示范围会相应地调整。
12. 使用 Button Widget 切换数据集
在数据分析中,我们可能需要在不同的数据集之间切换。Button Widget 可以用来实现这种功能。以下是一个示例,展示如何使用按钮来切换显示不同的数据集:
import matplotlib.pyplot as plt
import numpy as np
from matplotlib.widgets import Button

fig, ax = plt.subplots()
plt.subplots_adjust(bottom=0.2)

x = np.linspace(0, 10, 100)
y1 = np.sin(x)
y2 = np.cos(x)
y3 = np.tan(x)

line, = ax.plot(x, y1)
ax.set_ylim(-10, 10)

current_dataset = 0
datasets = [y1, y2, y3]
dataset_names = ['Sine', 'Cosine', 'Tangent']

def switch_dataset(event):
    global current_dataset
    current_dataset = (current_dataset + 1) % len(datasets)
    line.set_ydata(datasets[current_dataset])
    ax.set_title(f'{dataset_names[current_dataset]} Wave - how2matplotlib.com')
    fig.canvas.draw_idle()

ax_button = plt.axes([0.4, 0.05, 0.2, 0.075])
button = Button(ax_button, 'Switch Dataset')
button.on_clicked(switch_dataset)

plt.title('Sine Wave - how2matplotlib.com')
plt.show()
Output:
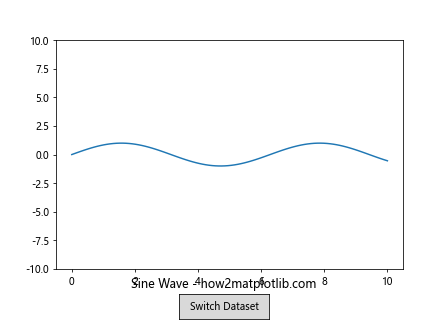
这个例子创建了一个按钮,可以在正弦、余弦和正切三个数据集之间循环切换。每次点击按钮时,图表会更新为下一个数据集。
13. 使用 Button Widget 实现图表样式切换
Button Widget 还可以用来切换图表的样式,如线条颜色、线型等。以下是一个示例,展示如何使用按钮来切换图表样式:
import matplotlib.pyplot as plt
import numpy as np
from matplotlib.widgets import Button

fig, ax = plt.subplots()
plt.subplots_adjust(bottom=0.2)

x = np.linspace(0, 10, 100)
y = np.sin(x)

line, = ax.plot(x, y, 'b-')

styles = [('b-', 'Blue Solid'), ('r--', 'Red Dashed'), ('g:', 'Green Dotted'), ('m-.', 'Magenta Dash-Dot')]
current_style = 0

def change_style(event):
    global current_style
    current_style = (current_style + 1) % len(styles)
    line.set_color(styles[current_style][0][0])
    line.set_linestyle(styles[current_style][0][1:])
    ax.set_title(f'{styles[current_style][1]} Line - how2matplotlib.com')
    fig.canvas.draw_idle()

ax_button = plt.axes([0.4, 0.05, 0.2, 0.075])
button = Button(ax_button, 'Change Style')
button.on_clicked(change_style)

plt.title('Blue Solid Line - how2matplotlib.com')
plt.show()
Output:
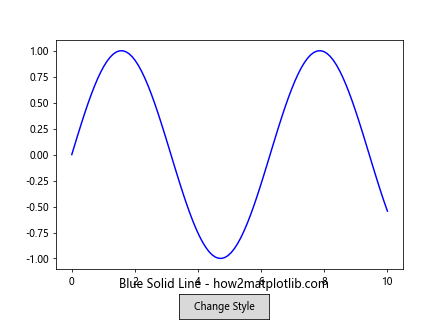
这个例子创建了一个按钮,可以在不同的线条样式之间切换。每次点击按钮时,图表的线条颜色和线型都会改变。
14. 使用 Button Widget 实现数据筛选
Button Widget 可以用来实现数据筛选功能,允许用户选择显示数据的特定子集。以下是一个示例,展示如何使用按钮来筛选数据:
import matplotlib.pyplot as plt
import numpy as np
from matplotlib.widgets import Button

fig, ax = plt.subplots()
plt.subplots_adjust(bottom=0.2)

x = np.linspace(0, 10, 100)
y = np.sin(x)

line, = ax.plot(x, y)

def filter_positive(event):
    mask = y > 0
    line.set_data(x[mask], y[mask])
    ax.set_title('Positive Values - how2matplotlib.com')
    fig.canvas.draw_idle()

def filter_negative(event):
    mask = y < 0
    line.set_data(x[mask], y[mask])
    ax.set_title('Negative Values - how2matplotlib.com')
    fig.canvas.draw_idle()

def show_all(event):
    line.set_data(x, y)
    ax.set_title('All Values - how2matplotlib.com')
    fig.canvas.draw_idle()

ax_positive = plt.axes([0.2, 0.05, 0.2, 0.075])
ax_negative = plt.axes([0.45, 0.05, 0.2, 0.075])
ax_all = plt.axes([0.7, 0.05, 0.2, 0.075])

btn_positive = Button(ax_positive, 'Positive')
btn_negative = Button(ax_negative, 'Negative')
btn_all = Button(ax_all, 'All')

btn_positive.on_clicked(filter_positive)
btn_negative.on_clicked(filter_negative)
btn_all.on_clicked(show_all)

plt.title('All Values - how2matplotlib.com')
plt.show()
Output:
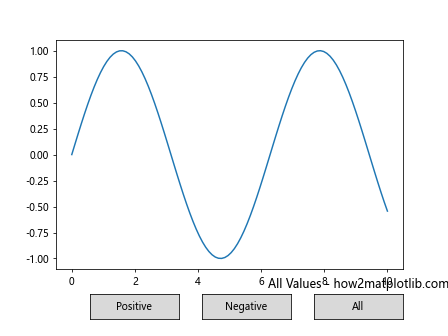
这个例子创建了三个按钮,允许用户选择显示正值、负值或所有值。每次点击按钮时,图表会更新以显示所选的数据子集。
结论
Matplotlib 的 Button Widget 是一个强大的工具,可以大大增强数据可视化的交互性。通过本文的详细介绍和丰富的示例,我们探讨了 Button Widget 的基本用法、高级应用以及与其他 Matplotlib 功能的结合。从简单的图表更新到复杂的动画控制,Button Widget 为创建交互式数据可视化提供了无限可能。
通过掌握 Button Widget 的使用,你可以创建更加动态和用户友好的数据可视化应用。无论是用于数据分析、科学研究还是教育目的,Button Widget 都能帮助你构建更加丰富和有吸引力的可视化界面。
 极客笔记
极客笔记