Matplotlib基础单元
Matplotlib是Python中一个广泛使用的绘图库,它提供了丰富的接口和功能,可以用来绘制各种静态、动态、交互式的图表。在数据分析和数据可视化领域,Matplotlib无疑是一个非常重要的工具。本文将详细介绍Matplotlib的基础单元,并通过10-20个示例代码展示如何使用这些基础单元绘制图形。
1. Matplotlib架构
在深入了解示例代码之前,我们先简要了解一下Matplotlib的架构。Matplotlib的架构主要由三个层次组成:
- Backend layer(后端层):这是Matplotlib的底层,负责与不同的输出设备交互,如屏幕、文件等。
- Artist layer(艺术家层):这一层是Matplotlib的核心,所有的图表都是由这一层中的对象绘制的。它包括基础单元如线条(Line2D)、矩形(Rectangle)、文本(Text)等。
- Scripting layer(脚本层):这是Matplotlib的高级接口,提供了pyplot模块,使得用户可以用简单的命令绘制图表,而不需要关心底层的细节。
2. 基础单元及示例代码
接下来,我们将通过示例代码详细介绍Matplotlib的基础单元的使用方法。每个示例代码都是独立、完整、可直接运行的。
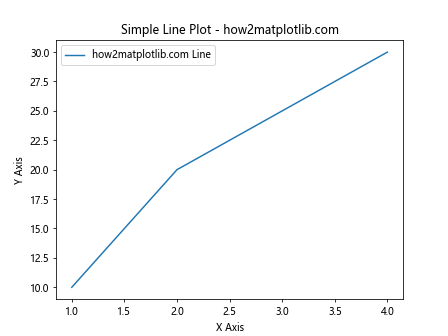
示例1:绘制简单的线图
import matplotlib.pyplot as plt

x = [1, 2, 3, 4]
y = [10, 20, 25, 30]
plt.plot(x, y, label='how2matplotlib.com Line')
plt.xlabel('X Axis')
plt.ylabel('Y Axis')
plt.title('Simple Line Plot - how2matplotlib.com')
plt.legend()
plt.show()
Output:
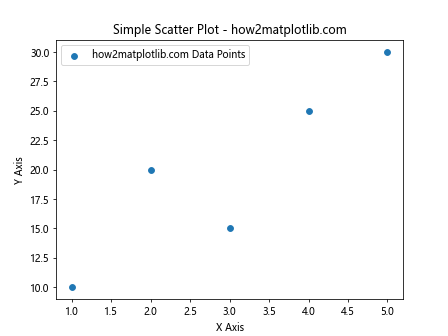
示例2:绘制散点图
import matplotlib.pyplot as plt

x = [1, 2, 3, 4, 5]
y = [10, 20, 15, 25, 30]
plt.scatter(x, y, label='how2matplotlib.com Data Points')
plt.xlabel('X Axis')
plt.ylabel('Y Axis')
plt.title('Simple Scatter Plot - how2matplotlib.com')
plt.legend()
plt.show()
Output:
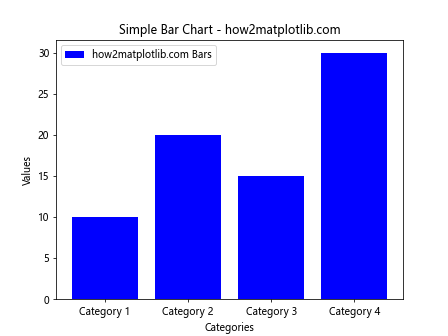
示例3:绘制条形图
import matplotlib.pyplot as plt

categories = ['Category 1', 'Category 2', 'Category 3', 'Category 4']
values = [10, 20, 15, 30]
plt.bar(categories, values, color='blue', label='how2matplotlib.com Bars')
plt.xlabel('Categories')
plt.ylabel('Values')
plt.title('Simple Bar Chart - how2matplotlib.com')
plt.legend()
plt.show()
Output:
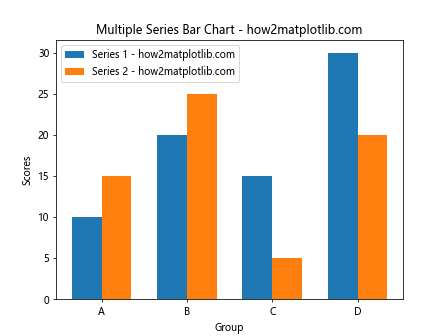
示例4:绘制多系列条形图
import matplotlib.pyplot as plt
import numpy as np

n_groups = 4
index = np.arange(n_groups)
bar_width = 0.35

series1 = [10, 20, 15, 30]
series2 = [15, 25, 5, 20]

plt.bar(index, series1, bar_width, label='Series 1 - how2matplotlib.com')
plt.bar(index + bar_width, series2, bar_width, label='Series 2 - how2matplotlib.com')

plt.xlabel('Group')
plt.ylabel('Scores')
plt.title('Multiple Series Bar Chart - how2matplotlib.com')
plt.xticks(index + bar_width / 2, ('A', 'B', 'C', 'D'))
plt.legend()

plt.show()
Output:
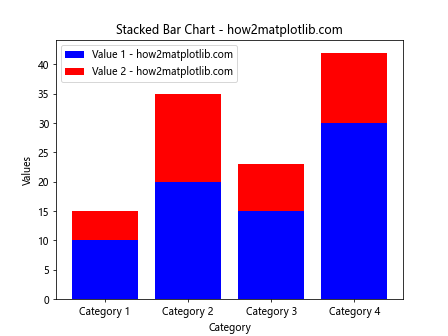
示例5:绘制堆叠条形图
import matplotlib.pyplot as plt
import numpy as np

categories = ['Category 1', 'Category 2', 'Category 3', 'Category 4']
values1 = [10, 20, 15, 30]
values2 = [5, 15, 8, 12]

index = np.arange(len(categories))

plt.bar(index, values1, color='b', label='Value 1 - how2matplotlib.com')
plt.bar(index, values2, color='r', bottom=values1, label='Value 2 - how2matplotlib.com')

plt.xlabel('Category')
plt.ylabel('Values')
plt.title('Stacked Bar Chart - how2matplotlib.com')
plt.xticks(index, categories)
plt.legend()

plt.show()
Output:
示例6:绘制饼图
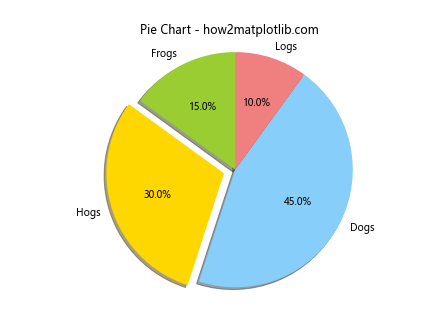
import matplotlib.pyplot as plt

sizes = [15, 30, 45, 10]
labels = ['Frogs', 'Hogs', 'Dogs', 'Logs']
colors = ['yellowgreen', 'gold', 'lightskyblue', 'lightcoral']
explode = (0, 0.1, 0, 0)  # only "explode" the 2nd slice (i.e. 'Hogs')

plt.pie(sizes, explode=explode, labels=labels, colors=colors, autopct='%1.1f%%', shadow=True, startangle=90)
plt.title('Pie Chart - how2matplotlib.com')
plt.axis('equal')  # Equal aspect ratio ensures that pie is drawn as a circle.

plt.show()
Output:
示例7:绘制直方图
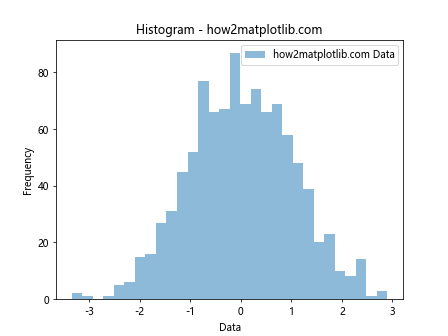
import matplotlib.pyplot as plt
import numpy as np

data = np.random.randn(1000)
plt.hist(data, bins=30, alpha=0.5, label='how2matplotlib.com Data')
plt.xlabel('Data')
plt.ylabel('Frequency')
plt.title('Histogram - how2matplotlib.com')
plt.legend()

plt.show()
Output:
示例8:绘制箱形图
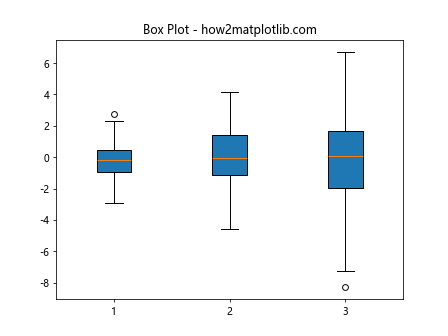
import matplotlib.pyplot as plt
import numpy as np

data = [np.random.normal(0, std, 100) for std in range(1, 4)]
plt.boxplot(data, vert=True, patch_artist=True)  # vertical box alignment
plt.title('Box Plot - how2matplotlib.com')

plt.show()
Output:
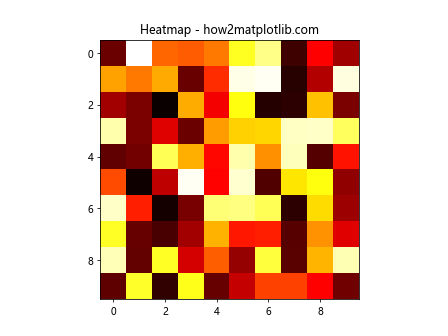
示例9:绘制热力图
import matplotlib.pyplot as plt
import numpy as np

data = np.random.rand(10, 10)
plt.imshow(data, cmap='hot', interpolation='nearest')
plt.title('Heatmap - how2matplotlib.com')

plt.show()
Output:
示例10:绘制等高线图
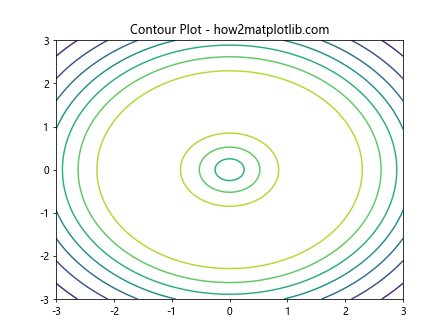
import matplotlib.pyplot as plt
import numpy as np

x = np.linspace(-3, 3, 100)
y = np.linspace(-3, 3, 100)
X, Y = np.meshgrid(x, y)
Z = np.sin(np.sqrt(X**2 + Y**2))

plt.contour(X, Y, Z)
plt.title('Contour Plot - how2matplotlib.com')

plt.show()
Output:
以上示例代码展示了使用Matplotlib绘制不同类型图表的基本方法。通过这些示例,我们可以看到Matplotlib在数据可视化方面的强大功能和灵活性。无论是简单的线图、散点图,还是更复杂的条形图、饼图、直方图等,Matplotlib都能够轻松应对,帮助用户从不同角度分析和理解数据。
 极客笔记
极客笔记