Matplotlib柱状图
Matplotlib是一个强大的绘图库,可以帮助用户创建各种类型的图表,其中包括柱状图。柱状图是一种常用的数据可视化方式,通过柱形的高度来展示不同数据之间的差异。本文将介绍如何使用Matplotlib创建各种类型的柱状图,并提供示例代码供读者参考。
基本柱状图
首先,让我们创建一个简单的柱状图来展示不同城市的人口数量。以下是示例代码:
import matplotlib.pyplot as plt

# 城市名称
cities = ['New York', 'Los Angeles', 'Chicago', 'Houston', 'Phoenix']
# 人口数量
population = [8398748, 3990456, 2705994, 2320268, 1680992]

plt.bar(cities, population)
plt.title('Population of Different Cities')
plt.xlabel('Cities')
plt.ylabel('Population')
plt.show()
Output:
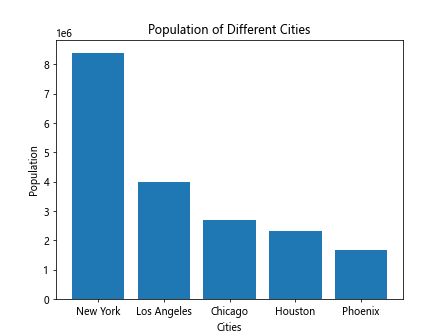
运行以上代码,将会得到一个简单的柱状图,展示了不同城市的人口数量。
水平柱状图
除了垂直柱状图外,Matplotlib还支持水平柱状图。以下是一个展示了不同编程语言流行度的水平柱状图的示例代码:
import matplotlib.pyplot as plt

# 编程语言
languages = ['Python', 'Java', 'C++', 'JavaScript', 'Ruby']
# 流行度得分
popularity = [95, 89, 80, 82, 70]

plt.barh(languages, popularity, color='skyblue')
plt.title('Popularity of Programming Languages')
plt.xlabel('Popularity Score')
plt.ylabel('Languages')
plt.show()
Output:
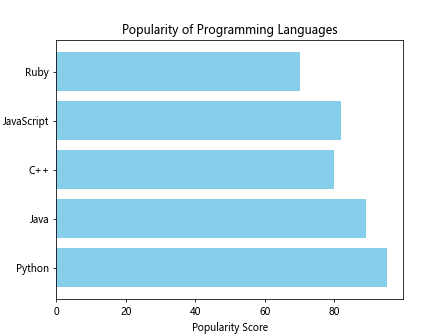
运行以上代码,将会得到一个水平柱状图,展示了不同编程语言的流行度得分。
多色柱状图
在柱状图中使用不同颜色可以更好地突出不同数据之间的差异。以下是一个展示了不同水果销售量的多色柱状图的示例代码:
import matplotlib.pyplot as plt

# 水果名称
fruits = ['Apple', 'Banana', 'Orange', 'Grape', 'Watermelon']
# 销售量
sales = [200, 150, 180, 120, 90]

colors = ['red', 'yellow', 'orange', 'green', 'pink']

plt.bar(fruits, sales, color=colors)
plt.title('Sales of Different Fruits')
plt.xlabel('Fruits')
plt.ylabel('Sales')
plt.show()
Output:
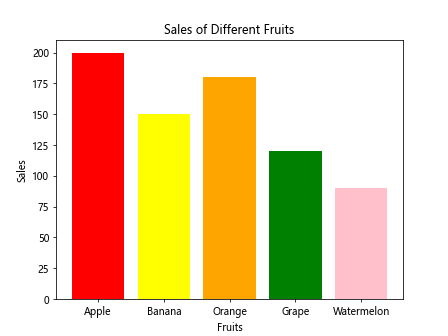
运行以上代码,将会得到一个多色柱状图,展示了不同水果的销售量。
堆叠柱状图
堆叠柱状图可以用来展示不同类别中的数据分布情况。以下是一个展示了男女学生在不同科目中得分情况的堆叠柱状图的示例代码:
import matplotlib.pyplot as plt

# 科目
subjects = ['Math', 'English', 'History', 'Science', 'Art']
# 男学生得分
male_scores = [80, 85, 70, 75, 65]
# 女学生得分
female_scores = [75, 88, 68, 80, 70]

plt.bar(subjects, male_scores, label='Male Scores')
plt.bar(subjects, female_scores, bottom=male_scores, label='Female Scores')

plt.legend()
plt.title('Scores of Male and Female Students in Different Subjects')
plt.xlabel('Subjects')
plt.ylabel('Scores')
plt.show()
Output:
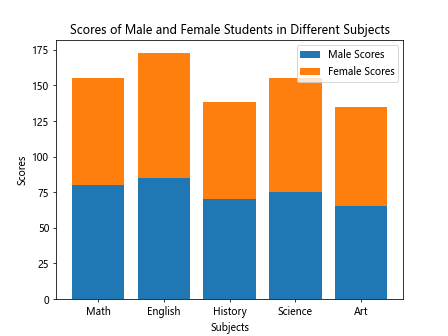
运行以上代码,将会得到一个堆叠柱状图,展示了男女学生在不同科目中的得分情况。
分组柱状图
分组柱状图可以同时展示多组数据之间的差异。以下是一个展示了不同水果销售量的分组柱状图的示例代码:
import matplotlib.pyplot as plt

# 水果名称
fruits = ['Apple', 'Banana', 'Orange', 'Grape', 'Watermelon']
# 2019年销售量
sales_2019 = [200, 150, 180, 120, 90]
# 2020年销售量
sales_2020 = [220, 160, 190, 130, 100]

bar_width = 0.35
index = range(len(fruits))

plt.bar(index, sales_2019, width=bar_width, label='2019')
plt.bar([i + bar_width for i in index], sales_2020, width=bar_width, label='2020')

plt.xticks([i + bar_width/2 for i in index], fruits)
plt.legend()
plt.title('Sales of Different Fruits in 2019 and 2020')
plt.xlabel('Fruits')
plt.ylabel('Sales')
plt.show()
Output:
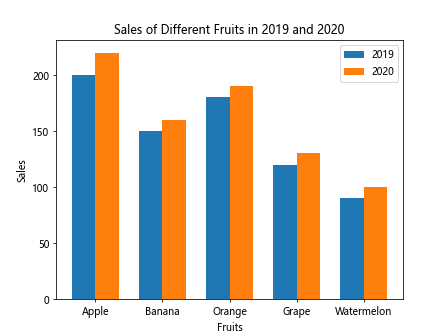
运行以上代码,将会得到一个分组柱状图,展示了不同水果在2019年和2020年的销售量。
柱状图堆叠样式
通过调整堆叠柱状图的样式,可以让图表更加美观和易读。以下是一个展示了不同城市过去5年平均温度变化的柱状图堆叠样式的示例代码:
import matplotlib.pyplot as plt

# 城市名称
cities = ['New York', 'Los Angeles', 'Chicago', 'Houston', 'Phoenix']

# 过去5年平均温度变化
year1 = [55, 72, 50, 65, 80]
year2 = [60, 75, 55, 70, 85]
year3 = [65, 78, 60, 75, 90]
year4 = [70, 80, 65, 80, 95]
year5 = [75, 85, 70, 85, 100]

plt.bar(cities, year1, label='Year 1')
plt.bar(cities, year2, bottom=year1, label='Year 2')
plt.bar(cities, year3, bottom=[year1[i]+year2[i] for i in range(len(year1))], label='Year 3')
plt.bar(cities, year4, bottom=[year1[i]+year2[i]+year3[i] for i in range(len(year1))], label='Year 4')
plt.bar(cities, year5, bottom=[year1[i]+year2[i]+year3[i]+year4[i] for i in range(len(year1))], label='Year 5')

plt.legend()
plt.title('Average Temperature Change in Different Cities over the Past 5 Years')
plt.xlabel('Cities')
plt.ylabel('Average Temperature')
plt.show()
Output:
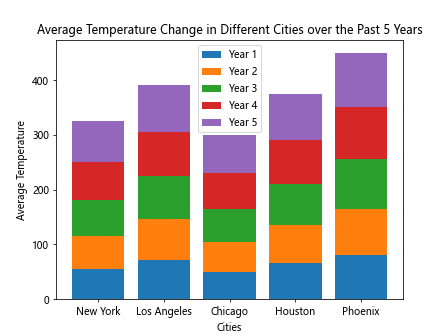
运行以上代码,将会得到一个展示了不同城市过去5年平均温度变化的柱状图堆叠样式。
柱状图标签
在柱状图上添加标签可以帮助读者更容易地理解图表内容。以下是一个展示了不同编程语言流行度的柱状图并添加标签的示例代码:
import matplotlib.pyplot as plt

# 编程语言
languages = ['Python', 'Java', 'C++', 'JavaScript', 'Ruby']
# 流行度得分
popularity = [95, 89, 80, 82, 70]

plt.bar(languages, popularity)
plt.title('Popularity of Programming Languages')
plt.xlabel('Languages')
plt.ylabel('Popularity Score')

for i, score in enumerate(popularity):
    plt.text(i, score + 1, str(score), ha='center')

plt.show()
Output:
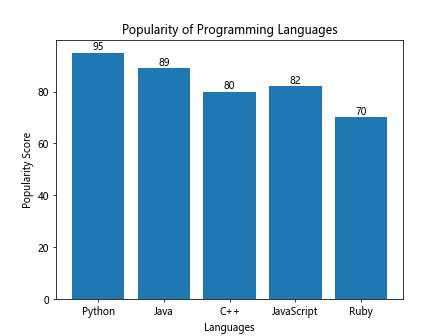
运行以上代码,将会得到一个展示了不同编程语言流行度的柱状图并添加标签的效果。
柱状图风格
Matplotlib提供了丰富的风格选项,可以根据需要调整图表的样式。以下是一个展示了不同水果销售量的柱状图并设置风格为fivethirtyeight的示例代码:
import matplotlib.pyplot as plt

# 水果名称
fruits = ['Apple', 'Banana', 'Orange', 'Grape', 'Watermelon']
# 销售量
sales = [200, 150, 180, 120, 90]

plt.style.use('fivethirtyeight')
plt.bar(fruits, sales)
plt.title('Sales of Different Fruits')
plt.xlabel('Fruits')
plt.ylabel('Sales')
plt.show()
Output:
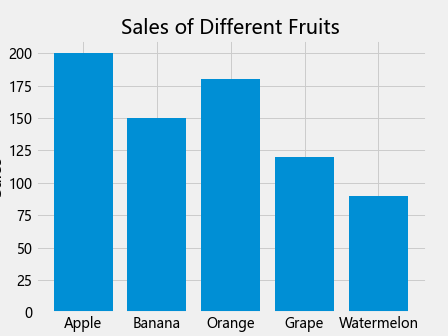
运行以上代码,将会得到一个展示了不同水果销售量的柱状图并设置了风格为fivethirtyeight的效果。
堆叠柱状图标签
在堆叠柱状图中添加标签可以帮助读者更清楚地理解数据分布情况。以下是一个展示了男女学生在不同科目中得分情况的堆叠柱状图并添加标签的示例代码:
import matplotlib.pyplot as plt

# 科目
subjects = ['Math', 'English', 'History', 'Science', 'Art']
# 男学生得分
male_scores = [80, 85, 70, 75, 65]
# 女学生得分
female_scores = [75, 88, 68, 80, 70]

plt.bar(subjects, male_scores, label='Male Scores')
plt.bar(subjects, female_scores, bottom=male_scores, label='Female Scores')

plt.legend()
plt.title('Scores of Male and Female Students in Different Subjects')
plt.xlabel('Subjects')
plt.ylabel('Scores')

for i, male_score in enumerate(male_scores):
    plt.text(i, male_score/2, str(male_score), ha='center', color='white')

for i, female_score in enumerate(female_scores):
    plt.text(i, male_scores[i] + female_score/2, str(female_score), ha='center', color='white')

plt.show()
Output:
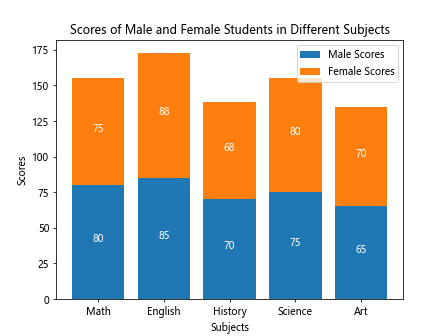
运行以上代码,将会得到一个展示了男女学生在不同科目中得分情况的堆叠柱状图并添加标签的效果。
柱状图颜色映射
颜色映射可以帮助读者更清晰地理解数据,根据数据大小设定不同颜色。以下是一个展示了不同城市2019年温度变化的柱状图并使用颜色映射的示例代码:
import matplotlib.pyplot as plt
import numpy as np

# 城市名称
cities = ['New York', 'Los Angeles', 'Chicago', 'Houston', 'Phoenix']

# 2019年平均温度
temperatures = [55, 72, 50, 65, 80]

colors = plt.cm.viridis(np.array(temperatures)/max(temperatures))

plt.bar(cities, temperatures, color=colors)
plt.title('Average Temperature Change in Different Cities in 2019')
plt.xlabel('Cities')
plt.ylabel('Average Temperature')
plt.show()
Output:
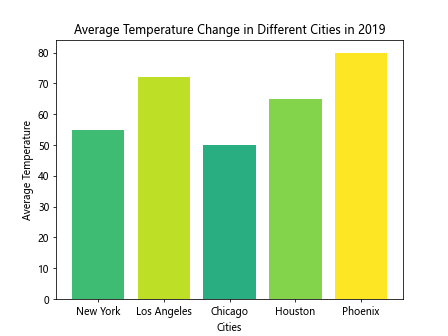
运行以上代码,将会得到一个展示了不同城市2019年温度变化的柱状图并使用颜色映射的效果。
柱状图标题样式
通过调整文字样式和位置,可以让柱状图标题更加突出和美观。以下是一个展示了不同水果销售量的柱状图,并设置了标题样式的示例代码:
import matplotlib.pyplot as plt

# 水果名称
fruits = ['Apple', 'Banana', 'Orange', 'Grape', 'Watermelon']
# 销售量
sales = [200, 150, 180, 120, 90]

plt.bar(fruits, sales)
plt.title('Sales of Different Fruits', fontsize=16, fontweight='bold', color='blue', style='italic')
plt.xlabel('Fruits')
plt.ylabel('Sales')
plt.show()
Output:
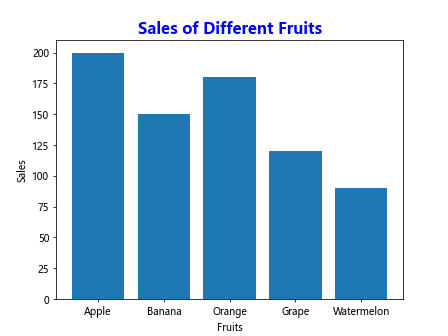
运行以上代码,将会得到一个展示了不同水果销售量的柱状图并设置了标题样式的效果。
柱状图边界调整
通过调整柱状图的边界,可以让图表更加整洁和美观。以下是一个展示了不同城市人口数量的柱状图并设置了边界的示例代码:
import matplotlib.pyplot as plt

# 城市名称
cities = ['New York', 'Los Angeles', 'Chicago', 'Houston', 'Phoenix']
# 人口数量
population = [8398748, 3990456, 2705994, 2320268, 1680992]

plt.bar(cities, population)
plt.title('Population of Different Cities')
plt.xlabel('Cities')
plt.ylabel('Population')

plt.xlim(-0.5, len(cities)-0.5)
plt.ylim(0, max(population)+500000)

plt.show()
Output:
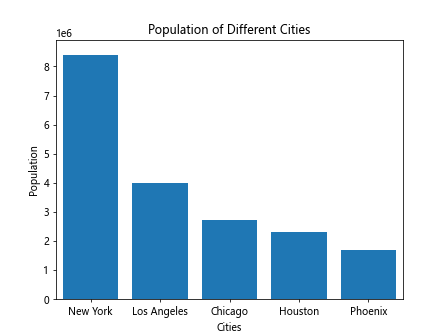
运行以上代码,将会得到一个展示了不同城市人口数量的柱状图并设置了边界的效果。
堆叠柱状图比例调整
调整堆叠柱状图中不同数据层的比例可以更清晰地展示数据分布情况。以下是一个展示了男女学生在不同科目中得分情况的堆叠柱状图并调整比例的示例代码:
import matplotlib.pyplot as plt

# 科目
subjects = ['Math', 'English', 'History', 'Science', 'Art']
# 男学生得分
male_scores = [80, 85, 70, 75, 65]
# 女学生得分
female_scores = [75, 88, 68, 80, 70]

plt.bar(subjects, male_scores, label='Male Scores')
plt.bar(subjects, female_scores, bottom=male_scores, label='Female Scores')

plt.legend()
plt.title('Scores of Male and Female Students in Different Subjects')
plt.xlabel('Subjects')
plt.ylabel('Scores')

plt.gca().set_ylim([0, 200])

plt.show()
Output:
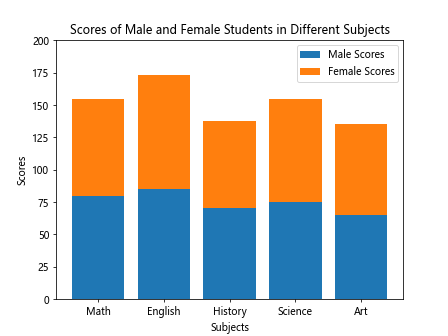
运行以上代码,将会得到一个展示了男女学生在不同科目中得分情况的堆叠柱状图并调整了比例的效果。
柱状图透明度调整
通过调整柱状图的透明度,可以让不同数据层更清晰地展示。以下是一个展示了不同城市2019年和
import matplotlib.pyplot as plt

# 城市名称
cities = ['New York', 'Los Angeles', 'Chicago', 'Houston', 'Phoenix']
# 2019年人口增长量
population_growth = [300000, 200000, 150000, 100000, 80000]

plt.bar(cities, population_growth, alpha=0.6)
plt.title('Population Growth in Different Cities in 2019')
plt.xlabel('Cities')
plt.ylabel('Population Growth')

plt.show()
Output:
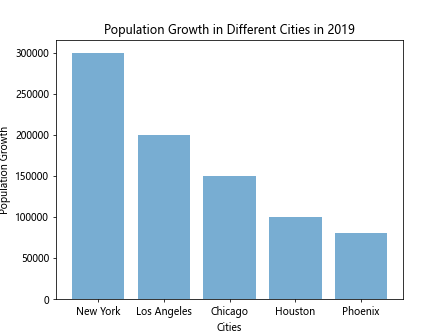
运行以上代码,将会得到一个展示了不同城市2019年人口增长量的柱状图并调整了透明度的效果。
柱状图线条样式调整
通过调整柱状图的线条样式,可以让柱状图显示更加独特的效果。以下是一个展示了不同水果销售量的柱状图并设置了线条样式的示例代码:
import matplotlib.pyplot as plt

# 水果名称
fruits = ['Apple', 'Banana', 'Orange', 'Grape', 'Watermelon']
# 销售量
sales = [200, 150, 180, 120, 90]

plt.bar(fruits, sales, hatch='//', edgecolor='black')
plt.title('Sales of Different Fruits')
plt.xlabel('Fruits')
plt.ylabel('Sales')
plt.show()
Output:
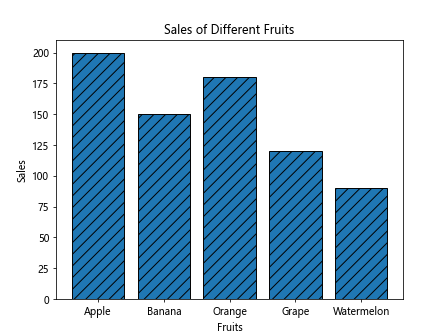
运行以上代码,将会得到一个展示了不同水果销售量的柱状图并设置了线条样式的效果。
 极客笔记
极客笔记