Matplotlib中使用axvline绘制多条垂直线的详细指南
参考:matplotlib axvline multiple lines
Matplotlib是Python中最流行的数据可视化库之一,它提供了丰富的绘图功能。在数据分析和科学研究中,我们经常需要在图表上绘制垂直线来标记重要的时间点或数值。本文将详细介绍如何使用Matplotlib的axvline函数绘制多条垂直线,以及如何自定义这些线的样式和属性。
1. axvline函数简介
axvline函数是Matplotlib中用于在图表上绘制垂直线的重要工具。它属于Axes对象的方法,可以在当前坐标轴上添加一条从底部延伸到顶部的垂直线。
1.1 基本用法
让我们从一个简单的例子开始,展示axvline的基本用法:
import matplotlib.pyplot as plt

fig, ax = plt.subplots()
ax.set_xlim(0, 10)
ax.set_ylim(0, 5)

ax.axvline(x=5, color='r', linestyle='--', label='Vertical line')

ax.set_title('How to use axvline in Matplotlib - how2matplotlib.com')
ax.legend()
plt.show()
Output:
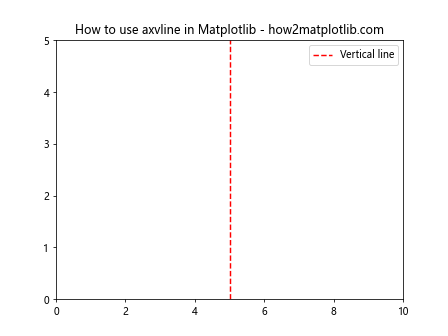
在这个例子中,我们创建了一个简单的图表,并在x=5的位置添加了一条红色虚线。axvline函数的第一个参数x指定了垂直线的x坐标。我们还设置了线的颜色和样式,并添加了一个图例。
1.2 axvline的主要参数
axvline函数有多个参数可以用来自定义垂直线的外观:
- x:指定垂直线的x坐标。
- ymin, ymax:指定线的起点和终点,取值范围为0到1,表示y轴的比例。
- color:设置线的颜色。
- linestyle:设置线的样式,如实线、虚线等。
- linewidth:设置线的宽度。
- alpha:设置线的透明度。
- label:为线添加标签,用于图例。
2. 绘制多条垂直线
在实际应用中,我们可能需要在同一张图表上绘制多条垂直线。这可以通过多次调用axvline函数来实现。
2.1 基本多线绘制
下面是一个绘制多条垂直线的简单例子:
import matplotlib.pyplot as plt

fig, ax = plt.subplots()
ax.set_xlim(0, 10)
ax.set_ylim(0, 5)

ax.axvline(x=2, color='r', linestyle='--', label='Line 1')
ax.axvline(x=4, color='g', linestyle=':', label='Line 2')
ax.axvline(x=6, color='b', linestyle='-.', label='Line 3')

ax.set_title('Multiple vertical lines - how2matplotlib.com')
ax.legend()
plt.show()
Output:
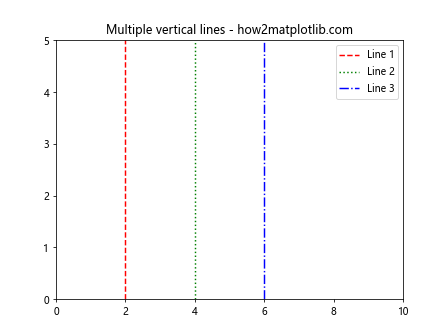
这个例子展示了如何在同一个图表上绘制三条不同颜色和样式的垂直线。每条线都有自己的标签,方便在图例中识别。
2.2 使用循环绘制多条线
当需要绘制大量垂直线时,使用循环可以使代码更简洁:
import matplotlib.pyplot as plt

fig, ax = plt.subplots()
ax.set_xlim(0, 10)
ax.set_ylim(0, 5)

colors = ['r', 'g', 'b', 'c', 'm']
x_positions = [1, 3, 5, 7, 9]

for i, x in enumerate(x_positions):
    ax.axvline(x=x, color=colors[i], linestyle='--', label=f'Line {i+1}')

ax.set_title('Multiple lines using loop - how2matplotlib.com')
ax.legend()
plt.show()
Output:
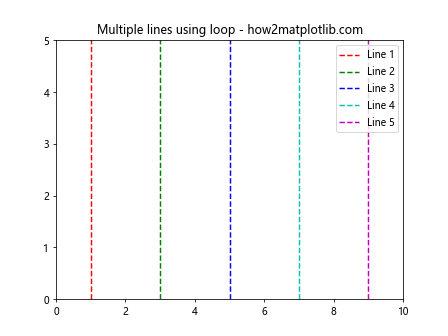
这个例子使用循环绘制了5条垂直线,每条线的位置和颜色都不同。这种方法特别适合需要绘制大量垂直线的情况。
3. 自定义垂直线的样式
Matplotlib提供了丰富的选项来自定义垂直线的外观,让我们来探索一些常用的样式设置。
3.1 设置线的颜色和透明度
我们可以使用不同的方式来指定颜色,包括颜色名称、RGB值或十六进制代码:
import matplotlib.pyplot as plt

fig, ax = plt.subplots()
ax.set_xlim(0, 10)
ax.set_ylim(0, 5)

ax.axvline(x=2, color='red', alpha=0.5, label='Red line')
ax.axvline(x=4, color=(0, 1, 0), label='Green line')
ax.axvline(x=6, color='#0000FF', label='Blue line')

ax.set_title('Custom line colors - how2matplotlib.com')
ax.legend()
plt.show()
Output:
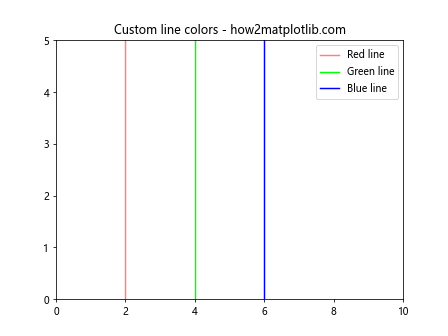
这个例子展示了三种不同的颜色指定方式,并为第一条线设置了透明度。
3.2 自定义线型和线宽
Matplotlib提供了多种线型选择,我们还可以调整线的宽度:
import matplotlib.pyplot as plt

fig, ax = plt.subplots()
ax.set_xlim(0, 10)
ax.set_ylim(0, 5)

ax.axvline(x=2, linestyle='-', linewidth=1, label='Solid')
ax.axvline(x=4, linestyle='--', linewidth=2, label='Dashed')
ax.axvline(x=6, linestyle=':', linewidth=3, label='Dotted')
ax.axvline(x=8, linestyle='-.', linewidth=4, label='Dash-dot')

ax.set_title('Custom line styles and widths - how2matplotlib.com')
ax.legend()
plt.show()
Output:
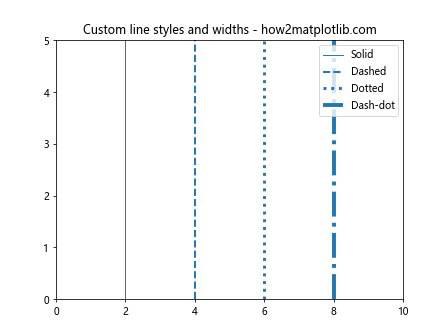
这个例子展示了四种不同的线型和不同的线宽设置。
4. 部分垂直线和跨越多个子图
有时我们可能只需要绘制部分垂直线,或者希望垂直线跨越多个子图。
4.1 绘制部分垂直线
使用ymin和ymax参数,我们可以控制垂直线的起点和终点:
import matplotlib.pyplot as plt

fig, ax = plt.subplots()
ax.set_xlim(0, 10)
ax.set_ylim(0, 5)

ax.axvline(x=3, ymin=0, ymax=0.5, color='r', label='Bottom half')
ax.axvline(x=5, ymin=0.5, ymax=1, color='g', label='Top half')
ax.axvline(x=7, ymin=0.25, ymax=0.75, color='b', label='Middle')

ax.set_title('Partial vertical lines - how2matplotlib.com')
ax.legend()
plt.show()
Output:
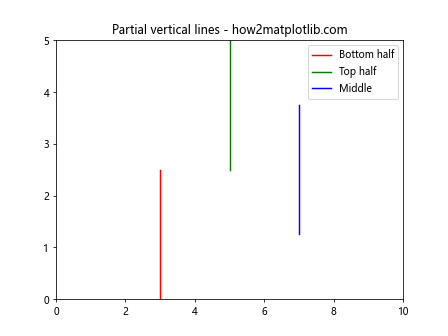
这个例子展示了如何绘制只覆盖图表部分区域的垂直线。
4.2 跨越多个子图的垂直线
当我们有多个子图时,可能希望垂直线能够跨越所有子图:
import matplotlib.pyplot as plt

fig, (ax1, ax2, ax3) = plt.subplots(3, 1, sharex=True, figsize=(8, 10))

for ax in (ax1, ax2, ax3):
    ax.set_xlim(0, 10)
    ax.set_ylim(0, 5)

fig.suptitle('Vertical line across subplots - how2matplotlib.com')

line = fig.add_artist(plt.Line2D([5, 5], [0, 1], transform=fig.transFigure, color='r', linestyle='--'))

plt.show()
Output:
这个例子创建了三个共享x轴的子图,并添加了一条贯穿所有子图的垂直线。
5. 结合其他图表元素
垂直线通常与其他图表元素结合使用,以突出显示重要信息。
5.1 在散点图中添加垂直线
我们可以在散点图中添加垂直线来标记特定的x值:
import matplotlib.pyplot as plt
import numpy as np

fig, ax = plt.subplots()

x = np.linspace(0, 10, 100)
y = np.sin(x)

ax.scatter(x, y, label='Data points')
ax.axvline(x=np.pi, color='r', linestyle='--', label='x = π')

ax.set_title('Scatter plot with vertical line - how2matplotlib.com')
ax.legend()
plt.show()
Output:
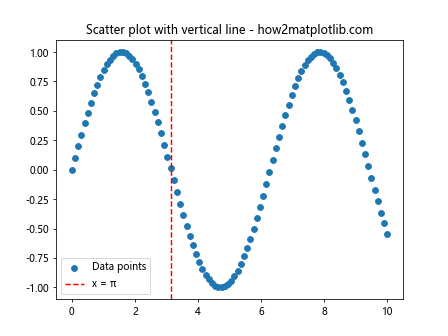
这个例子在正弦函数的散点图中添加了一条垂直线来标记x=π的位置。
5.2 在柱状图中添加垂直线
垂直线也可以用来在柱状图中标记重要阈值:
import matplotlib.pyplot as plt
import numpy as np

fig, ax = plt.subplots()

categories = ['A', 'B', 'C', 'D', 'E']
values = [3, 7, 2, 5, 8]

ax.bar(categories, values)
ax.axvline(x=2, color='r', linestyle='--', label='Threshold')

ax.set_title('Bar chart with vertical line - how2matplotlib.com')
ax.legend()
plt.show()
Output:
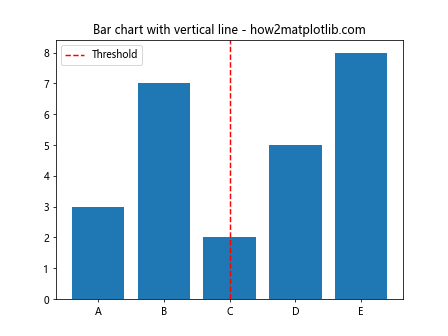
这个例子在柱状图中添加了一条垂直线来表示某个阈值。
6. 动态添加垂直线
在某些情况下,我们可能需要根据用户交互或数据变化动态添加垂直线。
6.1 使用鼠标点击添加垂直线
以下是一个允许用户通过鼠标点击在图表上添加垂直线的交互式示例:
import matplotlib.pyplot as plt

fig, ax = plt.subplots()
ax.set_xlim(0, 10)
ax.set_ylim(0, 5)

lines = []

def on_click(event):
    if event.inaxes == ax:
        line = ax.axvline(x=event.xdata, color='r', linestyle='--')
        lines.append(line)
        plt.draw()

fig.canvas.mpl_connect('button_press_event', on_click)

ax.set_title('Click to add vertical lines - how2matplotlib.com')
plt.show()
Output:
这个例子创建了一个交互式图表,用户每次点击图表时都会添加一条新的垂直线。
6.2 根据数据动态添加垂直线
在数据分析中,我们可能需要根据数据的特定条件动态添加垂直线:
import matplotlib.pyplot as plt
import numpy as np

fig, ax = plt.subplots()

x = np.linspace(0, 10, 100)
y = np.sin(x)

ax.plot(x, y)

threshold = 0.8
for i, value in enumerate(y):
    if value > threshold:
        ax.axvline(x=x[i], color='r', alpha=0.3)

ax.set_title('Dynamic vertical lines based on data - how2matplotlib.com')
plt.show()
Output:
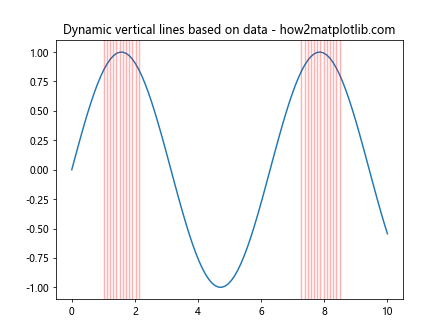
这个例子根据y值是否超过阈值来动态添加垂直线。
7. 高级技巧和注意事项
在使用axvline绘制多条垂直线时,还有一些高级技巧和注意事项需要了解。
7.1 使用集合对象提高效率
当需要绘制大量垂直线时,使用集合对象可以提高绘图效率:
import matplotlib.pyplot as plt
from matplotlib.collections import LineCollection
import numpy as np

fig, ax = plt.subplots()
ax.set_xlim(0, 10)
ax.set_ylim(0, 5)

x_positions = np.random.uniform(0, 10, 100)
lines = [[(x, 0), (x, 5)] for x in x_positions]

line_collection = LineCollection(lines, colors='r', linewidths=0.5, alpha=0.5)
ax.add_collection(line_collection)

ax.set_title('Efficient multiple lines using LineCollection - how2matplotlib.com')
plt.show()
Output:
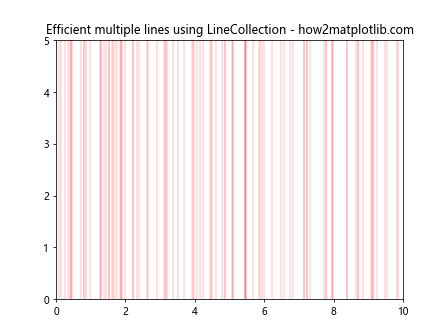
这个例子使用LineCollection对象一次性绘制了100条垂直线,比单独调用axvline 100次更加高效。
7.2 处理日期时间轴
当x轴表示日期时间时,我们需要特别注意如何正确地设置垂直线的位置:
import matplotlib.pyplot as plt
import matplotlib.dates as mdates
from datetime import datetime, timedelta

fig, ax = plt.subplots()

start_date = datetime(2023, 1, 1)
dates = [start_date + timedelta(days=i) for i in range(100)]
values = range(100)

ax.plot(dates, values)

target_date = datetime(2023, 2, 14)
ax.axvline(x=target_date, color='r', linestyle='--', label='Target Date')

ax.xaxis.set_major_formatter(mdates.DateFormatter('%Y-%m-%d'))
plt.xticks(rotation=45)

ax.set_title('Vertical line on datetime axis - how2matplotlib.com')
ax.legend()
plt.tight_layout()
plt.show()
Output:
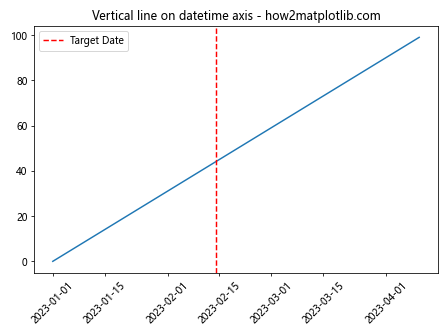
这个例子展示了如何在日期时间轴上正确地添加垂直线。
7.3 处理对数刻度
当使用对数刻度时,垂直线的行为可能会有所不同:
import matplotlib.pyplot as plt
import numpy as np

fig, ax = plt.subplots()

x = np.logspace(0, 2, 100)
y = np.log10(x)

ax.plot(x, y)
ax.set_xscale('log')

ax.axvline(x=10, color='r', linestyle='--', label='x = 10')

ax.set_title('Vertical line on log scale - how2matplotlib.com')
ax.legend()
plt.show()
Output:
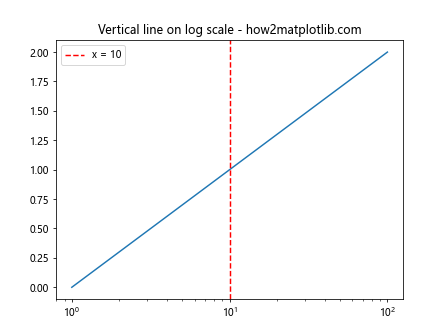
这个例子展示了如何在对数刻度的图表中添加垂直线。需要注意的是,在对数刻度下,垂直线的位置可能看起来与预期不同。
8. 结合其他Matplotlib功能
axvline函数可以与Matplotlib的其他功能结合使用,以创建更复杂和信息丰富的图表。
8.1 添加文本注释
我们可以在垂直线旁添加文本注释来提供额外信息:
import matplotlib.pyplot as plt
import numpy as np

fig, ax = plt.subplots()

x = np.linspace(0, 10, 100)
y = np.sin(x)

ax.plot(x, y)

x_line = 5
ax.axvline(x=x_line, color='r', linestyle='--')
ax.text(x_line, 1, f'x = {x_line}', rotation=90, va='bottom', ha='right')

ax.set_title('Vertical line with text annotation - how2matplotlib.com')
plt.show()
Output:
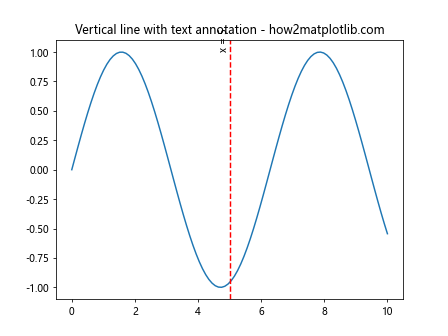
这个例子在垂直线旁添加了一个旋转90度的文本注释。
8.2 使用填充区域
我们可以结合axvline和axvspan来创建填充区域,突出显示某些范围:
import matplotlib.pyplot as plt
import numpy as np

fig, ax = plt.subplots()

x = np.linspace(0, 10, 100)
y = np.sin(x)

ax.plot(x, y)

ax.axvline(x=3, color='r', linestyle='--', label='Start')
ax.axvline(x=7, color='g', linestyle='--', label='End')
ax.axvspan(3, 7, alpha=0.2, color='yellow')

ax.set_title('Vertical lines with filled area - how2matplotlib.com')
ax.legend()
plt.show()
Output:
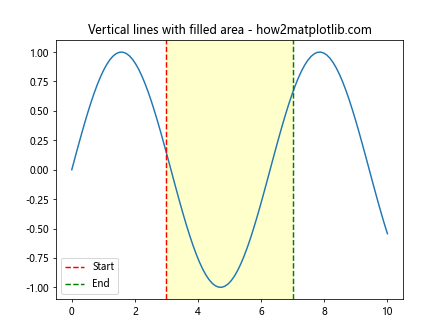
这个例子使用两条垂直线标记了一个区域的开始和结束,并使用axvspan填充了这个区域。
9. 处理多个子图和共享轴
在复杂的图表布局中,我们可能需要在多个子图中添加垂直线,或者处理共享轴的情况。
9.1 在网格布局中添加垂直线
以下是在网格布局的多个子图中添加垂直线的示例:
import matplotlib.pyplot as plt
import numpy as np

fig, axs = plt.subplots(2, 2, figsize=(10, 8))
fig.suptitle('Vertical lines in grid layout - how2matplotlib.com')

x = np.linspace(0, 10, 100)

for ax in axs.flat:
    ax.plot(x, np.sin(x))
    ax.axvline(x=5, color='r', linestyle='--')

plt.tight_layout()
plt.show()
Output:
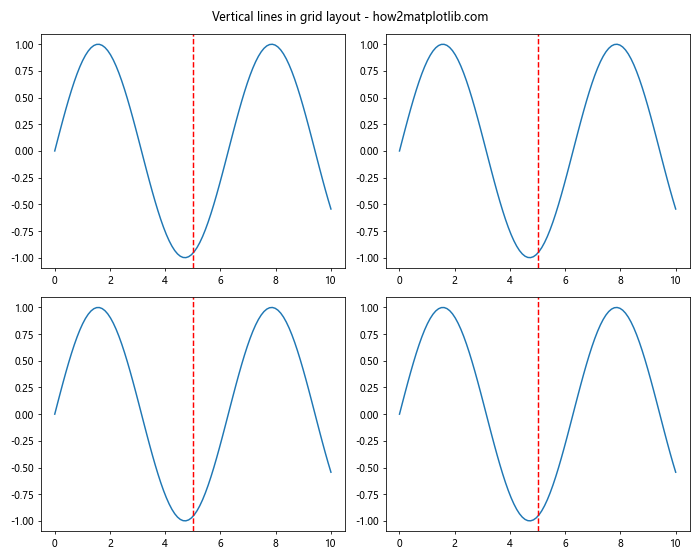
这个例子在2×2的网格布局中的每个子图都添加了一条垂直线。
9.2 处理共享轴的情况
当子图共享轴时,我们需要特别注意垂直线的添加方式:
import matplotlib.pyplot as plt
import numpy as np

fig, (ax1, ax2) = plt.subplots(2, 1, sharex=True, figsize=(8, 6))
fig.suptitle('Vertical line with shared x-axis - how2matplotlib.com')

x = np.linspace(0, 10, 100)

ax1.plot(x, np.sin(x))
ax2.plot(x, np.cos(x))

fig.add_artist(plt.Line2D([5, 5], [0, 1], transform=fig.transFigure, color='r', linestyle='--'))

plt.tight_layout()
plt.show()
Output:
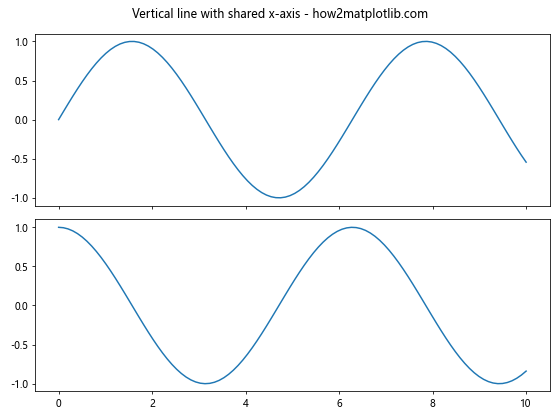
这个例子展示了如何在共享x轴的两个子图中添加一条贯穿的垂直线。
10. 性能优化和大数据集
当处理大数据集或需要绘制大量垂直线时,性能可能会成为一个问题。以下是一些优化建议:
10.1 使用blitting技术
对于需要频繁更新的动画效果,可以使用blitting技术来提高性能:
import matplotlib.pyplot as plt
import numpy as np

fig, ax = plt.subplots()
ax.set_xlim(0, 10)
ax.set_ylim(0, 5)

line, = ax.plot([], [], 'r--')
ax.set_title('Efficient animation using blitting - how2matplotlib.com')

def init():
    return line,

def animate(frame):
    line.set_data([frame, frame], [0, 5])
    return line,

from matplotlib.animation import FuncAnimation
anim = FuncAnimation(fig, animate, init_func=init, frames=np.linspace(0, 10, 100),
                     interval=50, blit=True)

plt.show()
Output:
这个例子使用blitting技术创建了一个高效的动画,展示了一条垂直线从左到右移动的效果。
10.2 使用适当的数据结构
当需要处理大量垂直线时,使用适当的数据结构可以提高效率:
import matplotlib.pyplot as plt
import numpy as np

fig, ax = plt.subplots()
ax.set_xlim(0, 10)
ax.set_ylim(0, 5)

x_positions = np.random.uniform(0, 10, 1000)
colors = np.random.rand(1000, 3)

for x, color in zip(x_positions, colors):
    ax.axvline(x=x, color=color, alpha=0.5, linewidth=0.5)

ax.set_title('Efficient rendering of many lines - how2matplotlib.com')
plt.show()
Output:
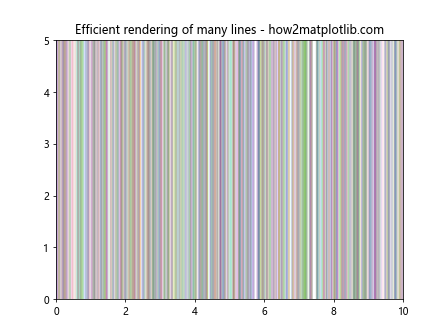
这个例子展示了如何高效地渲染大量垂直线,通过使用NumPy数组来存储位置和颜色信息。
结论
通过本文的详细介绍,我们深入探讨了Matplotlib中使用axvline函数绘制多条垂直线的各种方法和技巧。从基本用法到高级应用,我们涵盖了多个方面,包括自定义样式、动态添加、与其他图表元素结合、处理特殊情况(如日期时间轴和对数刻度)等。
axvline函数是Matplotlib中一个强大而灵活的工具,它不仅可以用来标记重要的x轴位置,还可以用于创建复杂的可视化效果。通过合理使用axvline,我们可以大大提升数据可视化的表现力和信息传递能力。
在实际应用中,根据具体需求选择合适的方法和技巧至关重要。无论是简单的单线标记,还是复杂的多线组合,axvline都能满足各种可视化需求。同时,在处理大数据集或创建动画效果时,注意性能优化也是非常必要的。
希望本文能够帮助读者更好地掌握Matplotlib中axvline的使用,为数据可视化工作提供有力支持。随着不断的实践和探索,相信每个人都能在Matplotlib的海洋中找到属于自己的独特表达方式。
 极客笔记
极客笔记