Matplotlib坐标轴刻度
Matplotlib是一个用于绘制数据可视化图形的Python库,它提供了丰富的功能和选项来自定义图形的外观。在Matplotlib中,坐标轴刻度是图形中的重要组成部分,它们用于标记坐标轴上的数值,并帮助观众更好地理解数据。
设置坐标轴刻度的位置和标签
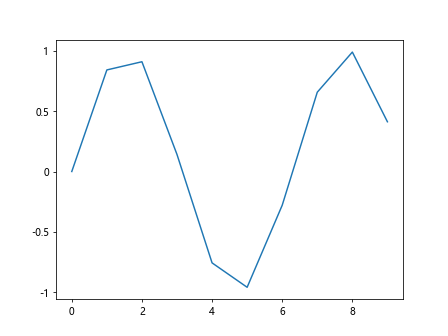
在Matplotlib中,我们可以使用set_xticks和set_yticks方法来设置坐标轴的刻度位置,使用set_xticklabels和set_yticklabels方法来设置刻度标签。
import matplotlib.pyplot as plt
import numpy as np

x = np.arange(0, 10, 1)
y = np.sin(x)

plt.plot(x, y)
plt.xticks(np.arange(0, 10, 2), ['0', '2', '4', '6', '8'])
plt.yticks(np.linspace(-1, 1, 5), ['-1', '-0.5', '0', '0.5', '1'])
plt.show()
Output:
设置坐标轴刻度的样式
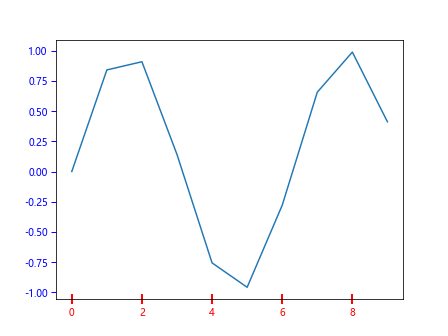
我们可以使用tick_params方法来设置刻度的样式,包括刻度的长度、宽度、颜色等。
import matplotlib.pyplot as plt
import numpy as np

x = np.arange(0, 10, 1)
y = np.sin(x)

plt.plot(x, y)
plt.tick_params(axis='x', direction='inout', length=10, width=2, colors='r')
plt.tick_params(axis='y', direction='out', length=5, width=1, colors='b')
plt.show()
Output:
设置坐标轴刻度的格式
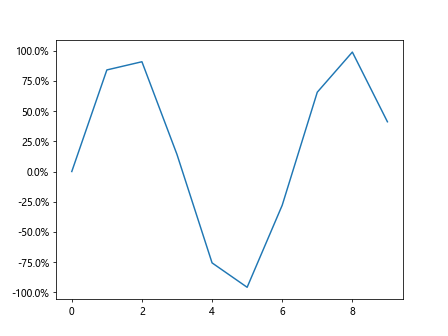
在Matplotlib中,我们可以使用FuncFormatter来自定义刻度的格式,例如将刻度值转换为百分比形式。
import matplotlib.pyplot as plt
import numpy as np
from matplotlib.ticker import FuncFormatter

x = np.arange(0, 10, 1)
y = np.sin(x)

plt.plot(x, y)

def to_percent(y, position):
    return '%1.1f%%' % (100 * y)

formatter = FuncFormatter(to_percent)
plt.gca().yaxis.set_major_formatter(formatter)

plt.show()
Output:
设置对数坐标轴刻度
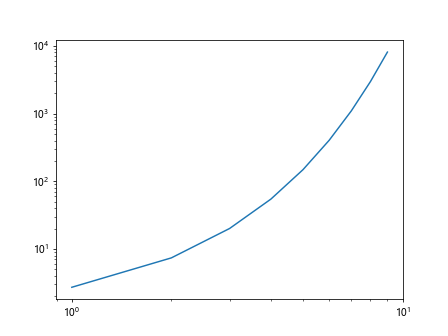
在Matplotlib中,我们可以使用set_xscale和set_yscale方法来设置对数坐标轴的刻度。
import matplotlib.pyplot as plt
import numpy as np

x = np.arange(1, 10, 1)
y = np.exp(x)

plt.plot(x, y)
plt.xscale('log')
plt.yscale('log')
plt.show()
Output:
设置次刻度
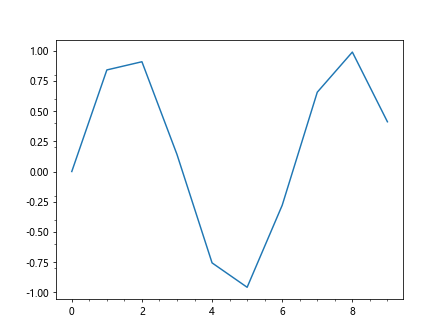
在Matplotlib中,我们可以使用xaxis.set_minor_locator和yaxis.set_minor_locator方法来设置次刻度。
import matplotlib.pyplot as plt
import numpy as np
import matplotlib.ticker as ticker

x = np.arange(0, 10, 1)
y = np.sin(x)

plt.plot(x, y)
plt.gca().xaxis.set_minor_locator(ticker.MultipleLocator(0.5))
plt.gca().yaxis.set_minor_locator(ticker.MultipleLocator(0.2))
plt.show()
Output:
自定义坐标轴刻度
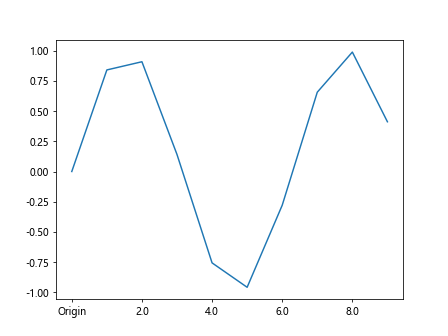
在Matplotlib中,我们可以使用set_major_formatter方法来自定义坐标轴刻度的显示格式。
import matplotlib.pyplot as plt
import numpy as np
import matplotlib.ticker as ticker

x = np.arange(0, 10, 1)
y = np.sin(x)

plt.plot(x, y)

def format_func(value, tick_number):
    if value == 0:
        return 'Origin'
    elif value == 5:
        return 'Half'
    else:
        return value

plt.gca().xaxis.set_major_formatter(ticker.FuncFormatter(format_func))
plt.show()
Output:
隐藏坐标轴刻度
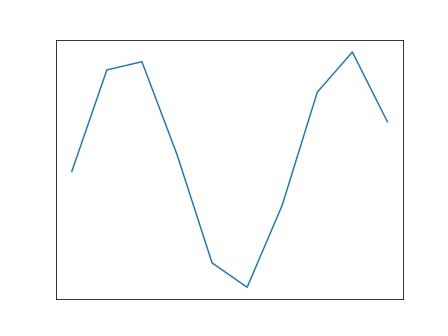
在Matplotlib中,我们可以使用set_xticks和set_yticks方法来隐藏坐标轴的刻度。
import matplotlib.pyplot as plt
import numpy as np

x = np.arange(0, 10, 1)
y = np.sin(x)

plt.plot(x, y)
plt.xticks([])
plt.yticks([])
plt.show()
Output:
设置坐标轴刻度的范围
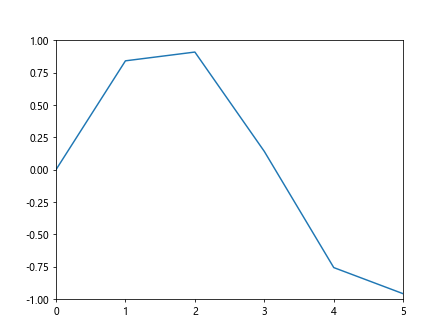
在Matplotlib中,我们可以使用set_xlim和set_ylim方法来设置坐标轴刻度的范围。
import matplotlib.pyplot as plt
import numpy as np

x = np.arange(0, 10, 1)
y = np.sin(x)

plt.plot(x, y)
plt.xlim(0, 5)
plt.ylim(-1, 1)
plt.show()
Output:
设置坐标轴刻度的间隔
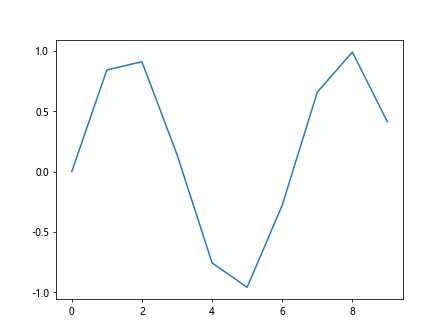
在Matplotlib中,我们可以使用set_xticks和set_yticks方法来设置坐标轴刻度的间隔。
import matplotlib.pyplot as plt
import numpy as np

x = np.arange(0, 10, 1)
y = np.sin(x)

plt.plot(x, y)
plt.xticks(np.arange(0, 10, 2))
plt.yticks(np.linspace(-1, 1, 5))
plt.show()
Output:
总结
在本文中,我们介绍了如何在Matplotlib中设置坐标轴刻度的位置、样式、格式、对数、次刻度、自定义、隐藏、范围和间隔。通过灵活运用这些方法,我们可以更好地控制图形的外观,使得数据可视化更加清晰和美观。
 极客笔记
极客笔记