Matplotlib中的axis.Tick.set_zorder()函数:控制刻度线层级的利器
参考:Matplotlib.axis.Tick.set_zorder() function in Python
Matplotlib是Python中最流行的数据可视化库之一,它提供了丰富的绘图功能和自定义选项。在创建复杂的图表时,控制各个元素的绘制顺序变得尤为重要。本文将深入探讨Matplotlib中的axis.Tick.set_zorder()函数,这是一个强大的工具,用于调整刻度线的绘制层级,从而实现更精确的图表控制。
1. 什么是zorder?
在Matplotlib中,zorder是一个决定绘图元素堆叠顺序的参数。具有较高zorder值的元素会被绘制在具有较低zorder值的元素之上。默认情况下,不同类型的图表元素有不同的zorder值:
- 图表背景:zorder = 0
- 轴线和网格线:zorder = 1
- 刻度线和刻度标签:zorder = 2
- 绘图内容(如线条、散点等):zorder = 2
通过调整zorder,我们可以改变这些元素的绘制顺序,从而实现特定的视觉效果。
2. axis.Tick.set_zorder()函数的基本用法
axis.Tick.set_zorder()函数允许我们单独设置刻度线的zorder值。这个函数属于Tick对象,而Tick对象代表坐标轴上的一个刻度。
基本语法如下:
tick.set_zorder(level)
其中,level是一个整数,表示要设置的zorder值。
让我们看一个简单的例子:
import matplotlib.pyplot as plt

fig, ax = plt.subplots()

# 绘制一条线
ax.plot([0, 1], [0, 1], linewidth=5, color='red', label='Line (how2matplotlib.com)')

# 获取x轴的刻度对象
xticks = ax.get_xticks()

# 设置刻度线的zorder
for tick in ax.xaxis.get_major_ticks():
    tick.set_zorder(10)

ax.set_title('Ticks with Higher zorder (how2matplotlib.com)')
ax.legend()
plt.show()
Output:
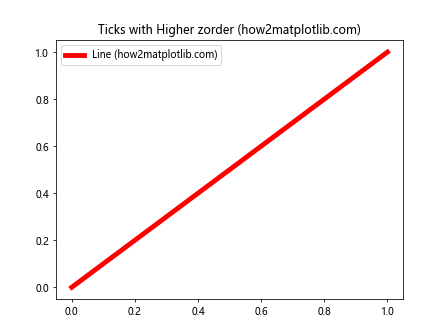
在这个例子中,我们首先绘制了一条红色的线。然后,我们遍历x轴的主刻度,并将它们的zorder设置为10。这样,刻度线就会绘制在红线之上,即使红线的宽度很大也不会遮挡刻度线。
3. 为什么要使用set_zorder()?
使用set_zorder()函数可以帮助我们解决许多常见的图表问题:
- 防止重要元素被遮挡
- 创建层次感
- 突出显示特定元素
- 实现特殊的视觉效果
让我们通过一些具体的例子来看看这些应用。
3.1 防止刻度线被数据遮挡
有时,当我们绘制粗线或大标记时,它们可能会遮挡刻度线。使用set_zorder()可以解决这个问题:
import matplotlib.pyplot as plt
import numpy as np

fig, ax = plt.subplots()

# 生成数据
x = np.linspace(0, 10, 100)
y = np.sin(x)

# 绘制粗线
ax.plot(x, y, linewidth=10, color='blue', label='Thick line (how2matplotlib.com)')

# 设置刻度线的zorder
for axis in [ax.xaxis, ax.yaxis]:
    for tick in axis.get_major_ticks():
        tick.set_zorder(10)

ax.set_title('Ticks Visible Over Thick Line (how2matplotlib.com)')
ax.legend()
plt.show()
Output:
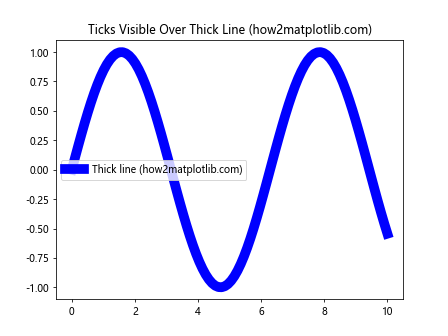
在这个例子中,我们绘制了一条非常粗的蓝色线。如果不设置刻度线的zorder,它们可能会被这条粗线遮挡。通过将刻度线的zorder设置为10,我们确保它们始终显示在线的上方。
3.2 创建层次感
通过巧妙地设置不同元素的zorder,我们可以为图表创建层次感:
import matplotlib.pyplot as plt
import numpy as np

fig, ax = plt.subplots()

# 生成数据
x = np.linspace(0, 10, 100)
y1 = np.sin(x)
y2 = np.cos(x)

# 绘制两条线
ax.plot(x, y1, color='red', label='Sin (how2matplotlib.com)', zorder=2)
ax.plot(x, y2, color='blue', label='Cos (how2matplotlib.com)', zorder=1)

# 设置网格线的zorder
ax.grid(True, zorder=0)

# 设置刻度线的zorder
for axis in [ax.xaxis, ax.yaxis]:
    for tick in axis.get_major_ticks():
        tick.set_zorder(3)

ax.set_title('Creating Depth with zorder (how2matplotlib.com)')
ax.legend()
plt.show()
Output:
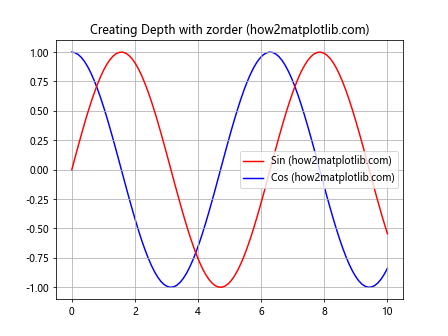
在这个例子中,我们创建了三个层次:网格线在最底层(zorder=0),蓝线在中间(zorder=1),红线在上面(zorder=2),而刻度线在最上层(zorder=3)。这种层次安排使图表更加清晰和有组织。
3.3 突出显示特定刻度
有时,我们可能想要突出显示某些特定的刻度。set_zorder()函数可以帮助我们实现这一点:
import matplotlib.pyplot as plt
import numpy as np

fig, ax = plt.subplots()

# 生成数据
x = np.linspace(0, 10, 100)
y = np.sin(x)

# 绘制线
ax.plot(x, y, color='green', label='Sin curve (how2matplotlib.com)')

# 设置背景色
ax.set_facecolor('#f0f0f0')

# 突出显示特定刻度
for tick in ax.xaxis.get_major_ticks():
    if tick.get_loc() in [0, 5, 10]:
        tick.set_zorder(10)
        tick.label.set_fontweight('bold')
    else:
        tick.set_zorder(5)

ax.set_title('Highlighting Specific Ticks (how2matplotlib.com)')
ax.legend()
plt.show()
在这个例子中,我们将x轴上的0、5和10这三个刻度的zorder设置为10,并将它们的标签设置为粗体。其他刻度的zorder设置为5。这样,突出显示的刻度会更加明显。
4. set_zorder()与其他属性的结合使用
set_zorder()函数通常与其他属性和方法结合使用,以实现更复杂的效果。
4.1 结合tick参数
我们可以结合使用set_zorder()和其他tick参数来创建自定义刻度:
import matplotlib.pyplot as plt
import numpy as np

fig, ax = plt.subplots()

# 生成数据
x = np.linspace(0, 10, 100)
y = np.sin(x)

# 绘制线
ax.plot(x, y, color='purple', label='Sin curve (how2matplotlib.com)')

# 自定义刻度
for tick in ax.xaxis.get_major_ticks():
    tick.set_zorder(10)
    tick.set_tick_params(length=10, width=2, color='red')

ax.set_title('Custom Ticks with set_zorder (how2matplotlib.com)')
ax.legend()
plt.show()
在这个例子中,我们不仅设置了刻度的zorder,还自定义了刻度的长度、宽度和颜色。这样,我们创建了非常显眼的自定义刻度。
4.2 与axhline和axvline结合
set_zorder()也可以与axhline和axvline结合使用,创建特殊的参考线:
import matplotlib.pyplot as plt
import numpy as np

fig, ax = plt.subplots()

# 生成数据
x = np.linspace(0, 10, 100)
y = np.sin(x)

# 绘制线
ax.plot(x, y, color='green', label='Sin curve (how2matplotlib.com)')

# 添加水平和垂直参考线
ax.axhline(y=0, color='red', linestyle='--', zorder=1, label='y=0 (how2matplotlib.com)')
ax.axvline(x=5, color='blue', linestyle=':', zorder=1, label='x=5 (how2matplotlib.com)')

# 设置刻度的zorder
for axis in [ax.xaxis, ax.yaxis]:
    for tick in axis.get_major_ticks():
        tick.set_zorder(2)

ax.set_title('Combining set_zorder with axhline and axvline (how2matplotlib.com)')
ax.legend()
plt.show()
Output:
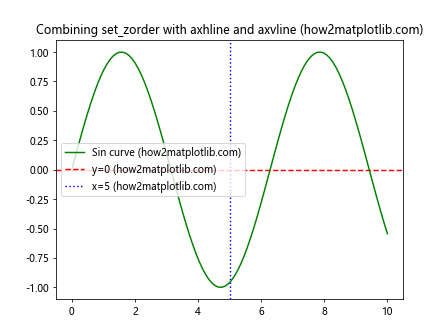
在这个例子中,我们添加了一条水平线和一条垂直线作为参考线,并将它们的zorder设置为1。然后,我们将所有刻度的zorder设置为2,确保刻度始终显示在参考线之上。
5. 处理重叠刻度的问题
在某些情况下,刻度可能会重叠,特别是在处理日期时间数据时。set_zorder()可以帮助我们解决这个问题:
import matplotlib.pyplot as plt
import numpy as np
import pandas as pd

# 创建示例数据
dates = pd.date_range(start='2023-01-01', end='2023-12-31', freq='D')
values = np.cumsum(np.random.randn(len(dates)))

fig, ax = plt.subplots(figsize=(12, 6))

# 绘制数据
ax.plot(dates, values, label='Time series (how2matplotlib.com)')

# 设置x轴刻度
ax.xaxis.set_major_locator(plt.MonthLocator())
ax.xaxis.set_major_formatter(plt.DateFormatter('%b'))

# 旋转刻度标签
plt.setp(ax.xaxis.get_majorticklabels(), rotation=45, ha='right')

# 设置刻度的zorder
for tick in ax.xaxis.get_major_ticks():
    tick.set_zorder(10)

ax.set_title('Handling Overlapping Ticks with set_zorder (how2matplotlib.com)')
ax.legend()
plt.tight_layout()
plt.show()
在这个例子中,我们创建了一个时间序列图。为了避免x轴刻度标签重叠,我们旋转了标签并将刻度的zorder设置为10。这确保了刻度和标签始终显示在数据线之上。
6. 在3D图中使用set_zorder()
虽然set_zorder()主要用于2D图,但它在3D图中也有一些应用:
import matplotlib.pyplot as plt
import numpy as np

fig = plt.figure()
ax = fig.add_subplot(111, projection='3d')

# 生成数据
x = np.linspace(-5, 5, 100)
y = np.linspace(-5, 5, 100)
X, Y = np.meshgrid(x, y)
Z = np.sin(np.sqrt(X**2 + Y**2))

# 绘制3D表面
surf = ax.plot_surface(X, Y, Z, cmap='viridis', label='Surface (how2matplotlib.com)')

# 设置刻度的zorder
for axis in [ax.xaxis, ax.yaxis, ax.zaxis]:
    for tick in axis.get_major_ticks():
        tick.set_zorder(10)

ax.set_title('Using set_zorder in 3D Plots (how2matplotlib.com)')
plt.show()
Output:
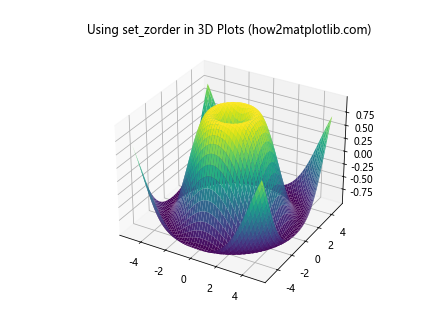
在3D图中,set_zorder()的效果可能不如2D图中明显,但它仍然可以帮助确保刻度线和标签清晰可见。
7. set_zorder()的性能考虑
虽然set_zorder()是一个强大的工具,但过度使用它可能会影响绘图性能,特别是在处理大量数据或复杂图表时。以下是一些使用set_zorder()时的性能考虑:
- 尽量批量设置zorder,而不是单独设置每个元素。
- 如果只需要调整少数元素的顺序,考虑使用
set_axisbelow()或set_axis_on_top()等方法。 - 在绘制大量数据点时,考虑使用
scatter的zorder参数,而不是单独设置每个点的zorder。
让我们看一个优化示例:
import matplotlib.pyplot as plt
import numpy as np

fig, (ax1, ax2) = plt.subplots(1, 2, figsize=(12, 5))

# 生成数据
x = np.linspace(0, 10, 1000)
y = np.sin(x)

# 未优化的方法
ax1.plot(x, y, label='Sin curve (how2matplotlib.com)')
for tick in ax1.xaxis.get_major_ticks() + ax1.yaxis.get_major_ticks():
    tick.set_zorder(10)
ax1.set_title('Unoptimized (how2matplotlib.com)')

# 优化的方法
ax2.plot(x, y, label='Sin curve (how2matplotlib.com)')
ax2.tick_params(zorder=10)
ax2.set_title('Optimized (how2matplotlib.com)')

for ax in [ax1, ax2]:
    ax.legend()plt.tight_layout()
plt.show()
在这个例子中,我们比较了两种设置刻度zorder的方法。左图使用循环单独设置每个刻度的zorder,而右图使用tick_params方法一次性设置所有刻度的zorder。对于大型图表,优化后的方法可能会有更好的性能。
8. set_zorder()的常见陷阱和解决方案
使用set_zorder()时,有一些常见的陷阱需要注意:
8.1 zorder值冲突
当多个元素具有相同的zorder值时,它们的绘制顺序可能不确定。解决方法是确保关键元素具有唯一的zorder值:
import matplotlib.pyplot as plt
import numpy as np

fig, ax = plt.subplots()

# 生成数据
x = np.linspace(0, 10, 100)
y1 = np.sin(x)
y2 = np.cos(x)

# 绘制线条和点
ax.plot(x, y1, color='red', label='Sin (how2matplotlib.com)', zorder=2)
ax.plot(x, y2, color='blue', label='Cos (how2matplotlib.com)', zorder=2)
ax.scatter(x[::10], y1[::10], color='green', label='Sin points (how2matplotlib.com)', zorder=3)
ax.scatter(x[::10], y2[::10], color='purple', label='Cos points (how2matplotlib.com)', zorder=3)

# 设置刻度的zorder
for axis in [ax.xaxis, ax.yaxis]:
    for tick in axis.get_major_ticks():
        tick.set_zorder(4)

ax.set_title('Avoiding zorder Conflicts (how2matplotlib.com)')
ax.legend()
plt.show()
Output:
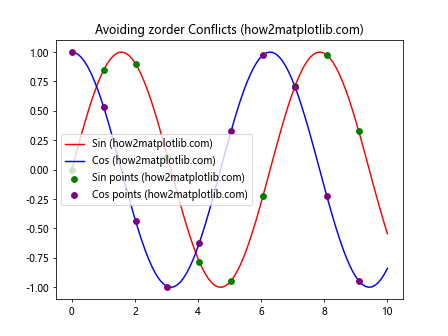
在这个例子中,我们确保了每种类型的元素都有不同的zorder值,避免了潜在的冲突。
8.2 忽略了某些元素的zorder
有时,我们可能会忽略设置某些元素的zorder,导致它们被其他元素遮挡。解决方法是系统地检查和设置所有重要元素的zorder:
import matplotlib.pyplot as plt
import numpy as np

fig, ax = plt.subplots()

# 生成数据
x = np.linspace(0, 10, 100)
y = np.sin(x)

# 绘制主曲线
ax.plot(x, y, color='blue', label='Sin curve (how2matplotlib.com)', zorder=2)

# 添加网格线
ax.grid(True, zorder=1)

# 添加文本注释
ax.text(5, 0.5, 'Important note (how2matplotlib.com)', fontsize=12, zorder=3)

# 设置刻度的zorder
for axis in [ax.xaxis, ax.yaxis]:
    for tick in axis.get_major_ticks():
        tick.set_zorder(4)

ax.set_title('Setting zorder for All Important Elements (how2matplotlib.com)')
ax.legend()
plt.show()
Output:
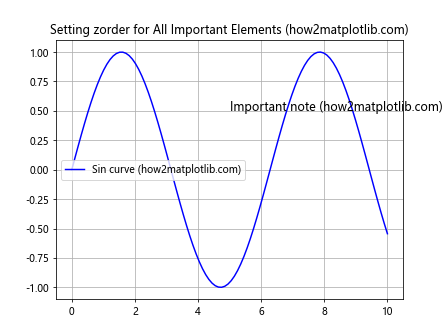
在这个例子中,我们确保了所有重要元素(主曲线、网格线、文本注释和刻度)都有适当的zorder值。
9. set_zorder()在动画中的应用
set_zorder()在创建动画时也非常有用,特别是当我们需要动态改变元素的绘制顺序时:
import matplotlib.pyplot as plt
import matplotlib.animation as animation
import numpy as np

fig, ax = plt.subplots()

# 生成数据
x = np.linspace(0, 2*np.pi, 100)
y = np.sin(x)

# 创建线条对象
line, = ax.plot(x, y, label='Sin curve (how2matplotlib.com)')

# 创建散点对象
scatter = ax.scatter([], [], color='red', label='Moving point (how2matplotlib.com)')

# 设置刻度的zorder
for axis in [ax.xaxis, ax.yaxis]:
    for tick in axis.get_major_ticks():
        tick.set_zorder(10)

ax.set_xlim(0, 2*np.pi)
ax.set_ylim(-1.5, 1.5)

def animate(frame):
    # 更新散点位置
    scatter.set_offsets((x[frame], y[frame]))

    # 动态改变zorder
    if frame < 50:
        scatter.set_zorder(1)
        line.set_zorder(2)
    else:
        scatter.set_zorder(3)
        line.set_zorder(2)

    return scatter, line

ax.set_title('Dynamic zorder in Animation (how2matplotlib.com)')
ax.legend()

anim = animation.FuncAnimation(fig, animate, frames=len(x), interval=50, blit=True)
plt.show()
Output:
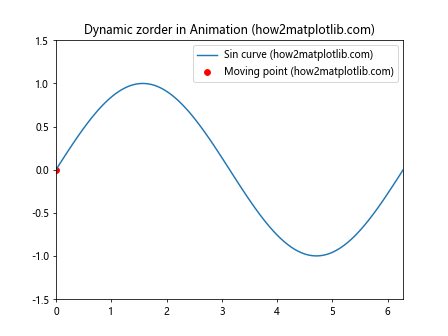
在这个动画中,我们创建了一个移动的点,它在前半部分动画中位于曲线下方,在后半部分动画中位于曲线上方。这是通过动态改变散点和线条的zorder实现的。
10. 高级技巧:结合clip_on和set_zorder()
set_zorder()可以与clip_on属性结合使用,创建一些有趣的视觉效果:
import matplotlib.pyplot as plt
import numpy as np

fig, ax = plt.subplots()

# 生成数据
x = np.linspace(0, 10, 100)
y = np.sin(x)

# 绘制主曲线
ax.plot(x, y, color='blue', label='Sin curve (how2matplotlib.com)', zorder=2)

# 添加一个矩形
rect = plt.Rectangle((4, -0.5), 2, 1, facecolor='yellow', edgecolor='red', zorder=1)
ax.add_patch(rect)

# 添加一个不受裁剪的圆
circle = plt.Circle((5, 0), 0.3, facecolor='green', edgecolor='black', zorder=3, clip_on=False)
ax.add_patch(circle)

# 设置刻度的zorder
for axis in [ax.xaxis, ax.yaxis]:
    for tick in axis.get_major_ticks():
        tick.set_zorder(4)

ax.set_title('Combining clip_on and set_zorder (how2matplotlib.com)')
ax.legend()
plt.show()
Output:
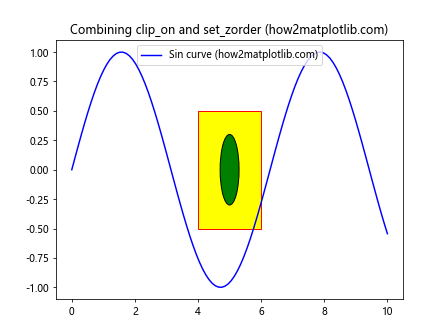
在这个例子中,我们添加了一个矩形和一个圆。矩形的zorder低于曲线,所以它被曲线遮挡。圆的zorder高于曲线,并且clip_on设置为False,所以它不仅显示在曲线之上,还可以超出图表的边界。
结论
axis.Tick.set_zorder()函数是Matplotlib中一个强大而灵活的工具,它允许我们精确控制图表元素的绘制顺序。通过巧妙地使用这个函数,我们可以创建层次分明、视觉吸引力强的图表,解决元素重叠的问题,并实现各种复杂的视觉效果。
然而,使用set_zorder()时也需要注意一些潜在的陷阱,如zorder值冲突和性能问题。通过遵循本文提供的最佳实践和优化技巧,你可以充分利用这个函数的潜力,同时避免常见的问题。
无论你是在创建静态图表、动画还是交互式可视化,掌握set_zorder()都将极大地提升你的Matplotlib使用技能,使你能够创建更专业、更有表现力的数据可视化作品。
 极客笔记
极客笔记