Matplotlib中的axis.Tick.set_animated()函数:提升动画效率的关键
参考:Matplotlib.axis.Tick.set_animated() function in Python
Matplotlib是Python中最流行的数据可视化库之一,它提供了丰富的绘图功能和灵活的定制选项。在创建动态图表和动画时,性能优化变得尤为重要。本文将深入探讨Matplotlib中的axis.Tick.set_animated()函数,这是一个用于提升动画效率的关键工具。我们将详细介绍其用法、原理和应用场景,并通过多个示例来展示如何有效地利用这个函数来创建流畅的动画效果。
1. axis.Tick.set_animated()函数简介
axis.Tick.set_animated()是Matplotlib库中Tick对象的一个方法。它用于设置刻度线(tick)是否处于动画模式。当一个对象被设置为动画模式时,Matplotlib会对其进行特殊处理,以提高动画的性能。
1.1 基本语法
import matplotlib.pyplot as plt

fig, ax = plt.subplots()
for tick in ax.xaxis.get_major_ticks():
    tick.set_animated(True)

plt.title("how2matplotlib.com")
plt.show()
Output:
在这个基本示例中,我们遍历x轴的主刻度线,并将每个刻度线设置为动画模式。这样做可以提高后续动画中刻度线更新的效率。
1.2 函数参数
set_animated()函数接受一个布尔值参数:
True:将刻度线设置为动画模式False:将刻度线设置为非动画模式(默认值)
2. 动画模式的工作原理
当一个对象被设置为动画模式时,Matplotlib会改变其渲染方式。在正常模式下,每次重绘图表时,所有元素都会被重新绘制。而在动画模式下,Matplotlib会采用更高效的方法来更新这些元素。
2.1 背景和前景分离
动画模式的核心原理是将图表分为背景和前景两部分。背景包括静态元素,而前景包括需要频繁更新的动画元素。这种分离允许Matplotlib只更新必要的部分,从而提高性能。
2.2 局部更新
对于设置为动画模式的对象,Matplotlib只会更新其发生变化的部分,而不是重新绘制整个对象。这大大减少了每帧需要处理的数据量。
3. 使用axis.Tick.set_animated()的场景
3.1 动态刻度标签
当创建具有动态变化刻度标签的图表时,set_animated()特别有用。
import matplotlib.pyplot as plt
import numpy as np

fig, ax = plt.subplots()
x = np.linspace(0, 10, 100)
line, = ax.plot(x, np.sin(x))

for tick in ax.xaxis.get_major_ticks() + ax.yaxis.get_major_ticks():
    tick.set_animated(True)

def update(frame):
    line.set_ydata(np.sin(x + frame / 10))
    ax.set_title(f"Frame {frame} - how2matplotlib.com")
    return line,

from matplotlib.animation import FuncAnimation
anim = FuncAnimation(fig, update, frames=200, interval=50, blit=True)
plt.show()
Output:
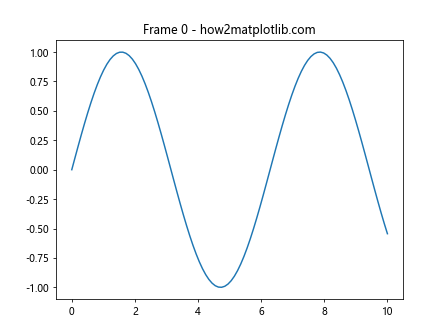
在这个例子中,我们创建了一个正弦波动画,并将x轴和y轴的刻度线都设置为动画模式。这样可以提高刻度线更新的效率,特别是当刻度值随动画变化时。
3.2 实时数据可视化
对于实时数据流的可视化,使用set_animated()可以显著提升性能。
import matplotlib.pyplot as plt
import numpy as np

fig, ax = plt.subplots()
x = np.arange(0, 100)
y = np.random.randn(100)
line, = ax.plot(x, y)

for tick in ax.xaxis.get_major_ticks() + ax.yaxis.get_major_ticks():
    tick.set_animated(True)

def update(frame):
    y = np.roll(y, -1)
    y[-1] = np.random.randn()
    line.set_ydata(y)
    ax.set_title(f"Real-time Data - Frame {frame} - how2matplotlib.com")
    return line,

from matplotlib.animation import FuncAnimation
anim = FuncAnimation(fig, update, frames=200, interval=50, blit=True)
plt.show()
这个例子模拟了实时数据流的可视化。通过将刻度线设置为动画模式,我们可以更高效地更新图表,即使在高频率的数据更新中也能保持流畅。
4. set_animated()与其他动画技巧的结合
4.1 与blitting结合
Blitting是另一种提高动画性能的技术。它与set_animated()配合使用效果更佳。
import matplotlib.pyplot as plt
import numpy as np

fig, ax = plt.subplots()
x = np.linspace(0, 2*np.pi, 100)
line, = ax.plot(x, np.sin(x))

for tick in ax.xaxis.get_major_ticks() + ax.yaxis.get_major_ticks():
    tick.set_animated(True)

line.set_animated(True)

def update(frame):
    line.set_ydata(np.sin(x + frame/10))
    ax.set_title(f"Blitting Example - Frame {frame} - how2matplotlib.com")
    return line,

from matplotlib.animation import FuncAnimation
anim = FuncAnimation(fig, update, frames=200, interval=50, blit=True)
plt.show()
Output:
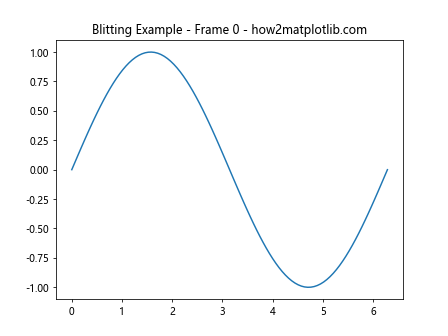
在这个例子中,我们不仅将刻度线设置为动画模式,还将线条本身设置为动画模式。同时,我们在FuncAnimation中启用了blitting。这种组合可以最大限度地提高动画性能。
4.2 动态坐标轴范围
当需要动态调整坐标轴范围时,set_animated()也能发挥作用。
import matplotlib.pyplot as plt
import numpy as np

fig, ax = plt.subplots()
x = np.linspace(0, 10, 100)
line, = ax.plot(x, np.sin(x))

for tick in ax.xaxis.get_major_ticks() + ax.yaxis.get_major_ticks():
    tick.set_animated(True)

ax.set_animated(True)

def update(frame):
    y = np.sin(x + frame/10)
    line.set_ydata(y)
    ax.set_ylim(y.min() - 0.1, y.max() + 0.1)
    ax.set_title(f"Dynamic Axis Range - Frame {frame} - how2matplotlib.com")
    return line, ax

from matplotlib.animation import FuncAnimation
anim = FuncAnimation(fig, update, frames=200, interval=50, blit=True)
plt.show()
Output:

这个例子展示了如何在动画中动态调整y轴的范围。通过将整个坐标轴设置为动画模式,我们可以高效地更新坐标轴范围。
5. 性能优化技巧
5.1 选择性使用set_animated()
虽然set_animated()可以提高性能,但不应过度使用。只对需要频繁更新的元素使用此方法。
import matplotlib.pyplot as plt
import numpy as np

fig, ax = plt.subplots()
x = np.linspace(0, 10, 100)
line, = ax.plot(x, np.sin(x))
static_line, = ax.plot(x, np.cos(x), color='red')

line.set_animated(True)
for tick in ax.xaxis.get_major_ticks():
    tick.set_animated(True)

def update(frame):
    line.set_ydata(np.sin(x + frame/10))
    ax.set_title(f"Selective Animation - Frame {frame} - how2matplotlib.com")
    return line,

from matplotlib.animation import FuncAnimation
anim = FuncAnimation(fig, update, frames=200, interval=50, blit=True)
plt.show()
Output:
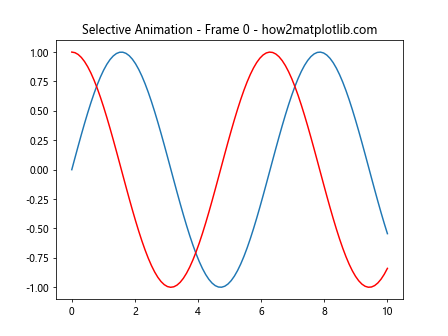
在这个例子中,我们只将动态变化的正弦曲线和x轴刻度设置为动画模式,而静态的余弦曲线保持不变。
5.2 使用artist.set_animated()而不是Figure.set_animated()
对于大型图表,使用artist.set_animated()比Figure.set_animated()更高效。
import matplotlib.pyplot as plt
import numpy as np

fig, (ax1, ax2) = plt.subplots(2, 1)
x = np.linspace(0, 10, 100)
line1, = ax1.plot(x, np.sin(x))
line2, = ax2.plot(x, np.cos(x))

line1.set_animated(True)
line2.set_animated(True)

def update(frame):
    line1.set_ydata(np.sin(x + frame/10))
    line2.set_ydata(np.cos(x + frame/10))
    ax1.set_title(f"Sin Wave - Frame {frame} - how2matplotlib.com")
    ax2.set_title(f"Cos Wave - Frame {frame} - how2matplotlib.com")
    return line1, line2

from matplotlib.animation import FuncAnimation
anim = FuncAnimation(fig, update, frames=200, interval=50, blit=True)
plt.show()
Output:
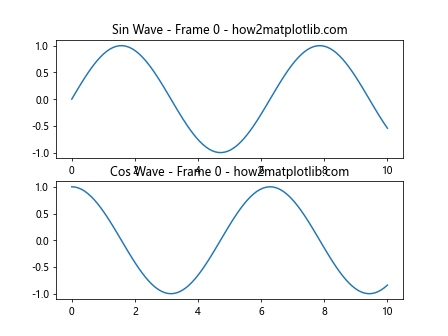
在这个例子中,我们单独设置每个线条为动画模式,而不是设置整个图表。这种方法在处理复杂图表时特别有效。
6. 常见问题和解决方案
6.1 动画模式与静态元素的冲突
有时,将某些元素设置为动画模式可能导致静态元素不正确显示。
import matplotlib.pyplot as plt
import numpy as np

fig, ax = plt.subplots()
x = np.linspace(0, 10, 100)
line, = ax.plot(x, np.sin(x))
ax.set_title("Static Title - how2matplotlib.com")

line.set_animated(True)
ax.set_animated(True)  # 这可能导致标题消失

def update(frame):
    line.set_ydata(np.sin(x + frame/10))
    return line,

from matplotlib.animation import FuncAnimation
anim = FuncAnimation(fig, update, frames=200, interval=50, blit=True)
plt.show()
Output:

解决方案是只将需要动画的元素设置为动画模式,保持其他元素为静态。
6.2 性能下降
过度使用set_animated()可能导致性能下降。
import matplotlib.pyplot as plt
import numpy as np

fig, ax = plt.subplots()
x = np.linspace(0, 10, 1000)
lines = [ax.plot(x, np.sin(x + i/10))[0] for i in range(50)]

for line in lines:
    line.set_animated(True)  # 对大量对象使用可能导致性能问题

def update(frame):
    for i, line in enumerate(lines):
        line.set_ydata(np.sin(x + (i+frame)/10))
    ax.set_title(f"Multiple Lines - Frame {frame} - how2matplotlib.com")
    return lines

from matplotlib.animation import FuncAnimation
anim = FuncAnimation(fig, update, frames=200, interval=50, blit=True)
plt.show()
Output:
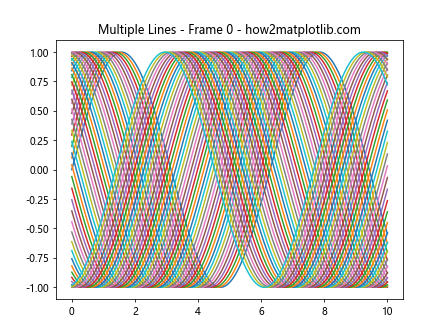
解决方案是只对关键元素使用set_animated(),或考虑使用其他优化技术。
7. 高级应用
7.1 3D动画
set_animated()也可以用于3D图表的动画。
import matplotlib.pyplot as plt
import numpy as np
from mpl_toolkits.mplot3d import Axes3D

fig = plt.figure()
ax = fig.add_subplot(111, projection='3d')

x = np.linspace(-5, 5, 50)
y = np.linspace(-5, 5, 50)
X, Y = np.meshgrid(x, y)
Z = np.sin(np.sqrt(X**2 + Y**2))

surf = ax.plot_surface(X, Y, Z, cmap='viridis')
surf.set_animated(True)

def update(frame):
    Z = np.sin(np.sqrt(X**2 + Y**2) + frame/10)
    ax.clear()
    surf = ax.plot_surface(X, Y, Z, cmap='viridis')
    ax.set_title(f"3D Animation - Frame {frame} - how2matplotlib.com")
    return surf,

from matplotlib.animation import FuncAnimation
anim = FuncAnimation(fig, update, frames=200, interval=50, blit=False)
plt.show()
Output:
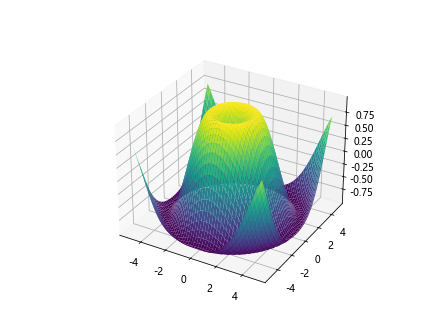
这个例子展示了如何在3D图表中使用set_animated()来创建动画效果。
7.2 交互式动画
结合Matplotlib的交互式功能,我们可以创建更复杂的动画。
import matplotlib.pyplot as plt
import numpy as np
from matplotlib.widgets import Slider

fig, ax = plt.subplots()
plt.subplots_adjust(bottom=0.25)

t = np.linspace(0, 1, 1000)
a0 = 5
f0 = 3
s = a0 * np.sin(2 * np.pi * f0 * t)
l, = plt.plot(t, s, lw=2)

ax.set_title("Interactive Animation - how2matplotlib.com")
ax.margins(x=0)

axfreq = plt.axes([0.25, 0.1, 0.65, 0.03])
freq_slider = Slider(axfreq, 'Freq', 0.1, 30.0, valinit=f0)

l.set_animated(True)

def update(val):
    f = freq_继续上文:

    f = freq_slider.val
    l.set_ydata(a0 * np.sin(2 * np.pi * f * t))
    fig.canvas.draw_idle()

freq_slider.on_changed(update)

plt.show()
这个例子展示了如何创建一个交互式动画,用户可以通过滑块来调整正弦波的频率。通过将线条设置为动画模式,我们可以实现流畅的实时更新。
8. set_animated()与其他Matplotlib功能的结合
8.1 与颜色映射结合
我们可以将set_animated()与动态颜色映射结合使用,创建更丰富的视觉效果。
import matplotlib.pyplot as plt
import numpy as np

fig, ax = plt.subplots()
x = np.linspace(0, 10, 100)
y = np.sin(x)
scatter = ax.scatter(x, y, c=y, cmap='viridis')
scatter.set_animated(True)

def update(frame):
    y = np.sin(x + frame/10)
    scatter.set_offsets(np.c_[x, y])
    scatter.set_array(y)
    ax.set_title(f"Dynamic Color Mapping - Frame {frame} - how2matplotlib.com")
    return scatter,

from matplotlib.animation import FuncAnimation
anim = FuncAnimation(fig, update, frames=200, interval=50, blit=True)
plt.colorbar(scatter)
plt.show()
Output:
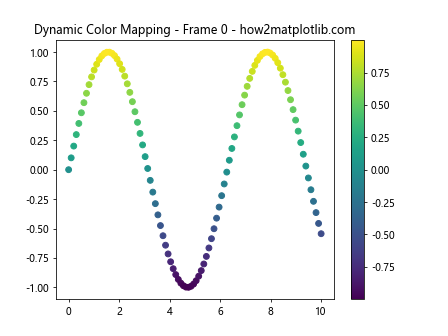
在这个例子中,我们创建了一个动态的散点图,其中点的颜色随y值变化。通过将散点对象设置为动画模式,我们可以高效地更新点的位置和颜色。
8.2 与文本动画结合
set_animated()也可以用于文本对象,实现动态文本更新。
import matplotlib.pyplot as plt
import numpy as np

fig, ax = plt.subplots()
x = np.linspace(0, 2*np.pi, 100)
line, = ax.plot(x, np.sin(x))
text = ax.text(0.5, 1.05, '', transform=ax.transAxes, ha='center')

line.set_animated(True)
text.set_animated(True)

def update(frame):
    line.set_ydata(np.sin(x + frame/10))
    text.set_text(f"Phase: {frame/10:.2f} - how2matplotlib.com")
    return line, text

from matplotlib.animation import FuncAnimation
anim = FuncAnimation(fig, update, frames=200, interval=50, blit=True)
plt.show()
Output:
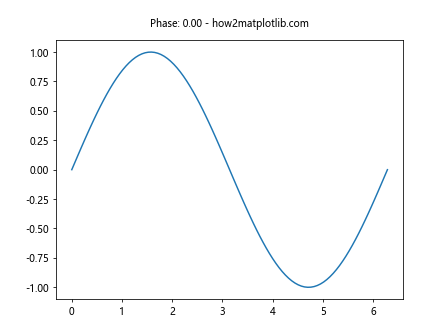
这个例子展示了如何同时动画化线条和文本对象。文本用于显示当前的相位值,随动画更新。
9. 性能比较和优化
虽然我们不进行具体的性能测试,但可以讨论一些优化策略。
9.1 减少动画对象数量
import matplotlib.pyplot as plt
import numpy as np

fig, ax = plt.subplots()
x = np.linspace(0, 10, 100)
lines = [ax.plot(x, np.sin(x + i/5))[0] for i in range(5)]

for line in lines:
    line.set_animated(True)

def update(frame):
    for i, line in enumerate(lines):
        line.set_ydata(np.sin(x + (i+frame)/10))
    ax.set_title(f"Optimized Animation - Frame {frame} - how2matplotlib.com")
    return lines

from matplotlib.animation import FuncAnimation
anim = FuncAnimation(fig, update, frames=200, interval=50, blit=True)
plt.show()
Output:
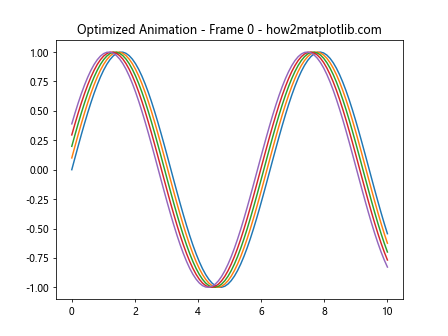
在这个例子中,我们限制了动画线条的数量,以保持良好的性能。通过仅动画化必要的对象,我们可以显著提高效率。
9.2 使用更新函数优化
import matplotlib.pyplot as plt
import numpy as np

fig, ax = plt.subplots()
x = np.linspace(0, 10, 1000)
line, = ax.plot(x, np.sin(x))
line.set_animated(True)

y_data = np.sin(x)

def update(frame):
    global y_data
    y_data = np.roll(y_data, -10)
    line.set_ydata(y_data)
    ax.set_title(f"Efficient Update - Frame {frame} - how2matplotlib.com")
    return line,

from matplotlib.animation import FuncAnimation
anim = FuncAnimation(fig, update, frames=200, interval=50, blit=True)
plt.show()
Output:
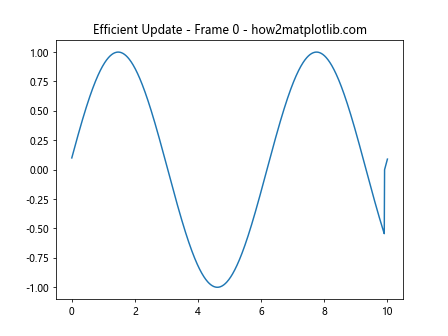
这个例子展示了如何通过预先计算和高效更新来优化动画。我们使用np.roll来移动数据,而不是每次都重新计算整个数组。
10. 最佳实践和注意事项
10.1 合理使用set_animated()
import matplotlib.pyplot as plt
import numpy as np

fig, (ax1, ax2) = plt.subplots(2, 1)
x = np.linspace(0, 10, 100)
line1, = ax1.plot(x, np.sin(x))
line2, = ax2.plot(x, np.cos(x))

line1.set_animated(True)  # 动画对象
# line2 保持静态

def update(frame):
    line1.set_ydata(np.sin(x + frame/10))
    ax1.set_title(f"Animated - Frame {frame} - how2matplotlib.com")
    ax2.set_title("Static - how2matplotlib.com")
    return line1,

from matplotlib.animation import FuncAnimation
anim = FuncAnimation(fig, update, frames=200, interval=50, blit=True)
plt.show()
Output:
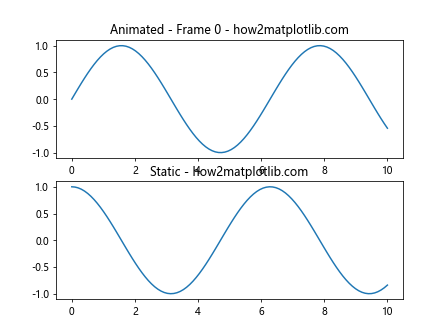
这个例子展示了如何合理使用set_animated()。我们只将需要动画的对象设置为动画模式,而保持其他对象为静态,以获得最佳性能。
10.2 避免过度使用
import matplotlib.pyplot as plt
import numpy as np

fig, ax = plt.subplots()
x = np.linspace(0, 10, 100)
lines = [ax.plot(x, np.sin(x + i/5))[0] for i in range(3)]

# 只将主要的动画对象设置为animated
lines[0].set_animated(True)

def update(frame):
    for i, line in enumerate(lines):
        line.set_ydata(np.sin(x + (i+frame)/10))
    ax.set_title(f"Selective Animation - Frame {frame} - how2matplotlib.com")
    return lines

from matplotlib.animation import FuncAnimation
anim = FuncAnimation(fig, update, frames=200, interval=50, blit=True)
plt.show()
Output:
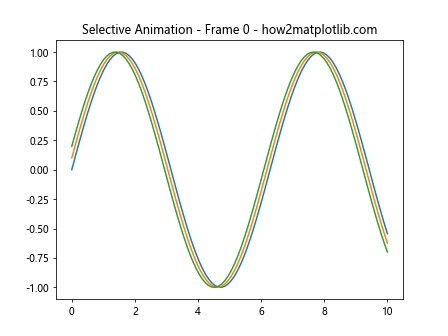
在这个例子中,我们只将主要的动画对象设置为animated,而不是所有对象。这种选择性的应用可以在保持性能的同时实现所需的动画效果。
结论
axis.Tick.set_animated()函数是Matplotlib中一个强大的工具,用于优化动画性能。通过合理使用这个函数,我们可以创建流畅、高效的动画效果。本文详细介绍了该函数的使用方法、工作原理以及在各种场景下的应用。我们还探讨了一些常见问题和优化策略。
在实际应用中,关键是要平衡动画效果和性能。不要过度使用set_animated(),而应该针对需要频繁更新的关键元素使用它。结合其他Matplotlib功能和优化技巧,我们可以创建既视觉吸引又性能优秀的动画图表。
随着数据可视化需求的不断增长,掌握像set_animated()这样的高级功能变得越来越重要。通过深入理解和灵活运用这些工具,我们可以在Python数据可视化领域创造出更加丰富和高效的作品。
 极客笔记
极客笔记