Matplotlib中的Axis.get_sketch_params()函数详解与应用
参考:Matplotlib.axis.Axis.get_sketch_params() function in Python
Matplotlib是Python中最流行的数据可视化库之一,它提供了丰富的绘图功能和自定义选项。在Matplotlib中,Axis.get_sketch_params()函数是一个重要的方法,用于获取轴的草图参数。本文将深入探讨这个函数的用法、参数和应用场景,帮助读者更好地理解和使用它来增强数据可视化效果。
1. Axis.get_sketch_params()函数简介
Axis.get_sketch_params()是Matplotlib库中axis.Axis类的一个方法。这个函数用于获取轴的草图参数,这些参数控制了轴线的绘制风格,使其呈现出手绘或草图的效果。通过调用这个函数,我们可以获取当前轴的草图参数设置,包括缩放、长度和随机性。
让我们从一个简单的例子开始:
import matplotlib.pyplot as plt

fig, ax = plt.subplots()
ax.set_title("how2matplotlib.com - Basic Axis Example")
ax.set_xlabel("X-axis")
ax.set_ylabel("Y-axis")

# 获取x轴的草图参数
sketch_params = ax.xaxis.get_sketch_params()
print("X-axis sketch parameters:", sketch_params)

plt.show()
Output:
在这个例子中,我们创建了一个简单的图表,并获取了x轴的草图参数。通常情况下,如果没有特别设置,get_sketch_params()会返回None,表示没有应用草图效果。
2. 草图参数的组成
get_sketch_params()函数返回的草图参数是一个包含三个元素的元组,或者是None。这三个元素分别是:
- 缩放(scale):控制草图效果的整体强度。
- 长度(length):控制草图线条的长度。
- 随机性(randomness):控制草图效果的随机程度。
让我们通过一个例子来设置和获取这些参数:
import matplotlib.pyplot as plt

fig, ax = plt.subplots()
ax.set_title("how2matplotlib.com - Sketch Parameters Example")

# 设置x轴的草图参数
ax.xaxis.set_sketch_params(scale=1, length=100, randomness=0.1)

# 获取并打印草图参数
sketch_params = ax.xaxis.get_sketch_params()
print("X-axis sketch parameters:", sketch_params)

plt.show()
Output:
在这个例子中,我们首先设置了x轴的草图参数,然后使用get_sketch_params()获取这些参数。输出将显示我们设置的值。
3. 应用草图效果
虽然get_sketch_params()函数本身不会改变轴的外观,但它通常与set_sketch_params()函数一起使用,以创建具有手绘风格的图表。让我们看一个更复杂的例子,展示如何应用和获取草图效果:
import matplotlib.pyplot as plt
import numpy as np

# 创建数据
x = np.linspace(0, 10, 100)
y = np.sin(x)

fig, (ax1, ax2) = plt.subplots(2, 1, figsize=(8, 10))
fig.suptitle("how2matplotlib.com - Sketch Effect Comparison")

# 绘制普通图
ax1.plot(x, y)
ax1.set_title("Normal Plot")

# 绘制带草图效果的图
ax2.plot(x, y)
ax2.set_title("Sketch Effect Plot")
ax2.set_sketch_params(scale=5, length=100, randomness=0.3)

# 获取并打印草图参数
sketch_params = ax2.get_sketch_params()
print("Axis sketch parameters:", sketch_params)

plt.tight_layout()
plt.show()
Output:
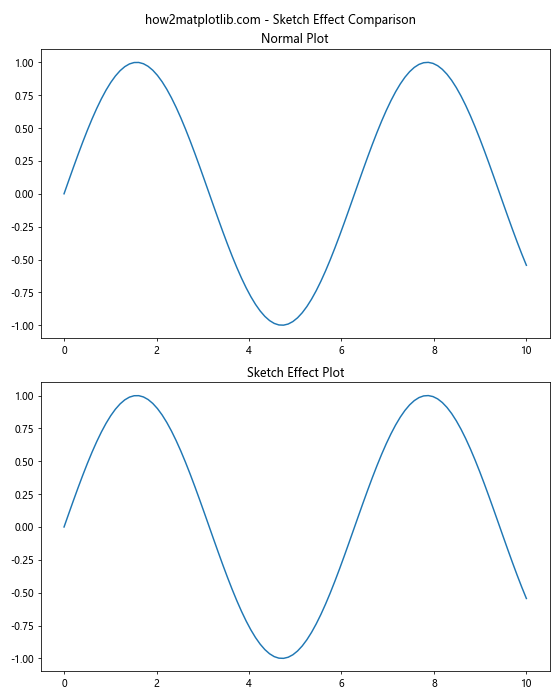
在这个例子中,我们创建了两个子图:一个是普通的正弦波图,另一个应用了草图效果。通过比较这两个图,我们可以清楚地看到草图效果的影响。
4. 草图参数的影响
让我们更详细地探讨每个草图参数的影响:
4.1 缩放(scale)
缩放参数控制草图效果的整体强度。较大的值会产生更明显的手绘效果,而较小的值则会使效果更加微妙。
import matplotlib.pyplot as plt
import numpy as np

x = np.linspace(0, 10, 100)
y = np.sin(x)

fig, (ax1, ax2) = plt.subplots(2, 1, figsize=(8, 10))
fig.suptitle("how2matplotlib.com - Scale Parameter Comparison")

ax1.plot(x, y)
ax1.set_title("Scale = 1")
ax1.set_sketch_params(scale=1, length=100, randomness=0.1)

ax2.plot(x, y)
ax2.set_title("Scale = 5")
ax2.set_sketch_params(scale=5, length=100, randomness=0.1)

for ax in (ax1, ax2):
    print(f"Sketch params for {ax.get_title()}: {ax.get_sketch_params()}")

plt.tight_layout()
plt.show()
Output:
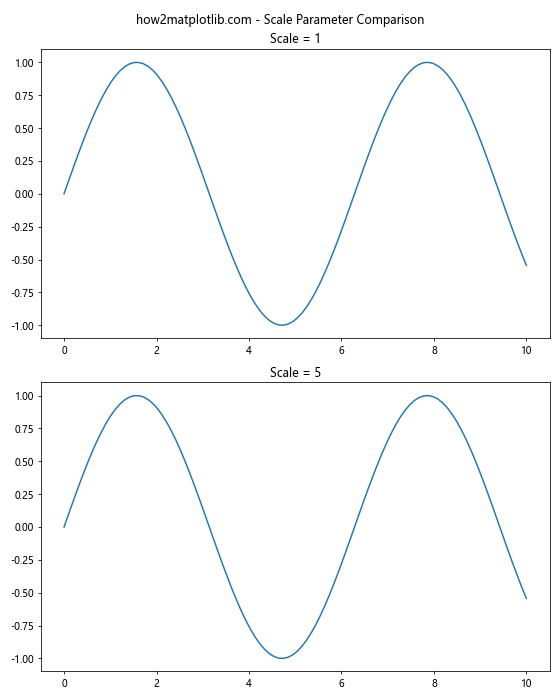
在这个例子中,我们比较了两个不同缩放值的效果,并打印了每个轴的草图参数。
4.2 长度(length)
长度参数控制草图线条的长度。较大的值会产生更长的线条,使图形看起来更加粗糙。
import matplotlib.pyplot as plt
import numpy as np

x = np.linspace(0, 10, 100)
y = np.sin(x)

fig, (ax1, ax2) = plt.subplots(2, 1, figsize=(8, 10))
fig.suptitle("how2matplotlib.com - Length Parameter Comparison")

ax1.plot(x, y)
ax1.set_title("Length = 50")
ax1.set_sketch_params(scale=3, length=50, randomness=0.1)

ax2.plot(x, y)
ax2.set_title("Length = 150")
ax2.set_sketch_params(scale=3, length=150, randomness=0.1)

for ax in (ax1, ax2):
    print(f"Sketch params for {ax.get_title()}: {ax.get_sketch_params()}")

plt.tight_layout()
plt.show()
Output:
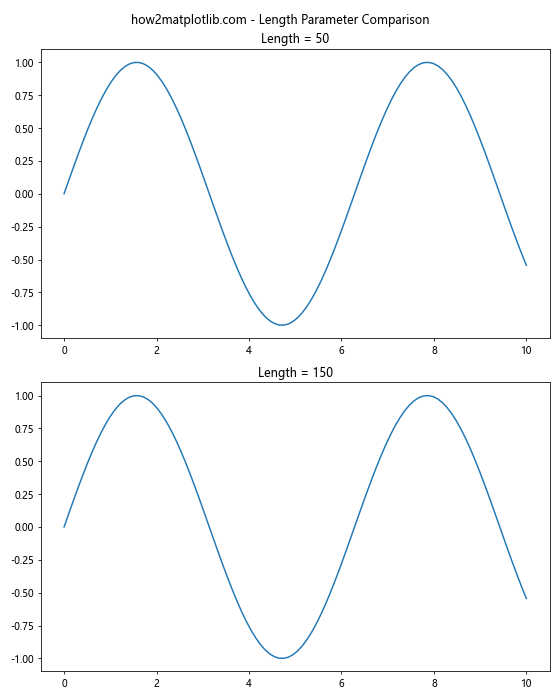
这个例子展示了不同长度参数对草图效果的影响。
4.3 随机性(randomness)
随机性参数控制草图效果的不规则程度。较高的值会产生更加不规则和手绘的外观。
import matplotlib.pyplot as plt
import numpy as np

x = np.linspace(0, 10, 100)
y = np.sin(x)

fig, (ax1, ax2) = plt.subplots(2, 1, figsize=(8, 10))
fig.suptitle("how2matplotlib.com - Randomness Parameter Comparison")

ax1.plot(x, y)
ax1.set_title("Randomness = 0.1")
ax1.set_sketch_params(scale=3, length=100, randomness=0.1)

ax2.plot(x, y)
ax2.set_title("Randomness = 0.5")
ax2.set_sketch_params(scale=3, length=100, randomness=0.5)

for ax in (ax1, ax2):
    print(f"Sketch params for {ax.get_title()}: {ax.get_sketch_params()}")

plt.tight_layout()
plt.show()
Output:
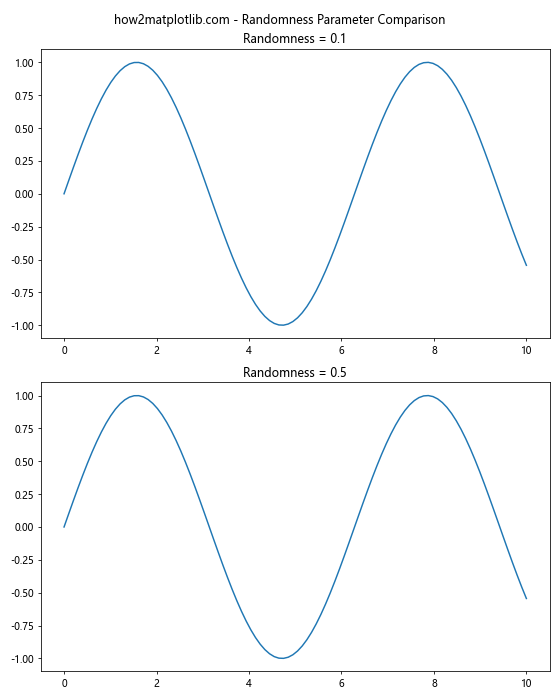
这个例子展示了不同随机性参数对草图效果的影响。
5. 在不同类型的图表中应用草图效果
草图效果可以应用于各种类型的图表,让我们看一些例子:
5.1 柱状图
import matplotlib.pyplot as plt
import numpy as np

categories = ['A', 'B', 'C', 'D']
values = [3, 7, 2, 5]

fig, ax = plt.subplots()
ax.bar(categories, values)
ax.set_title("how2matplotlib.com - Bar Chart with Sketch Effect")
ax.set_sketch_params(scale=3, length=100, randomness=0.2)

print("Bar chart sketch params:", ax.get_sketch_params())

plt.show()
Output:
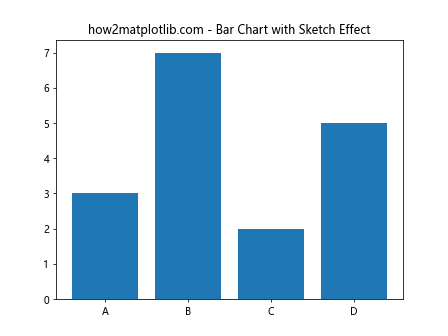
这个例子展示了如何在柱状图上应用草图效果。
5.2 散点图
import matplotlib.pyplot as plt
import numpy as np

x = np.random.rand(50)
y = np.random.rand(50)

fig, ax = plt.subplots()
ax.scatter(x, y)
ax.set_title("how2matplotlib.com - Scatter Plot with Sketch Effect")
ax.set_sketch_params(scale=5, length=100, randomness=0.3)

print("Scatter plot sketch params:", ax.get_sketch_params())

plt.show()
Output:
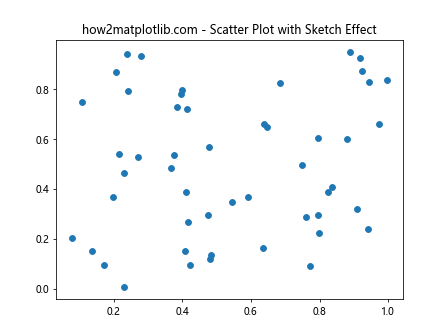
这个例子展示了如何在散点图上应用草图效果。
5.3 饼图
import matplotlib.pyplot as plt

sizes = [30, 20, 25, 15, 10]
labels = ['A', 'B', 'C', 'D', 'E']

fig, ax = plt.subplots()
ax.pie(sizes, labels=labels, autopct='%1.1f%%')
ax.set_title("how2matplotlib.com - Pie Chart with Sketch Effect")
ax.set_sketch_params(scale=2, length=80, randomness=0.2)

print("Pie chart sketch params:", ax.get_sketch_params())

plt.show()
Output:
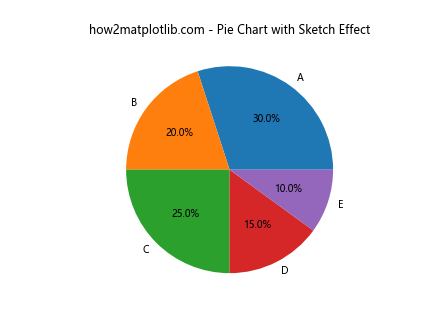
这个例子展示了如何在饼图上应用草图效果。
6. 在子图中使用草图效果
当使用子图时,我们可以为每个子图单独设置和获取草图参数:
import matplotlib.pyplot as plt
import numpy as np

fig, (ax1, ax2) = plt.subplots(1, 2, figsize=(12, 5))
fig.suptitle("how2matplotlib.com - Subplots with Different Sketch Effects")

x = np.linspace(0, 10, 100)
y = np.sin(x)

ax1.plot(x, y)
ax1.set_title("Subtle Sketch Effect")
ax1.set_sketch_params(scale=1, length=50, randomness=0.1)

ax2.plot(x, y)
ax2.set_title("Strong Sketch Effect")
ax2.set_sketch_params(scale=5, length=150, randomness=0.3)

for ax in (ax1, ax2):
    print(f"Sketch params for {ax.get_title()}: {ax.get_sketch_params()}")

plt.tight_layout()
plt.show()
Output:
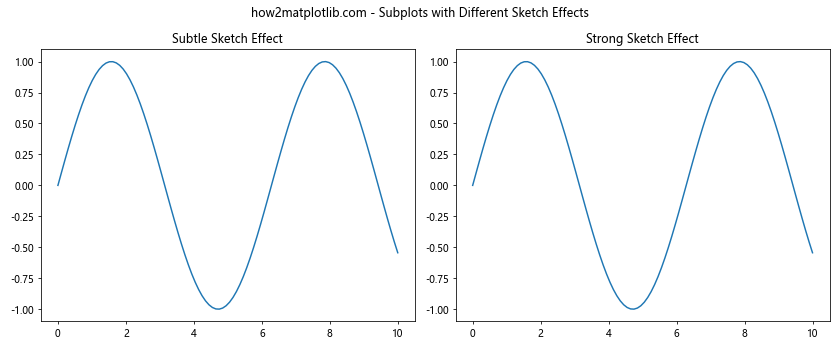
这个例子展示了如何在不同的子图中应用不同的草图效果。
7. 动态调整草图参数
我们可以使用交互式控件来动态调整草图参数,这对于探索不同参数组合的效果非常有用:
import matplotlib.pyplot as plt
import numpy as np
from matplotlib.widgets import Slider

fig, ax = plt.subplots(figsize=(10, 8))
plt.subplots_adjust(bottom=0.25)

x = np.linspace(0, 10, 100)
y = np.sin(x)
line, = ax.plot(x, y)

ax.set_title("how2matplotlib.com - Interactive Sketch Effect")

ax_scale = plt.axes([0.1, 0.1, 0.65, 0.03])
ax_length = plt.axes([0.1, 0.15, 0.65, 0.03])
ax_randomness = plt.axes([0.1, 0.2, 0.65, 0.03])

s_scale = Slider(ax_scale, 'Scale', 0, 10, valinit=1)
s_length = Slider(ax_length, 'Length', 0, 200, valinit=100)
s_randomness = Slider(ax_randomness, 'Randomness', 0, 1, valinit=0.1)

def update(val):
    ax.set_sketch_params(scale=s_scale.val, length=s_length.val, randomness=s_randomness.val)
    fig.canvas.draw_idle()
    print("Current sketch params:", ax.get_sketch_params())

s_scale.on_changed(update)
s_length.on_changed(update)
s_randomness.on_changed(update)

plt.show()
Output:
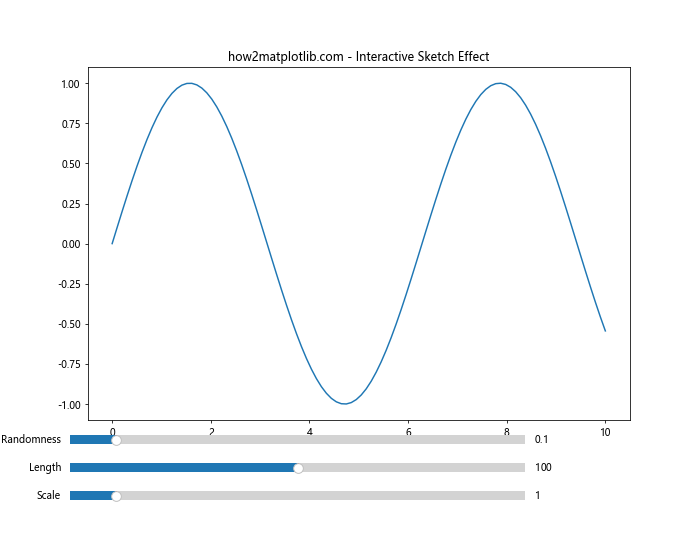
这个交互式例子允许用户实时调整草图参数,并立即看到效果。
8. 在3D图表中使用草图效果
草图效果也可以应用于3D图表,尽管效果可能不如2D图表明显:
import matplotlib.pyplot as plt
import numpy as np

fig = plt.figure(figsize=(10, 8))
ax = fig.add_subplot(111, projection='3d')

x = np.linspace(-5, 5, 100)
y = np.linspace(-5, 5, 100)
X, Y = np.meshgrid(x, y)
Z = np.sin(np.sqrt(X**2 + Y**2))

surf = ax.plot_surface(X, Y, Z, cmap='viridis')

ax.set_title("how2matplotlib.com - 3D Surface Plot with Sketch Effect")
ax.set_sketch_params(scale=3, length=100, randomness=0.2)

print("3D plot sketch params:", ax.get_sketch_params())

plt.show()
Output:
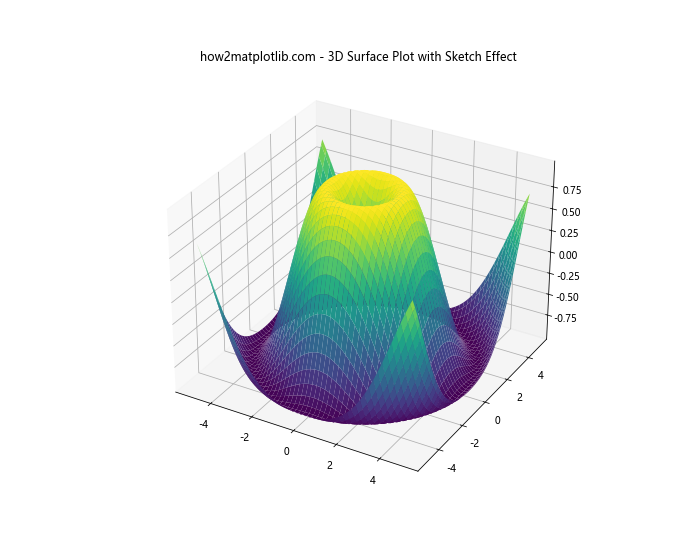
这个例子展示了如何在3D表面图上应用草图效果。
9. 结合其他样式效果
草图效果可以与其他Matplotlib样式选项结合使用,以创建独特的视觉效果:
import matplotlib.pyplot as plt
import numpy as np

plt.style.use('seaborn')

x = np.linspace(0, 10, 100)
y = np.sin(x)

fig, ax = plt.subplots(figsize=(10, 6))
ax.plot(x, y, linewidth=2, color='red')
ax.fill_between(x, y, alpha=0.3)
ax.set_title("how2matplotlib.com - Combining Sketch Effect with Other Styles")
ax.set_sketch_params(scale=3, length=100, randomness=0.2)

print("Combined style sketch params:", ax.get_sketch_params())

plt.grid(True, linestyle='--', alpha=0.7)
plt.show()
这个例子展示了如何将草图效果与其他样式选项(如seaborn样式、填充区域和网格线)结合使用。
10. 在多个轴上应用不同的草图效果
在一个图表中,我们可以为不同的轴设置不同的草图效果:
import matplotlib.pyplot as plt
import numpy as np

fig, ax = plt.subplots(figsize=(10, 6))

x = np.linspace(0, 10, 100)
y1 = np.sin(x)
y2 = np.cos(x)

ax.plot(x, y1, label='Sin')
ax.plot(x, y2, label='Cos')
ax.set_title("how2matplotlib.com - Different Sketch Effects on Axes")

# 设置x轴的草图效果
ax.xaxis.set_sketch_params(scale=2, length=80, randomness=0.1)

# 设置y轴的草图效果
ax.yaxis.set_sketch_params(scale=4, length=120, randomness=0.3)

print("X-axis sketch params:", ax.xaxis.get_sketch_params())
print("Y-axis sketch params:", ax.yaxis.get_sketch_params())

ax.legend()
plt.show()
Output:
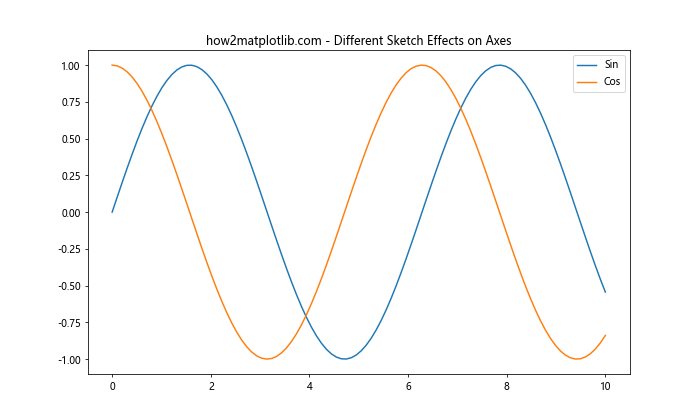
这个例子展示了如何为x轴和y轴设置不同的草图效果。
11. 在图例中应用草图效果
我们还可以为图例应用草图效果:
import matplotlib.pyplot as plt
import numpy as np

fig, ax = plt.subplots(figsize=(10, 6))

x = np.linspace(0, 10, 100)
y1 = np.sin(x)
y2 = np.cos(x)

ax.plot(x, y1, label='Sin')
ax.plot(x, y2, label='Cos')
ax.set_title("how2matplotlib.com - Sketch Effect on Legend")

legend = ax.legend()
legend.set_sketch_params(scale=3, length=100, randomness=0.2)

print("Legend sketch params:", legend.get_sketch_params())

plt.show()
Output:
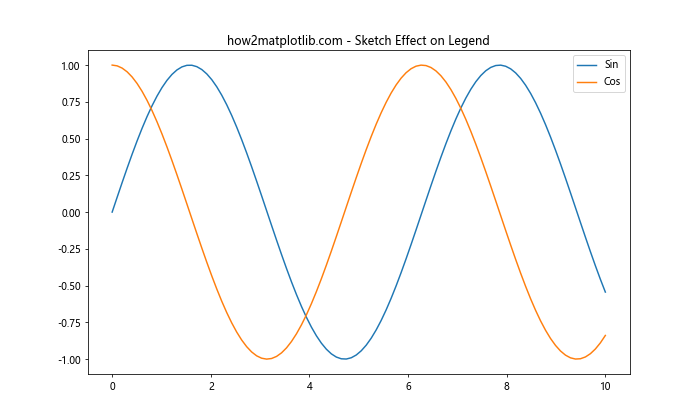
这个例子展示了如何为图例应用草图效果。
12. 在极坐标图中使用草图效果
草图效果也可以应用于极坐标图:
import matplotlib.pyplot as plt
import numpy as np

fig, ax = plt.subplots(subplot_kw=dict(projection='polar'))

r = np.linspace(0, 1, 100)
theta = 2 * np.pi * r

ax.plot(theta, r)
ax.set_title("how2matplotlib.com - Polar Plot with Sketch Effect")
ax.set_sketch_params(scale=3, length=100, randomness=0.2)

print("Polar plot sketch params:", ax.get_sketch_params())

plt.show()
Output:
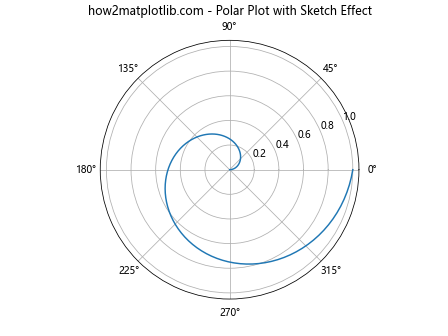
这个例子展示了如何在极坐标图上应用草图效果。
13. 在箱线图中使用草图效果
箱线图也可以应用草图效果:
import matplotlib.pyplot as plt
import numpy as np

fig, ax = plt.subplots(figsize=(10, 6))

data = [np.random.normal(0, std, 100) for std in range(1, 4)]

ax.boxplot(data)
ax.set_title("how2matplotlib.com - Box Plot with Sketch Effect")
ax.set_sketch_params(scale=2, length=80, randomness=0.2)

print("Box plot sketch params:", ax.get_sketch_params())

plt.show()
Output:
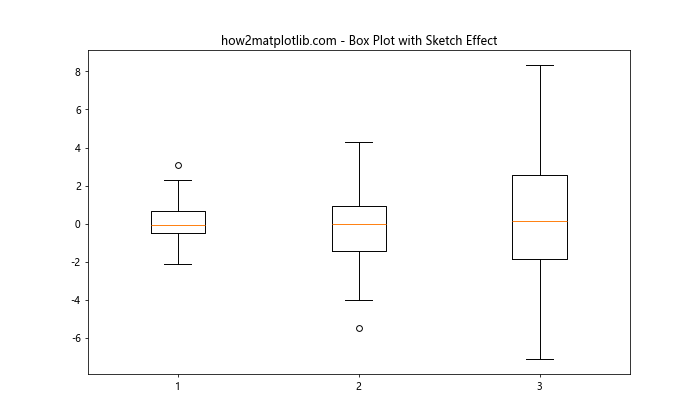
这个例子展示了如何在箱线图上应用草图效果。
14. 在热图中使用草图效果
虽然在热图中应用草图效果可能不太常见,但我们仍然可以尝试:
import matplotlib.pyplot as plt
import numpy as np

fig, ax = plt.subplots(figsize=(10, 8))

data = np.random.rand(10, 10)

im = ax.imshow(data, cmap='viridis')
ax.set_title("how2matplotlib.com - Heatmap with Sketch Effect")
ax.set_sketch_params(scale=2, length=50, randomness=0.1)

plt.colorbar(im)

print("Heatmap sketch params:", ax.get_sketch_params())

plt.show()
Output:
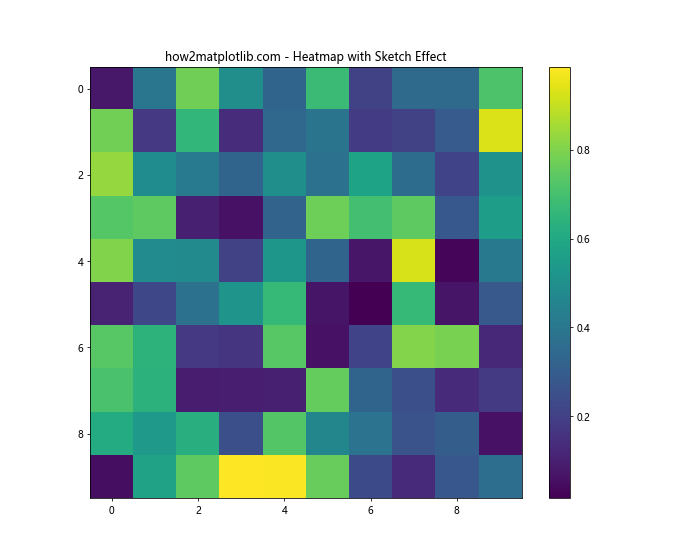
这个例子展示了如何在热图上应用草图效果。
15. 结合动画效果
我们可以将草图效果与动画结合,创建有趣的视觉效果:
import matplotlib.pyplot as plt
import numpy as np
from matplotlib.animation import FuncAnimation

fig, ax = plt.subplots(figsize=(10, 6))

x = np.linspace(0, 2 * np.pi, 100)
line, = ax.plot(x, np.sin(x))

ax.set_title("how2matplotlib.com - Animated Sketch Effect")

def update(frame):
    ax.set_sketch_params(scale=frame/10, length=100, randomness=0.2)
    line.set_ydata(np.sin(x + frame/10))
    print(f"Frame {frame} sketch params:", ax.get_sketch_params())
    return line,

ani = FuncAnimation(fig, update, frames=range(0, 60), interval=100, blit=True)

plt.show()
Output:
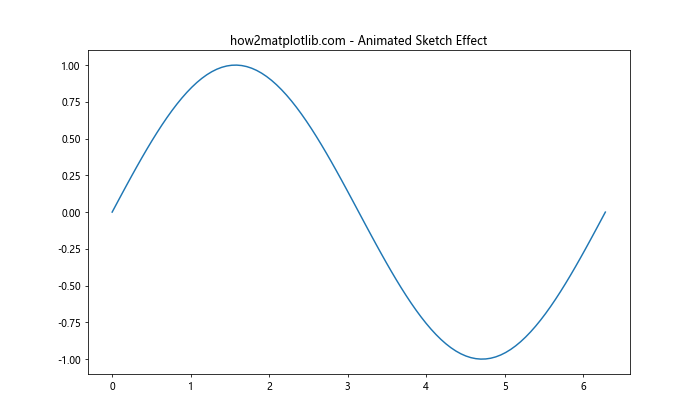
这个例子创建了一个动画,其中草图效果的强度随时间变化。
总结
Axis.get_sketch_params()函数是Matplotlib中一个强大而有趣的工具,它允许我们获取和操作图表的草图效果参数。通过调整缩放、长度和随机性参数,我们可以创建各种手绘风格的图表,为数据可视化增添独特的艺术感。
本文详细介绍了get_sketch_params()函数的用法,并通过多个示例展示了如何在不同类型的图表中应用和调整草图效果。我们还探讨了如何将草图效果与其他Matplotlib功能结合,如子图、3D图表、动画等。
使用草图效果可以使你的数据可视化更加生动有趣,特别适合用于演示、教育或创意项目。然而,在正式的科学报告或出版物中使用时需要谨慎,因为它可能会影响数据的精确表示。
通过掌握get_sketch_params()和相关的set_sketch_params()函数,你可以在Matplotlib中创建独特而富有表现力的图表,为你的数据可视化项目增添新的维度。
 极客笔记
极客笔记