Matplotlib中的Axis.get_major_formatter()函数:轻松获取和自定义主刻度格式化器
参考:Matplotlib.axis.Axis.get_major_formatter() function in Python
Matplotlib是Python中最流行的数据可视化库之一,它提供了丰富的绘图功能和自定义选项。在创建图表时,刻度标签的格式化是一个重要的方面,它可以极大地影响图表的可读性和美观性。Axis.get_major_formatter()函数是Matplotlib中用于获取主刻度格式化器的重要方法,本文将深入探讨这个函数的用法、特性以及如何利用它来优化你的图表。
1. Axis.get_major_formatter()函数简介
Axis.get_major_formatter()是Matplotlib库中axis模块的一个方法,它属于Axis类。这个函数的主要作用是获取当前轴(axis)上主刻度的格式化器对象。格式化器负责将刻度的数值转换为字符串,以便在图表上显示。
让我们从一个简单的例子开始:
import matplotlib.pyplot as plt
import numpy as np

x = np.linspace(0, 10, 100)
y = np.sin(x)

fig, ax = plt.subplots()
ax.plot(x, y)

formatter = ax.xaxis.get_major_formatter()
print(f"Current x-axis formatter: {formatter}")

plt.title("how2matplotlib.com - Get Major Formatter Example")
plt.show()
Output:
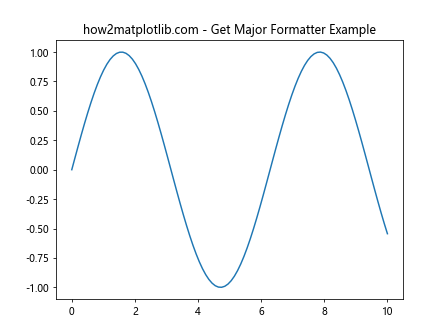
在这个例子中,我们创建了一个简单的正弦曲线图,然后使用get_major_formatter()方法获取x轴的主刻度格式化器。通常,默认的格式化器是ScalarFormatter,它会根据数据的范围自动选择合适的格式来显示刻度标签。
2. 理解主刻度和次刻度
在深入研究get_major_formatter()之前,我们需要理解主刻度和次刻度的概念:
- 主刻度(Major ticks):这些是轴上的主要刻度标记,通常更加突出,并带有标签。
- 次刻度(Minor ticks):这些是主刻度之间的较小刻度标记,通常不带标签。
get_major_formatter()函数专门用于处理主刻度的格式化。让我们看一个展示主刻度和次刻度的例子:
import matplotlib.pyplot as plt
import numpy as np

x = np.linspace(0, 5, 50)
y = x ** 2

fig, ax = plt.subplots()
ax.plot(x, y)

ax.xaxis.set_major_locator(plt.MultipleLocator(1))
ax.xaxis.set_minor_locator(plt.MultipleLocator(0.2))

ax.yaxis.set_major_locator(plt.MultipleLocator(5))
ax.yaxis.set_minor_locator(plt.MultipleLocator(1))

plt.title("how2matplotlib.com - Major and Minor Ticks Example")
plt.grid(which='both', linestyle='--', alpha=0.7)
plt.show()
Output:
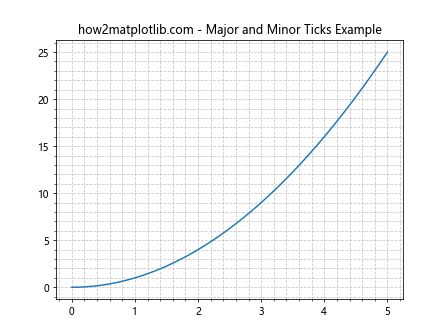
在这个例子中,我们使用MultipleLocator来设置主刻度和次刻度的间隔。主刻度的格式化器会影响带有标签的主刻度的显示方式。
3. 常见的格式化器类型
Matplotlib提供了多种格式化器类型,每种都适用于不同的场景。以下是一些常见的格式化器:
- ScalarFormatter:默认的格式化器,适用于大多数数值数据。
- FuncFormatter:允许你自定义格式化函数。
- FormatStrFormatter:使用格式字符串来格式化刻度标签。
- StrMethodFormatter:使用字符串的format方法来格式化刻度标签。
- PercentFormatter:将数值格式化为百分比。
- LogFormatter:用于对数刻度的格式化。
让我们通过例子来了解如何使用这些格式化器:
import matplotlib.pyplot as plt
import numpy as np
from matplotlib.ticker import ScalarFormatter, FuncFormatter, FormatStrFormatter, StrMethodFormatter, PercentFormatter

x = np.linspace(0, 1, 10)
y = x ** 2

fig, ((ax1, ax2), (ax3, ax4)) = plt.subplots(2, 2, figsize=(12, 8))

# ScalarFormatter
ax1.plot(x, y)
ax1.xaxis.set_major_formatter(ScalarFormatter())
ax1.set_title("how2matplotlib.com - ScalarFormatter")

# FuncFormatter
def custom_formatter(x, pos):
    return f"[{x:.2f}]"
ax2.plot(x, y)
ax2.xaxis.set_major_formatter(FuncFormatter(custom_formatter))
ax2.set_title("how2matplotlib.com - FuncFormatter")

# FormatStrFormatter
ax3.plot(x, y)
ax3.xaxis.set_major_formatter(FormatStrFormatter('%.3f'))
ax3.set_title("how2matplotlib.com - FormatStrFormatter")

# PercentFormatter
ax4.plot(x, y)
ax4.xaxis.set_major_formatter(PercentFormatter(xmax=1))
ax4.set_title("how2matplotlib.com - PercentFormatter")

plt.tight_layout()
plt.show()
Output:
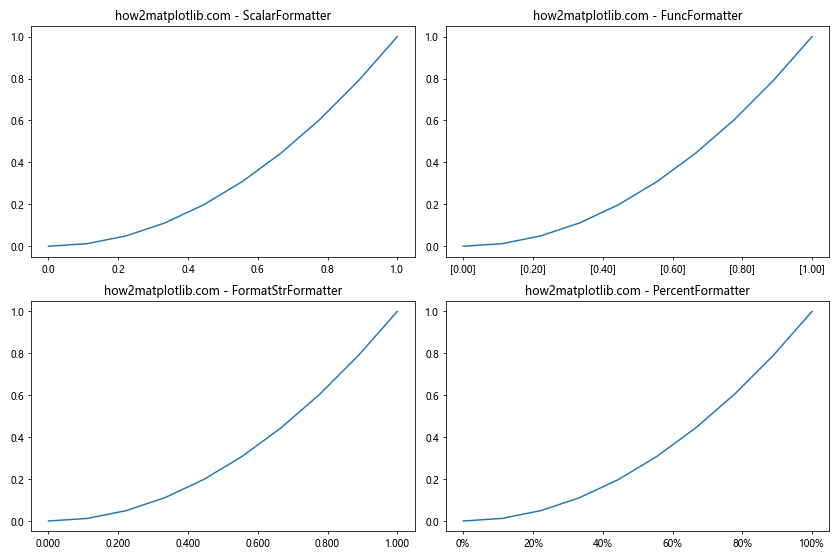
这个例子展示了四种不同的格式化器。ScalarFormatter是默认的格式化器,FuncFormatter允许我们自定义格式化函数,FormatStrFormatter使用格式字符串,而PercentFormatter将数值转换为百分比。
4. 使用get_major_formatter()获取当前格式化器
get_major_formatter()函数的主要用途是获取当前轴上使用的主刻度格式化器。这在你需要检查或修改现有格式化器时非常有用。让我们看一个例子:
import matplotlib.pyplot as plt
import numpy as np

x = np.linspace(0, 10, 100)
y = np.exp(x)

fig, ax = plt.subplots()
ax.plot(x, y)

current_formatter = ax.xaxis.get_major_formatter()
print(f"Current x-axis formatter: {type(current_formatter)}")

if isinstance(current_formatter, plt.ScalarFormatter):
    current_formatter.set_powerlimits((-2, 2))

plt.title("how2matplotlib.com - Get and Modify Formatter Example")
plt.show()
Output:
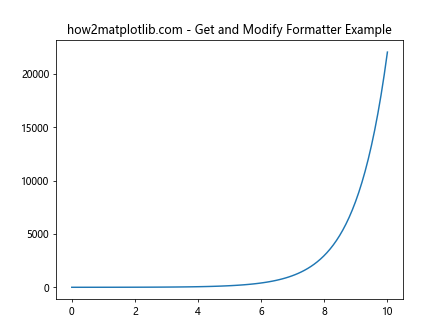
在这个例子中,我们首先获取当前的格式化器,然后检查它是否是ScalarFormatter。如果是,我们修改其功率限制,这会影响科学记数法的使用方式。
5. 自定义格式化器
有时,内置的格式化器可能无法满足你的特定需求。在这种情况下,你可以创建自定义的格式化器。最常用的方法是使用FuncFormatter。让我们看一个例子:
import matplotlib.pyplot as plt
import numpy as np
from matplotlib.ticker import FuncFormatter

def custom_formatter(x, pos):
    if x < 0:
        return f"({abs(x):.1f})"
    return f"{x:.1f}"

x = np.linspace(-5, 5, 100)
y = x ** 2

fig, ax = plt.subplots()
ax.plot(x, y)

ax.xaxis.set_major_formatter(FuncFormatter(custom_formatter))

current_formatter = ax.xaxis.get_major_formatter()
print(f"Current x-axis formatter: {type(current_formatter)}")

plt.title("how2matplotlib.com - Custom Formatter Example")
plt.show()
Output:
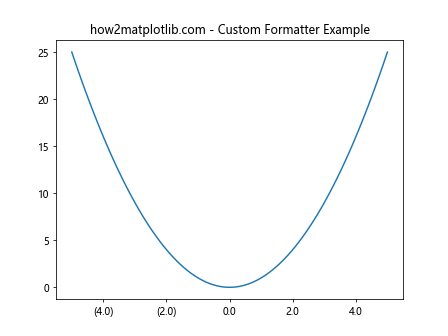
在这个例子中,我们创建了一个自定义格式化器,它对负数使用括号表示。然后我们使用set_major_formatter()方法应用这个格式化器,并用get_major_formatter()验证它已被正确设置。
6. 日期和时间的格式化
对于时间序列数据,Matplotlib提供了专门的日期格式化器。让我们看一个使用DateFormatter的例子:
import matplotlib.pyplot as plt
import numpy as np
from matplotlib.dates import DateFormatter, DayLocator, MonthLocator
from datetime import datetime, timedelta

start_date = datetime(2023, 1, 1)
dates = [start_date + timedelta(days=i) for i in range(180)]
y = np.random.randn(180).cumsum()

fig, ax = plt.subplots(figsize=(12, 6))
ax.plot(dates, y)

ax.xaxis.set_major_locator(MonthLocator())
ax.xaxis.set_minor_locator(DayLocator())
ax.xaxis.set_major_formatter(DateFormatter("%Y-%m"))

current_formatter = ax.xaxis.get_major_formatter()
print(f"Current x-axis formatter: {type(current_formatter)}")

plt.title("how2matplotlib.com - Date Formatter Example")
plt.gcf().autofmt_xdate()  # Rotate and align the tick labels
plt.show()
Output:
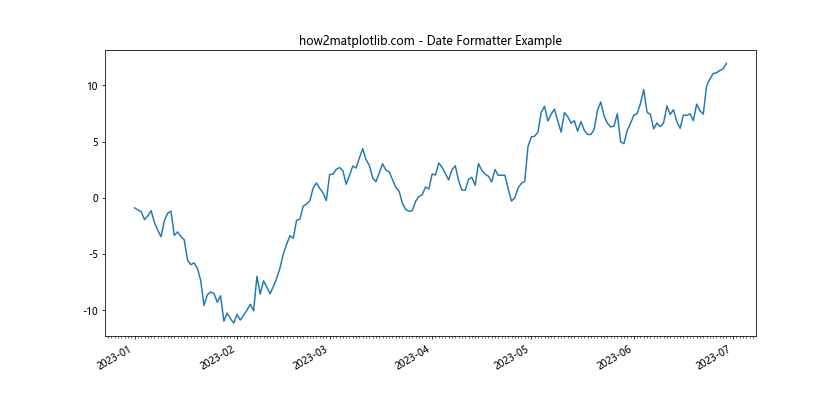
在这个例子中,我们使用DateFormatter来格式化日期刻度。我们还使用了MonthLocator和DayLocator来设置主刻度和次刻度的位置。
7. 对数刻度的格式化
对于对数刻度,Matplotlib提供了专门的LogFormatter。让我们看一个例子:
import matplotlib.pyplot as plt
import numpy as np
from matplotlib.ticker import LogFormatter, LogLocator

x = np.logspace(0, 5, 100)
y = x ** 2

fig, ax = plt.subplots()
ax.loglog(x, y)

ax.xaxis.set_major_formatter(LogFormatter())
ax.xaxis.set_major_locator(LogLocator(base=10, numticks=6))

current_formatter = ax.xaxis.get_major_formatter()
print(f"Current x-axis formatter: {type(current_formatter)}")

plt.title("how2matplotlib.com - Log Formatter Example")
plt.show()
Output:
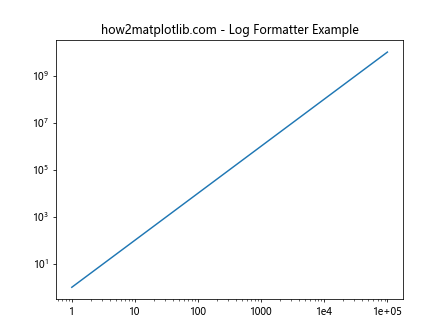
在这个例子中,我们创建了一个对数-对数图,并使用LogFormatter来格式化x轴的刻度标签。我们还使用LogLocator来设置刻度的位置。
8. 多轴图的格式化
在创建多轴图时,你可能需要为不同的轴设置不同的格式化器。让我们看一个例子:
import matplotlib.pyplot as plt
import numpy as np
from matplotlib.ticker import FuncFormatter, PercentFormatter

x = np.linspace(0, 10, 100)
y1 = np.sin(x)
y2 = np.exp(x/10)

fig, (ax1, ax2) = plt.subplots(1, 2, figsize=(12, 5))

ax1.plot(x, y1)
ax1.xaxis.set_major_formatter(FuncFormatter(lambda x, p: f"[{x:.1f}]"))

ax2.plot(x, y2)
ax2.yaxis.set_major_formatter(PercentFormatter(xmax=1000))

for ax in (ax1, ax2):
    print(f"X-axis formatter: {type(ax.xaxis.get_major_formatter())}")
    print(f"Y-axis formatter: {type(ax.yaxis.get_major_formatter())}")

plt.suptitle("how2matplotlib.com - Multi-Axis Formatting Example")
plt.tight_layout()
plt.show()
Output:
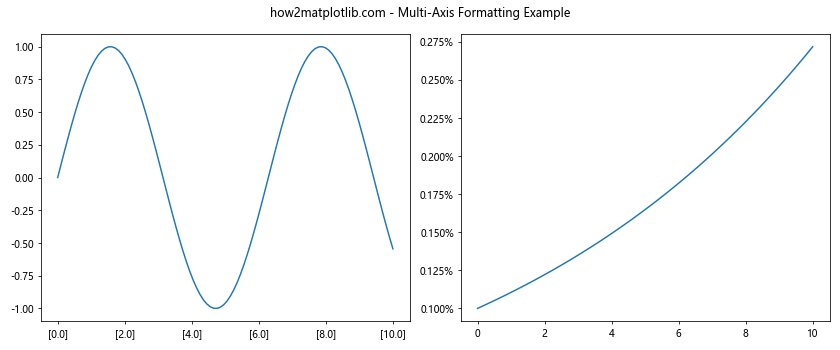
在这个例子中,我们创建了两个子图,并为每个子图的轴设置了不同的格式化器。我们使用get_major_formatter()来验证每个轴的格式化器类型。
9. 动态更新格式化器
在某些情况下,你可能需要根据数据的变化动态更新格式化器。让我们看一个例子:
import matplotlib.pyplot as plt
import numpy as np
from matplotlib.ticker import ScalarFormatter, FuncFormatter

def update_formatter(ax, data):
    if np.max(np.abs(data)) > 1000:
        ax.yaxis.set_major_formatter(ScalarFormatter(useMathText=True))
    else:
        ax.yaxis.set_major_formatter(FuncFormatter(lambda x, p: f"{x:.2f}"))

x = np.linspace(0, 10, 100)
y_small = np.sin(x) * 10
y_large = np.sin(x) * 1000

fig, (ax1, ax2) = plt.subplots(1, 2, figsize=(12, 5))

ax1.plot(x, y_small)
update_formatter(ax1, y_small)

ax2.plot(x, y_large)
update_formatter(ax2, y_large)

for ax in (ax1, ax2):
    print(f"Y-axis formatter: {type(ax.yaxis.get_major_formatter())}")

plt.suptitle("how2matplotlib.com - Dynamic Formatter Update Example")
plt.tight_layout()
plt.show()
Output:
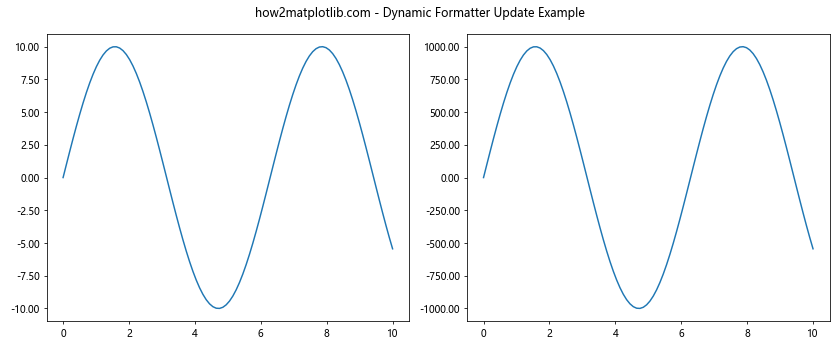
在这个例子中,我们定义了一个update_formatter函数,它根据数据的范围选择合适的格式化器。对于大数值,我们使用ScalarFormatter并启用数学文本模式,而对于小数值,我们使用自定义的FuncFormatter。
10. 格式化器的性能考虑
虽然格式化器可以大大提高图表的可读性,但在处理大量数据时,复杂的自定义格式化器可能会影响性能。在这种情况下,可以考虑使用预计算的标签或简化的格式化逻辑。让我们看一个例子:
import matplotlib.pyplot as plt
import numpy as np
from matplotlib.ticker import FuncFormatter

def efficient_formatter(x, pos):
    return f"{x:.1f}"

x = np.linspace(0, 1000, 10000)
y = np.sin(x)

fig, ax = plt.subplots()
ax.plot(x, y)

ax.xaxis.set_major_formatter(FuncFormatter(efficient_formatter))

current_formatter = ax.xaxis.get_major_formatter()
print(f"Current x-axis formatter: {type(current_formatter)}")

plt.title("how2matplotlib.com - Efficient Formatter Example")
plt.show()
Output:
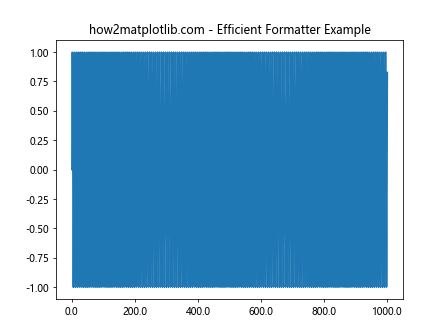
在这个例子中,我们使用了一个简单的格式化函数,它只保留一位小数。这种简单的格式化方式在处理大量数据时可以提高性能。
11. 格式化器与定位器的配合使用
格式化器通常与定位器(Locator)配合使用,以控制刻度的位置和标签。让我们看一个例子,展示如何协调使用格式化器和定位器:
import matplotlib.pyplot as plt
import numpy as np
from matplotlib.ticker import MultipleLocator, FormatStrFormatter

x = np.linspace(0, 10, 100)
y = np.sin(x)

fig, ax = plt.subplots()
ax.plot(x, y)

ax.xaxis.set_major_locator(MultipleLocator(2))
ax.xaxis.set_major_formatter(FormatStrFormatter('%.1f'))

ax.xaxis.set_minor_locator(MultipleLocator(0.5))

current_formatter = ax.xaxis.get_major_formatter()
current_locator = ax.xaxis.get_major_locator()
print(f"Current x-axis formatter: {type(current_formatter)}")
print(f"Current x-axis locator: {type(current_locator)}")

plt.title("how2matplotlib.com - Formatter and Locator Example")
plt.grid(which='both', linestyle='--', alpha=0.7)
plt.show()
Output:
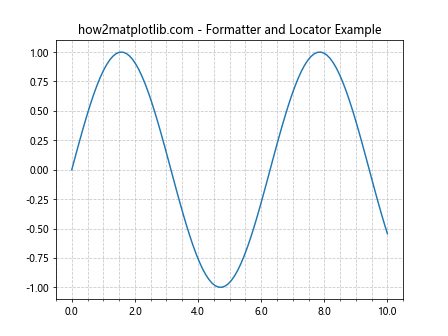
在这个例子中,我们使用MultipleLocator来设置主刻度和次刻度的间隔,并使用FormatStrFormatter来格式化主刻度的标签。这种组合可以精确控制刻度的位置和显示方式。
12. 在3D图中使用格式化器
Matplotlib也支持3D图形,你可以为3D图的每个轴设置格式化器。让我们看一个例子:
import matplotlib.pyplot as plt
import numpy as np
from mpl_toolkits.mplot3d import Axes3D
from matplotlib.ticker import FuncFormatter

def custom_formatter(x, pos):
    return f"[{x:.1f}]"

fig = plt.figure(figsize=(10, 8))
ax = fig.add_subplot(111, projection='3d')

x = np.linspace(-5, 5, 100)
y = np.linspace(-5, 5, 100)
X, Y = np.meshgrid(x, y)
Z = np.sin(np.sqrt(X**2 + Y**2))

surf = ax.plot_surface(X, Y, Z, cmap='viridis')

for axis in [ax.xaxis, ax.yaxis, ax.zaxis]:
    axis.set_major_formatter(FuncFormatter(custom_formatter))

current_formatter = ax.zaxis.get_major_formatter()
print(f"Current z-axis formatter: {type(current_formatter)}")

plt.title("how2matplotlib.com - 3D Plot Formatter Example")
plt.show()
Output:
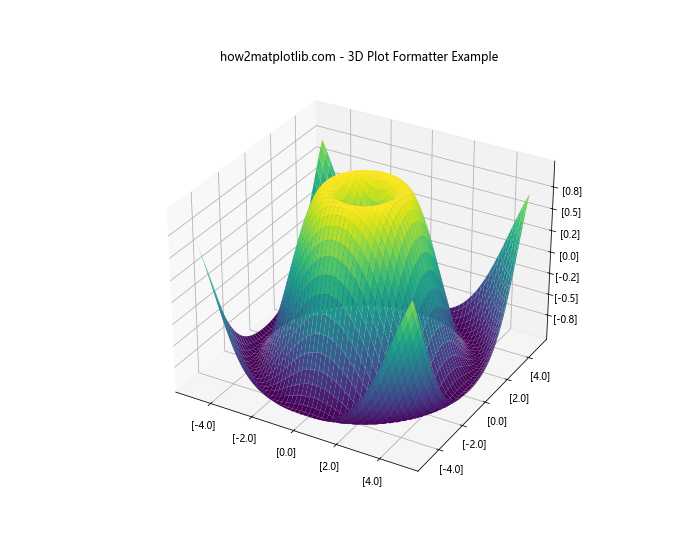
在这个例子中,我们创建了一个3D表面图,并为所有三个轴设置了相同的自定义格式化器。这展示了格式化器在3D图形中的应用。
13. 格式化器与颜色映射的结合
在某些情况下,你可能想要根据数据值来改变刻度标签的颜色。虽然格式化器主要负责文本格式,但我们可以结合使用格式化器和自定义刻度来实现这一效果。让我们看一个例子:
import matplotlib.pyplot as plt
import numpy as np
from matplotlib.ticker import FuncFormatter
import matplotlib.colors as mcolors

def color_formatter(x, pos):
    if x < 0:
        color = 'red'
    elif x > 0:
        color = 'green'
    else:
        color = 'black'
    return f'\\color{{{color}}}{{{x:.1f}}}'

x = np.linspace(-5, 5, 100)
y = x ** 2

fig, ax = plt.subplots()
ax.plot(x, y)

ax.xaxis.set_major_formatter(FuncFormatter(color_formatter))

current_formatter = ax.xaxis.get_major_formatter()
print(f"Current x-axis formatter: {type(current_formatter)}")

plt.title("how2matplotlib.com - Colored Formatter Example")
plt.show()
在这个例子中,我们创建了一个自定义格式化器,它根据x值的正负来设置刻度标签的颜色。这种技术可以用来强调特定范围的数据。
14. 在动画中使用格式化器
当创建动画图表时,你可能需要动态更新格式化器。让我们看一个简单的动画例子,其中格式化器随时间变化:
import matplotlib.pyplot as plt
import numpy as np
from matplotlib.animation import FuncAnimation
from matplotlib.ticker import FuncFormatter

fig, ax = plt.subplots()
x = np.linspace(0, 2*np.pi, 100)
line, = ax.plot(x, np.sin(x))

def update(frame):
    y = np.sin(x + frame / 10)
    line.set_ydata(y)

    def formatter(x, pos):
        return f"T={frame:.1f}: {x:.2f}"

    ax.yaxis.set_major_formatter(FuncFormatter(formatter))
    return line,

ani = FuncAnimation(fig, update, frames=np.linspace(0, 20, 100),
                    interval=50, blit=True)

plt.title("how2matplotlib.com - Animated Formatter Example")
plt.show()
Output:
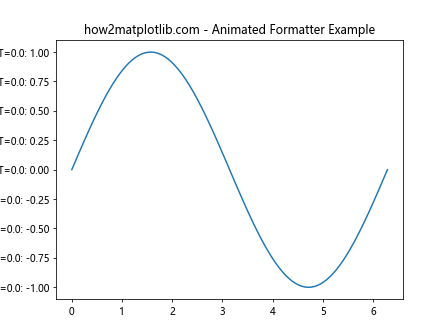
在这个例子中,我们创建了一个简单的正弦波动画,y轴的格式化器随每一帧更新,显示当前的时间和y值。
15. 处理非数值数据的格式化
虽然Matplotlib主要用于数值数据的可视化,但有时你可能需要处理非数值数据。在这种情况下,自定义格式化器可能特别有用。让我们看一个例子:
import matplotlib.pyplot as plt
import numpy as np
from matplotlib.ticker import FuncFormatter

categories = ['A', 'B', 'C', 'D', 'E']
values = [3, 7, 2, 9, 4]

fig, ax = plt.subplots()
ax.bar(range(len(categories)), values)

def category_formatter(x, pos):
    if x < 0 or x >= len(categories):
        return ''
    return categories[int(x)]

ax.xaxis.set_major_formatter(FuncFormatter(category_formatter))
ax.xaxis.set_major_locator(plt.FixedLocator(range(len(categories))))

current_formatter = ax.xaxis.get_major_formatter()
print(f"Current x-axis formatter: {type(current_formatter)}")

plt.title("how2matplotlib.com - Category Formatter Example")
plt.show()
Output:
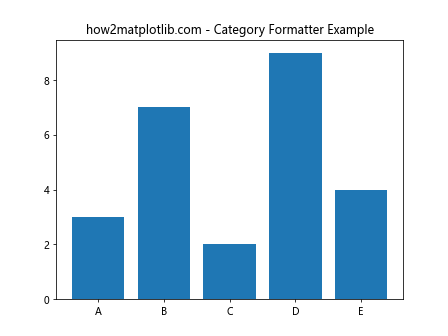
在这个例子中,我们创建了一个条形图,x轴表示不同的类别。我们使用自定义格式化器将数值索引转换为相应的类别名称。
16. 格式化器的错误处理
在使用自定义格式化器时,处理可能出现的错误很重要。让我们看一个包含错误处理的格式化器例子:
import matplotlib.pyplot as plt
import numpy as np
from matplotlib.ticker import FuncFormatter

def safe_formatter(x, pos):
    try:
        if x < 0:
            return f"({abs(x):.1f})"
        return f"{x:.1f}"
    except Exception as e:
        print(f"Error in formatter: {e}")
        return "ERR"

x = np.linspace(-5, 5, 100)
y = x ** 2

fig, ax = plt.subplots()
ax.plot(x, y)

ax.xaxis.set_major_formatter(FuncFormatter(safe_formatter))

current_formatter = ax.xaxis.get_major_formatter()
print(f"Current x-axis formatter: {type(current_formatter)}")

plt.title("how2matplotlib.com - Safe Formatter Example")
plt.show()
Output:
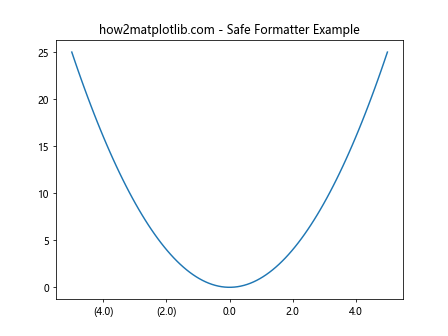
在这个例子中,我们的格式化器包含了错误处理逻辑。如果在格式化过程中发生任何错误,它会打印错误信息并返回”ERR”作为标签。这可以防止因格式化错误而导致的图表渲染失败。
结论
Matplotlib的Axis.get_major_formatter()函数是一个强大的工具,它允许你检查和修改图表轴的主刻度格式化器。通过本文的详细介绍和丰富的示例,我们探讨了如何使用这个函数来获取当前的格式化器,以及如何结合各种格式化器类型来自定义刻度标签的显示方式。
从基本的数值格式化到处理日期、时间和对数刻度,再到创建自定义格式化器,我们涵盖了广泛的应用场景。我们还讨论了格式化器与定位器的配合使用、在3D图和动画中的应用,以及处理非数值数据和错误情况的方法。
通过掌握这些技巧,你可以大大提高Matplotlib图表的可读性和美观性,使你的数据可视化更加专业和有效。记住,好的数据可视化不仅仅是展示数据,更是讲述数据背后的故事。合理使用格式化器可以帮助你更好地传达这个故事。
在实际应用中,根据你的具体需求和数据特性选择合适的格式化器,并不断实验和调整,以达到最佳的视觉效果。同时,也要注意在处理大量数据时的性能问题,选择高效的格式化方法。
最后,Matplotlib的文档是一个宝贵的资源,当你遇到特定问题或需要更深入了解某个功能时,不要忘记查阅官方文档。通过不断学习和实践,你将能够充分利用Matplotlib的强大功能,创造出令人印象深刻的数据可视化作品。
 极客笔记
极客笔记