Matplotlib中的Axis.get_gid()函数:获取图形元素的组标识符
参考:Matplotlib.axis.Axis.get_gid() function in Python
Matplotlib是Python中最流行的数据可视化库之一,它提供了丰富的绘图功能和自定义选项。在Matplotlib中,Axis.get_gid()函数是一个重要的方法,用于获取轴对象的组标识符(Group ID)。本文将深入探讨这个函数的用法、特点和应用场景,帮助你更好地理解和使用它。
1. Axis.get_gid()函数简介
Axis.get_gid()是Matplotlib库中axis.Axis类的一个方法。这个函数用于获取轴对象的组标识符(GID)。组标识符是一个字符串,用于唯一标识图形中的特定元素或元素组。通过使用GID,我们可以更方便地管理和操作图形中的不同部分。
以下是一个简单的示例,展示了如何使用Axis.get_gid()函数:
import matplotlib.pyplot as plt

fig, ax = plt.subplots()
ax.set_title("how2matplotlib.com Example")
ax.xaxis.set_gid("x_axis_gid")
ax.yaxis.set_gid("y_axis_gid")

x_gid = ax.xaxis.get_gid()
y_gid = ax.yaxis.get_gid()

print(f"X-axis GID: {x_gid}")
print(f"Y-axis GID: {y_gid}")

plt.show()
Output:
在这个例子中,我们首先为x轴和y轴设置了GID,然后使用get_gid()方法获取这些GID。这个示例展示了如何为轴对象设置和获取GID。
2. Axis.get_gid()函数的工作原理
Axis.get_gid()函数的工作原理相对简单。当调用这个方法时,它会返回之前通过set_gid()方法设置的组标识符。如果没有设置过GID,则返回None。
让我们通过一个更详细的例子来理解这个过程:
import matplotlib.pyplot as plt

fig, ax = plt.subplots()
ax.set_title("how2matplotlib.com GID Example")

# 初始状态下,GID为None
print(f"Initial X-axis GID: {ax.xaxis.get_gid()}")

# 设置X轴的GID
ax.xaxis.set_gid("x_axis_custom_gid")

# 获取设置后的GID
print(f"X-axis GID after setting: {ax.xaxis.get_gid()}")

# 再次设置GID
ax.xaxis.set_gid("new_x_axis_gid")

# 获取更新后的GID
print(f"X-axis GID after updating: {ax.xaxis.get_gid()}")

plt.show()
Output:
在这个例子中,我们首先检查初始状态下的GID,然后设置一个GID,再次获取它,最后更新GID并再次获取。这个过程展示了get_gid()函数如何与set_gid()函数配合使用。
3. Axis.get_gid()函数的应用场景
Axis.get_gid()函数在多种场景下都非常有用。以下是一些常见的应用场景:
3.1 识别和管理多个轴
当你的图形包含多个子图或轴时,使用GID可以帮助你更容易地识别和管理这些元素。例如:
import matplotlib.pyplot as plt

fig, (ax1, ax2) = plt.subplots(1, 2, figsize=(10, 4))
fig.suptitle("how2matplotlib.com Multiple Axes Example")

ax1.set_title("Subplot 1")
ax2.set_title("Subplot 2")

ax1.xaxis.set_gid("subplot1_xaxis")
ax2.xaxis.set_gid("subplot2_xaxis")

print(f"Subplot 1 X-axis GID: {ax1.xaxis.get_gid()}")
print(f"Subplot 2 X-axis GID: {ax2.xaxis.get_gid()}")

plt.show()
Output:
在这个例子中,我们为两个子图的x轴设置了不同的GID,然后使用get_gid()获取这些GID。这样可以帮助我们在处理复杂图形时更容易地区分和操作不同的轴。
3.2 自定义样式和格式化
GID可以用于为特定的轴应用自定义样式或格式化。例如:
import matplotlib.pyplot as plt

fig, ax = plt.subplots()
ax.set_title("how2matplotlib.com Custom Styling Example")

ax.xaxis.set_gid("custom_xaxis")
ax.yaxis.set_gid("custom_yaxis")

# 应用自定义样式
if ax.xaxis.get_gid() == "custom_xaxis":
    ax.xaxis.label.set_color('red')
    ax.xaxis.label.set_fontweight('bold')

if ax.yaxis.get_gid() == "custom_yaxis":
    ax.yaxis.label.set_color('blue')
    ax.yaxis.label.set_fontsize(14)

ax.set_xlabel("X-axis")
ax.set_ylabel("Y-axis")

plt.show()
Output:
在这个例子中,我们根据轴的GID来应用不同的样式。这种方法可以让你更灵活地控制图形的外观。
3.3 动态更新图形元素
GID还可以用于在动态更新图形时识别特定的元素。例如:
import matplotlib.pyplot as plt
import numpy as np

fig, ax = plt.subplots()
ax.set_title("how2matplotlib.com Dynamic Update Example")

line, = ax.plot([], [], 'r-')
line.set_gid("dynamic_line")

def update_line(num, line):
    if line.get_gid() == "dynamic_line":
        x = np.linspace(0, 10, 100)
        y = np.sin(x + num/10.0)
        line.set_data(x, y)
    return line,

for i in range(50):
    update_line(i, line)
    plt.pause(0.1)

plt.show()
Output:
在这个例子中,我们使用GID来识别需要动态更新的线条。这种方法在创建动画或交互式图形时特别有用。
4. Axis.get_gid()函数的高级用法
除了基本用法外,Axis.get_gid()函数还有一些高级用法,可以帮助你更好地组织和管理复杂的图形。
4.1 结合其他Matplotlib函数使用
get_gid()函数可以与其他Matplotlib函数结合使用,以实现更复杂的功能。例如,我们可以结合plt.gca()(获取当前轴)和get_gid()来操作特定的轴:
import matplotlib.pyplot as plt

fig, (ax1, ax2) = plt.subplots(1, 2, figsize=(10, 4))
fig.suptitle("how2matplotlib.com Advanced GID Usage")

ax1.set_title("Subplot 1")
ax2.set_title("Subplot 2")

ax1.set_gid("subplot1")
ax2.set_gid("subplot2")

def modify_axis(gid):
    for ax in fig.axes:
        if ax.get_gid() == gid:
            ax.set_facecolor('lightgray')
            ax.set_title(f"Modified {gid}", color='red')

modify_axis("subplot1")

plt.show()
Output:
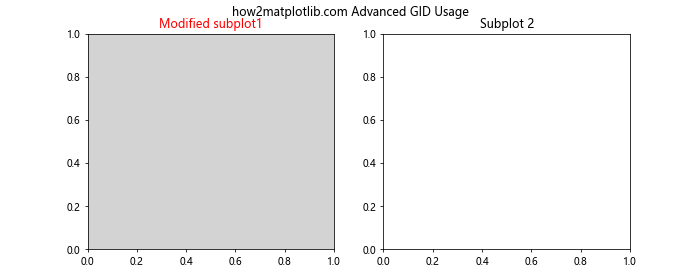
在这个例子中,我们定义了一个函数来修改具有特定GID的轴的属性。这种方法可以让你更灵活地管理复杂图形中的不同部分。
4.2 使用GID进行选择性导出
GID还可以用于在导出图形时选择性地包含或排除某些元素。例如:
import matplotlib.pyplot as plt
import io

fig, (ax1, ax2) = plt.subplots(1, 2, figsize=(10, 4))
fig.suptitle("how2matplotlib.com Selective Export Example")

ax1.set_title("Subplot 1")
ax2.set_title("Subplot 2")

ax1.set_gid("export_this")
ax2.set_gid("do_not_export")

# 创建一个自定义的保存函数
def custom_savefig(fig, filename, export_gid):
    for ax in fig.axes:
        if ax.get_gid() != export_gid:
            ax.set_visible(False)

    buf = io.BytesIO()
    fig.savefig(buf, format='png')
    buf.seek(0)

    # 恢复所有轴的可见性
    for ax in fig.axes:
        ax.set_visible(True)

    return buf

# 只导出带有"export_this" GID的子图
exported_image = custom_savefig(fig, "exported_subplot.png", "export_this")

plt.show()
Output:
在这个例子中,我们创建了一个自定义的保存函数,它只导出具有特定GID的子图。这种方法在你需要从复杂图形中提取特定部分时非常有用。
4.3 使用GID进行交互式操作
GID还可以用于实现图形的交互式操作。例如,我们可以使用GID来创建一个简单的交互式图例:
import matplotlib.pyplot as plt
import numpy as np

fig, ax = plt.subplots()
ax.set_title("how2matplotlib.com Interactive Legend Example")

x = np.linspace(0, 10, 100)
line1, = ax.plot(x, np.sin(x), label='Sin')
line2, = ax.plot(x, np.cos(x), label='Cos')

line1.set_gid("sin_line")
line2.set_gid("cos_line")

legend = ax.legend()

def on_pick(event):
    legend = event.artist
    isVisible = legend.get_visible()

    for line in ax.lines:
        if line.get_label() == legend.get_text():
            if line.get_gid() in ["sin_line", "cos_line"]:
                line.set_visible(not isVisible)

    legend.set_visible(not isVisible)
    fig.canvas.draw()

for legline in legend.get_lines():
    legline.set_picker(5)  # 5 points tolerance

fig.canvas.mpl_connect('pick_event', on_pick)

plt.show()
Output:
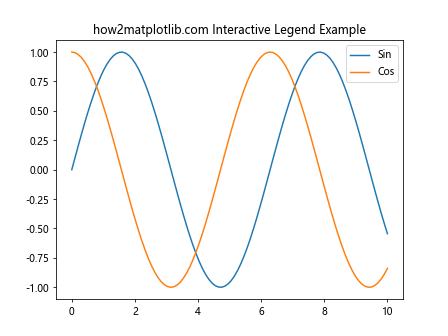
在这个例子中,我们使用GID来识别不同的线条,并在用户点击图例时切换它们的可见性。这种方法可以创建更加交互式和动态的图形。
5. Axis.get_gid()函数的注意事项和最佳实践
在使用Axis.get_gid()函数时,有一些注意事项和最佳实践需要考虑:
5.1 GID的唯一性
确保为每个需要单独识别的元素设置唯一的GID。重复的GID可能会导致混淆和错误。例如:
import matplotlib.pyplot as plt

fig, (ax1, ax2, ax3) = plt.subplots(1, 3, figsize=(15, 4))
fig.suptitle("how2matplotlib.com GID Uniqueness Example")

ax1.set_title("Subplot 1")
ax2.set_title("Subplot 2")
ax3.set_title("Subplot 3")

ax1.set_gid("unique_gid_1")
ax2.set_gid("unique_gid_2")
ax3.set_gid("unique_gid_3")

for ax in fig.axes:
    print(f"Subplot GID: {ax.get_gid()}")

plt.show()
Output:

在这个例子中,我们为每个子图设置了唯一的GID,这样可以确保我们可以准确地识别和操作每个子图。
5.2 合理命名GID
选择有意义和描述性的GID名称可以提高代码的可读性和可维护性。例如:
import matplotlib.pyplot as plt
import numpy as np

fig, ax = plt.subplots()
ax.set_title("how2matplotlib.com Descriptive GID Example")

x = np.linspace(0, 10, 100)
sin_line, = ax.plot(x, np.sin(x), label='Sin')
cos_line, = ax.plot(x, np.cos(x), label='Cos')

sin_line.set_gid("sine_wave_plot")
cos_line.set_gid("cosine_wave_plot")

print(f"Sin line GID: {sin_line.get_gid()}")
print(f"Cos line GID: {cos_line.get_gid()}")

plt.legend()
plt.show()
Output:
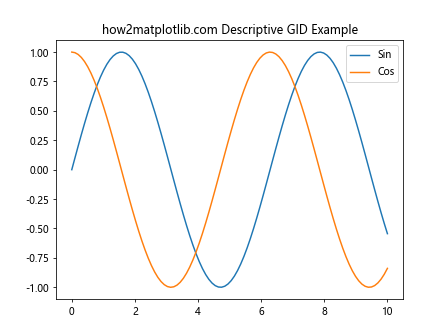
在这个例子中,我们使用描述性的GID名称来标识不同的线条,这使得代码更容易理解和维护。
5.3 避免过度使用GID
虽然GID很有用,但不应该过度使用。只为那些真正需要单独识别或操作的元素设置GID。例如:
import matplotlib.pyplot as plt
import numpy as np

fig, ax = plt.subplots()
ax.set_title("how2matplotlib.com Selective GID Usage")

x = np.linspace(0, 10, 100)
main_plot, = ax.plot(x, np.sin(x), label='Main Plot')
reference_line = ax.axhline(y=0, color='r', linestyle='--')

main_plot.set_gid("main_sine_plot")
reference_line.set_gid("zero_reference_line")

# 不需要为每个刻度设置GID
ax.set_xticks(np.arange0, 11, 2))
ax.set_yticks(np.arange(-1, 1.1, 0.5))

print(f"Main plot GID: {main_plot.get_gid()}")
print(f"Reference line GID: {reference_line.get_gid()}")
print(f"X-axis GID: {ax.xaxis.get_gid()}")  # 这里不需要设置GID

plt.legend()
plt.show()
在这个例子中,我们只为主要的绘图元素设置了GID,而不是为每个细小的元素都设置GID。这种做法可以保持代码的简洁性和可管理性。
6. Axis.get_gid()函数与其他Matplotlib功能的集成
Axis.get_gid()函数可以与Matplotlib的其他功能无缝集成,以创建更复杂和强大的可视化。
6.1 与事件处理结合
GID可以与Matplotlib的事件处理系统结合使用,创建交互式图形。例如:
import matplotlib.pyplot as plt
import numpy as np

fig, ax = plt.subplots()
ax.set_title("how2matplotlib.com Interactive GID Example")

x = np.linspace(0, 10, 100)
line, = ax.plot(x, np.sin(x))
line.set_gid("interactive_line")

def on_click(event):
    if event.inaxes == ax:
        for artist in ax.get_children():
            if isinstance(artist, plt.Line2D) and artist.get_gid() == "interactive_line":
                color = np.random.rand(3,)
                artist.set_color(color)
                fig.canvas.draw_idle()

fig.canvas.mpl_connect('button_press_event', on_click)

plt.show()
Output:
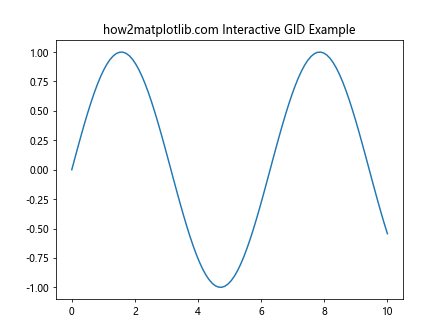
在这个例子中,我们使用GID来识别可以通过点击来改变颜色的线条。这种方法可以创建更加动态和交互式的图形。
6.2 与动画功能结合
GID还可以与Matplotlib的动画功能结合使用,创建复杂的动画效果:
import matplotlib.pyplot as plt
import matplotlib.animation as animation
import numpy as np

fig, ax = plt.subplots()
ax.set_title("how2matplotlib.com Animated GID Example")

x = np.linspace(0, 2*np.pi, 100)
line, = ax.plot(x, np.sin(x))
line.set_gid("animated_line")

def animate(frame):
    for artist in ax.get_children():
        if isinstance(artist, plt.Line2D) and artist.get_gid() == "animated_line":
            artist.set_ydata(np.sin(x + frame/10))
    return artist,

ani = animation.FuncAnimation(fig, animate, frames=100, interval=50, blit=True)

plt.show()
Output:
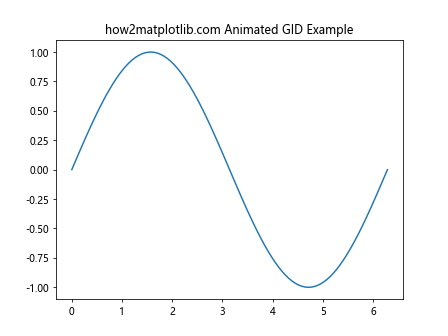
在这个例子中,我们使用GID来识别需要在动画中更新的线条。这种方法可以帮助我们在复杂的动画中精确控制特定元素。
6.3 与样式表结合
GID可以与Matplotlib的样式表功能结合使用,实现更灵活的样式控制:
import matplotlib.pyplot as plt
import numpy as np

plt.style.use('seaborn')

fig, (ax1, ax2) = plt.subplots(1, 2, figsize=(12, 5))
fig.suptitle("how2matplotlib.com GID with Style Sheets")

x = np.linspace(0, 10, 100)

ax1.plot(x, np.sin(x))
ax1.set_title("Default Style")
ax1.set_gid("default_style_plot")

ax2.plot(x, np.cos(x))
ax2.set_title("Custom Style")
ax2.set_gid("custom_style_plot")

# 应用自定义样式到特定GID的轴
for ax in fig.axes:
    if ax.get_gid() == "custom_style_plot":
        ax.set_facecolor('lightgray')
        ax.grid(True, linestyle='--', alpha=0.7)
        ax.spines['top'].set_visible(False)
        ax.spines['right'].set_visible(False)

plt.show()
在这个例子中,我们使用GID来识别需要应用自定义样式的轴,同时保持其他轴的默认样式。这种方法可以在一个图形中混合使用不同的样式。
7. Axis.get_gid()函数在大型项目中的应用
在大型数据可视化项目中,Axis.get_gid()函数可以发挥重要作用,帮助组织和管理复杂的图形结构。
7.1 模块化图形设计
使用GID可以帮助实现模块化的图形设计,使大型项目更易于管理:
import matplotlib.pyplot as plt
import numpy as np

def create_subplot(fig, position, title, gid):
    ax = fig.add_subplot(position)
    ax.set_title(title)
    ax.set_gid(gid)
    return ax

def plot_data(ax, x, y, label):
    line, = ax.plot(x, y, label=label)
    line.set_gid(f"{ax.get_gid()}_line")
    ax.legend()

fig = plt.figure(figsize=(15, 10))
fig.suptitle("how2matplotlib.com Modular Design Example")

x = np.linspace(0, 10, 100)

ax1 = create_subplot(fig, 221, "Sine Wave", "sine_plot")
plot_data(ax1, x, np.sin(x), "Sin(x)")

ax2 = create_subplot(fig, 222, "Cosine Wave", "cosine_plot")
plot_data(ax2, x, np.cos(x), "Cos(x)")

ax3 = create_subplot(fig, 223, "Tangent Wave", "tangent_plot")
plot_data(ax3, x, np.tan(x), "Tan(x)")

ax4 = create_subplot(fig, 224, "Exponential", "exp_plot")
plot_data(ax4, x, np.exp(x), "Exp(x)")

plt.tight_layout()
plt.show()
Output:
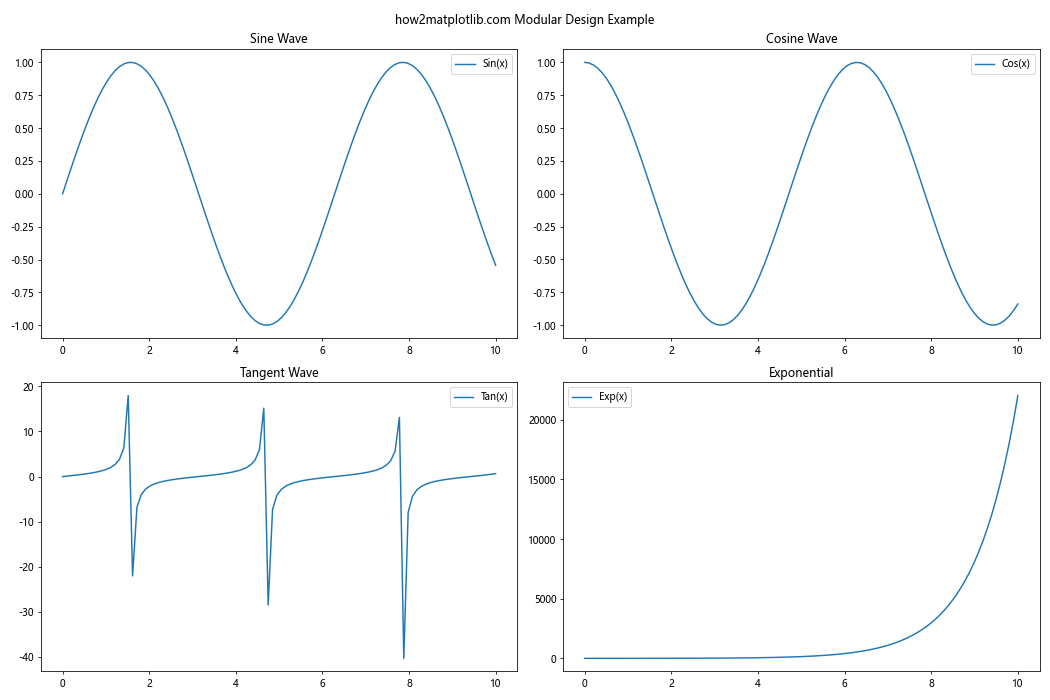
在这个例子中,我们使用函数来创建子图和绘制数据,每个元素都有唯一的GID。这种模块化的方法使得管理复杂图形变得更加容易。
7.2 动态图形生成
在需要动态生成大量图形的项目中,GID可以用于跟踪和管理不同的图形元素:
import matplotlib.pyplot as plt
import numpy as np

def generate_dynamic_plots(num_plots):
    fig = plt.figure(figsize=(15, 5 * ((num_plots + 1) // 2)))
    fig.suptitle("how2matplotlib.com Dynamic Plot Generation")

    for i in range(num_plots):
        ax = fig.add_subplot(((num_plots + 1) // 2), 2, i+1)
        ax.set_title(f"Plot {i+1}")
        ax.set_gid(f"dynamic_plot_{i}")

        x = np.linspace(0, 10, 100)
        y = np.sin(x + i)
        line, = ax.plot(x, y)
        line.set_gid(f"dynamic_line_{i}")

        print(f"Plot {i+1} GID: {ax.get_gid()}")
        print(f"Line {i+1} GID: {line.get_gid()}")

    plt.tight_layout()
    return fig

# 生成5个动态图
fig = generate_dynamic_plots(5)
plt.show()
这个例子展示了如何使用GID来管理动态生成的多个图形和线条。这种方法在需要根据数据动态生成大量图形的项目中特别有用。
7.3 图形元素的批量操作
GID可以用于在大型项目中进行图形元素的批量操作:
import matplotlib.pyplot as plt
import numpy as np

fig, axes = plt.subplots(2, 3, figsize=(15, 10))
fig.suptitle("how2matplotlib.com Batch Operations Example")

x = np.linspace(0, 10, 100)
functions = [np.sin, np.cos, np.tan, np.exp, np.log, np.sqrt]

for i, (ax, func) in enumerate(zip(axes.flatten(), functions)):
    ax.plot(x, func(x))
    ax.set_title(func.__name__)
    ax.set_gid(f"plot_{func.__name__}")

def batch_modify_axes(fig, gid_pattern, **kwargs):
    for ax in fig.axes:
        if ax.get_gid() and ax.get_gid().startswith(gid_pattern):
            for key, value in kwargs.items():
                getattr(ax, f"set_{key}")(value)

# 批量修改所有三角函数图的y轴范围
batch_modify_axes(fig, "plot_", ylim=(-2, 2))

# 批量修改所有指数和对数函数图的背景颜色
batch_modify_axes(fig, "plot_", facecolor='lightgray')

plt.tight_layout()
plt.show()
Output:
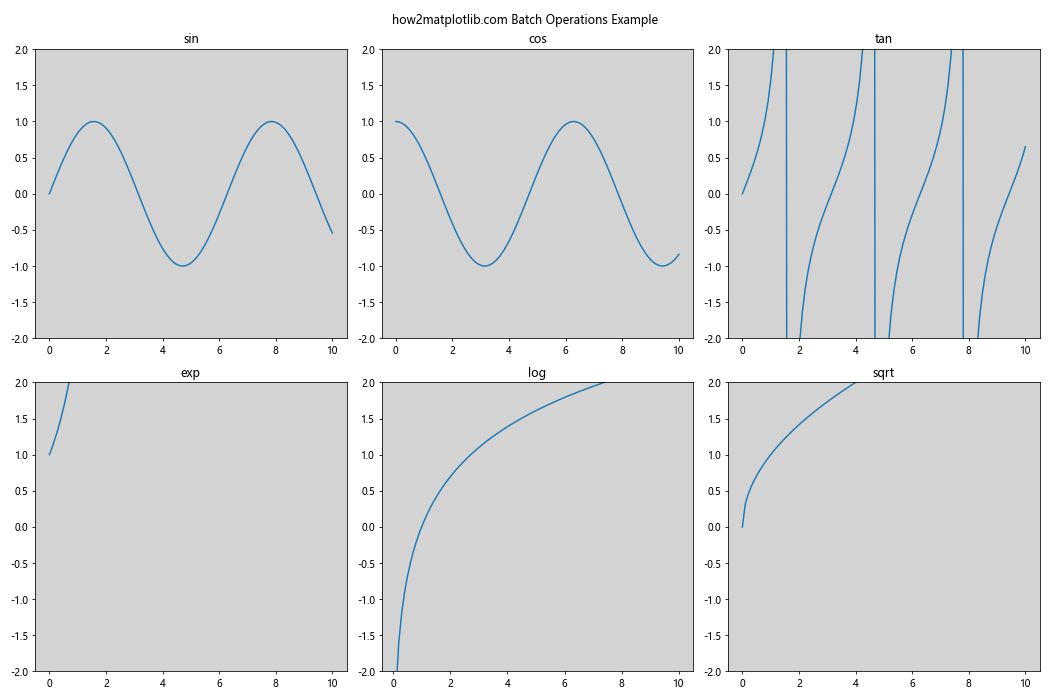
在这个例子中,我们使用GID来识别不同类型的图形,并对它们进行批量修改。这种方法可以大大简化大型项目中的图形管理和样式调整。
8. Axis.get_gid()函数的性能考虑
虽然Axis.get_gid()函数本身的性能开销很小,但在处理大量图形元素时,仍然需要考虑一些性能因素:
8.1 缓存GID值
如果你需要频繁访问某个元素的GID,考虑将其缓存起来,而不是每次都调用get_gid():
import matplotlib.pyplot as plt
import numpy as np
import time

fig, ax = plt.subplots()
ax.set_title("how2matplotlib.com GID Caching Example")

x = np.linspace(0, 10, 1000)
lines = [ax.plot(x, np.sin(x + i))[0] for i in range(100)]

for i, line in enumerate(lines):
    line.set_gid(f"line_{i}")

# 不使用缓存
start_time = time.time()
for _ in range(1000):
    for line in lines:
        gid = line.get_gid()
print(f"Time without caching: {time.time() - start_time:.4f} seconds")

# 使用缓存
start_time = time.time()
gid_cache = {line: line.get_gid() for line in lines}
for _ in range(1000):
    for line in lines:
        gid = gid_cache[line]
print(f"Time with caching: {time.time() - start_time:.4f} seconds")

plt.show()
Output:
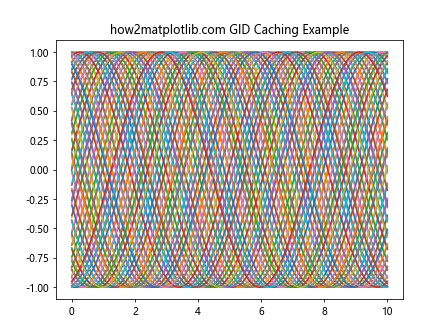
这个例子比较了使用缓存和不使用缓存时访问GID的性能差异。在处理大量元素时,缓存可以显著提高性能。
8.2 避免不必要的GID查询
在循环或频繁执行的代码中,避免不必要的GID查询:
import matplotlib.pyplot as plt
import numpy as np
import time

fig, ax = plt.subplots()
ax.set_title("how2matplotlib.com Optimized GID Usage")

x = np.linspace(0, 10, 1000)
lines = [ax.plot(x, np.sin(x + i))[0] for i in range(100)]

for i, line in enumerate(lines):
    line.set_gid(f"line_{i}")

def inefficient_update():
    start_time = time.time()
    for _ in range(1000):
        for line in lines:
            if line.get_gid().startswith("line_"):
                line.set_alpha(0.5)
    return time.time() - start_time

def efficient_update():
    start_time = time.time()
    for _ in range(1000):
        for line in lines:
            line.set_alpha(0.5)
    return time.time() - start_time

print(f"Inefficient update time: {inefficient_update():.4f} seconds")
print(f"Efficient update time: {efficient_update():.4f} seconds")

plt.show()
Output:
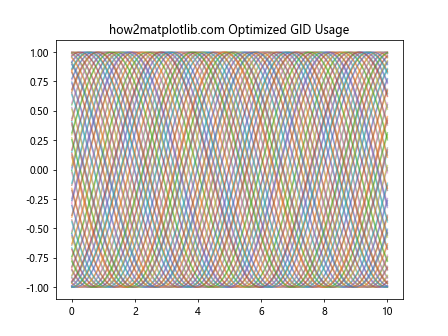
这个例子展示了如何通过避免不必要的GID查询来优化代码性能。在这种情况下,我们知道所有的线条都需要更新,所以不需要每次都检查GID。
9. Axis.get_gid()函数的替代方法
虽然Axis.get_gid()函数在许多情况下非常有用,但有时可能需要考虑其他方法来管理图形元素:
9.1 使用自定义属性
在某些情况下,使用自定义属性可能比GID更灵活:
import matplotlib.pyplot as plt
import numpy as np

fig, ax = plt.subplots()
ax.set_title("how2matplotlib.com Custom Attributes Example")

x = np.linspace(0, 10, 100)
line1, = ax.plot(x, np.sin(x), label='Sin')
line2, = ax.plot(x, np.cos(x), label='Cos')

line1.custom_type = "trigonometric"
line2.custom_type = "trigonometric"

def update_lines(line_type):
    for line in ax.lines:
        if hasattr(line, 'custom_type') and line.custom_type == line_type:
            line.set_linewidth(3)
            line.set_alpha(0.7)

update_lines("trigonometric")

plt.legend()
plt.show()
Output:
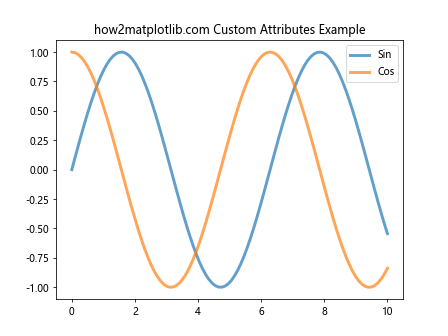
在这个例子中,我们使用自定义属性custom_type来标识和操作特定类型的线条。这种方法可以提供比GID更多的灵活性。
9.2 使用字典管理元素
对于复杂的图形,使用字典来管理元素可能比GID更有效:
import matplotlib.pyplot as plt
import numpy as np

fig, ax = plt.subplots()
ax.set_title("how2matplotlib.comDictionary Management Example")

x = np.linspace(0, 10, 100)
elements = {
    'sin': ax.plot(x, np.sin(x), label='Sin')[0],
    'cos': ax.plot(x, np.cos(x), label='Cos')[0],
    'tan': ax.plot(x, np.tan(x), label='Tan')[0]
}

def update_element(key, **kwargs):
    if key in elements:
        for prop, value in kwargs.items():
            setattr(elements[key], f"set_{prop}", value)

update_element('sin', color='red', linewidth=2)
update_element('cos', linestyle='--', alpha=0.7)

plt.legend()
plt.show()
Output:
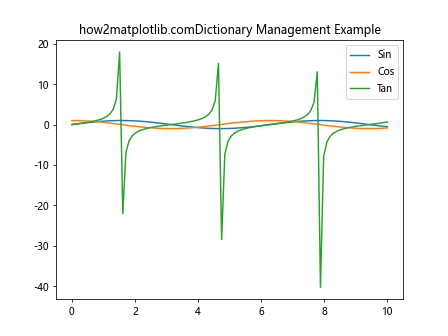
这个例子展示了如何使用字典来管理和更新图形元素,这种方法在某些情况下可能比使用GID更直观和高效。
10. Axis.get_gid()函数在不同Matplotlib版本中的变化
Axis.get_gid()函数在Matplotlib的不同版本中保持相对稳定,但了解版本之间的细微差异仍然很重要:
10.1 版本兼容性
以下是一个检查Axis.get_gid()函数在不同Matplotlib版本中行为的示例:
import matplotlib
import matplotlib.pyplot as plt

print(f"Matplotlib version: {matplotlib.__version__}")

fig, ax = plt.subplots()
ax.set_title("how2matplotlib.com Version Compatibility Check")

ax.xaxis.set_gid("x_axis_gid")
ax.yaxis.set_gid("y_axis_gid")

print(f"X-axis GID: {ax.xaxis.get_gid()}")
print(f"Y-axis GID: {ax.yaxis.get_gid()}")

# 检查是否存在潜在的新方法
if hasattr(ax.xaxis, 'get_gid_new'):
    print("New GID method found!")
else:
    print("No new GID methods detected.")

plt.show()
Output:
这个例子可以帮助你检查get_gid()函数在你当前使用的Matplotlib版本中的行为,并识别可能存在的新方法。
10.2 处理版本差异
如果你的项目需要在不同版本的Matplotlib上运行,可以考虑使用版本检查来处理潜在的差异:
import matplotlib
import matplotlib.pyplot as plt

def get_axis_gid(axis):
    if matplotlib.__version__ >= '3.0':
        return axis.get_gid()
    else:
        # 假设在旧版本中使用不同的方法
        return getattr(axis, '_gid', None)

fig, ax = plt.subplots()
ax.set_title("how2matplotlib.com Version Handling Example")

ax.xaxis.set_gid("x_axis_gid")
ax.yaxis.set_gid("y_axis_gid")

print(f"X-axis GID: {get_axis_gid(ax.xaxis)}")
print(f"Y-axis GID: {get_axis_gid(ax.yaxis)}")

plt.show()
Output:
这个例子展示了如何创建一个包装函数来处理不同版本的Matplotlib中可能存在的差异。这种方法可以提高代码的可移植性和兼容性。
结论
Axis.get_gid()函数是Matplotlib库中一个强大而灵活的工具,它允许开发者为图形元素分配和检索唯一的标识符。通过本文的详细探讨,我们了解了这个函数的基本用法、高级应用、性能考虑以及在大型项目中的应用。
从简单的元素识别到复杂的交互式图形设计,get_gid()函数在各种场景下都展现出了其实用性。它不仅可以帮助我们更好地组织和管理图形元素,还可以与Matplotlib的其他功能无缝集成,创建更加动态和交互式的可视化效果。
在使用get_gid()函数时,我们需要注意GID的唯一性、合理命名以及避免过度使用。同时,在处理大量图形元素时,还需要考虑性能优化,如缓存GID值和避免不必要的查询。
对于复杂的项目,get_gid()函数可以与其他技术结合使用,如模块化设计、动态图形生成和批量操作,以实现更高效的图形管理。
最后,虽然get_gid()函数在大多数情况下都很有用,但有时使用自定义属性或字典管理等替代方法可能更适合特定的需求。
通过深入理解和灵活运用Axis.get_gid()函数,开发者可以更好地控制和管理Matplotlib中的图形元素,从而创建出更加精确、高效和交互式的数据可视化作品。
 极客笔记
极客笔记