Matplotlib中使用axhline绘制水平线及其线型设置
参考:matplotlib axhline linestyles
Matplotlib是Python中最常用的数据可视化库之一,它提供了丰富的绘图功能。在数据分析和科学计算中,我们经常需要在图表中添加水平参考线来突出显示某些特定值或阈值。Matplotlib的axhline函数就是为此而设计的,它可以方便地在图表中绘制水平线。同时,通过设置不同的线型(linestyles),我们可以使这些水平线更具表现力和信息量。本文将详细介绍如何使用axhline函数绘制水平线,以及如何设置各种线型来增强图表的可读性和美观性。
1. axhline函数简介
axhline函数是Matplotlib中用于绘制水平线的专用函数。它的主要优点是可以轻松地在整个轴的宽度上绘制一条水平线,而不需要考虑x轴的具体数据范围。这在添加平均线、阈值线或其他参考线时特别有用。
基本语法
axhline函数的基本语法如下:
ax.axhline(y=0, xmin=0, xmax=1, **kwargs)
y:水平线的y轴位置xmin和xmax:水平线的起始和结束位置,以轴的比例表示(0到1之间)**kwargs:其他线条属性,如颜色、线型等
让我们看一个简单的例子:
import matplotlib.pyplot as plt

fig, ax = plt.subplots()
ax.set_title('How to use axhline - how2matplotlib.com')
ax.axhline(y=0.5, color='r', linestyle='--')
plt.show()
Output:
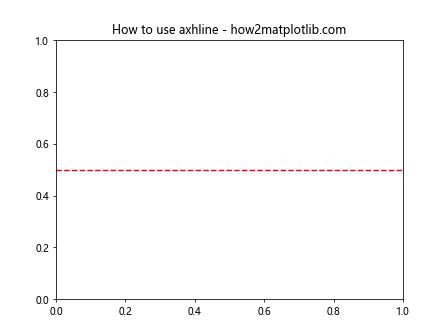
这个例子在y=0.5的位置绘制了一条红色虚线。
2. 设置水平线的位置和范围
axhline函数允许我们精确控制水平线的位置和范围。
2.1 指定y轴位置
我们可以通过y参数指定水平线的精确位置:
import matplotlib.pyplot as plt

fig, ax = plt.subplots()
ax.set_title('Axhline at different y positions - how2matplotlib.com')
ax.axhline(y=0.2, color='red', label='y=0.2')
ax.axhline(y=0.5, color='green', label='y=0.5')
ax.axhline(y=0.8, color='blue', label='y=0.8')
ax.legend()
plt.show()
Output:
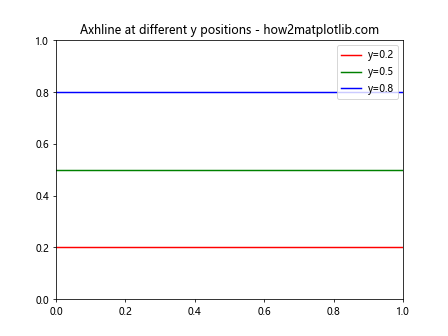
这个例子在不同的y轴位置绘制了三条水平线。
2.2 设置水平线的范围
使用xmin和xmax参数,我们可以控制水平线的起始和结束位置:
import matplotlib.pyplot as plt

fig, ax = plt.subplots()
ax.set_title('Axhline with different ranges - how2matplotlib.com')
ax.axhline(y=0.2, xmin=0, xmax=0.5, color='red', label='Half width')
ax.axhline(y=0.5, xmin=0.25, xmax=0.75, color='green', label='Center half')
ax.axhline(y=0.8, xmin=0.5, xmax=1, color='blue', label='Right half')
ax.legend()
plt.show()
Output:
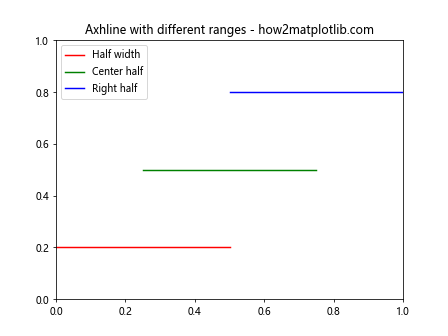
这个例子展示了如何绘制不同长度和位置的水平线。
3. 线型(Linestyles)设置
Matplotlib提供了多种线型选项,可以通过linestyle或ls参数来设置。常用的线型包括实线、虚线、点线等。
3.1 基本线型
以下是一些基本线型的示例:
import matplotlib.pyplot as plt

fig, ax = plt.subplots()
ax.set_title('Basic linestyles - how2matplotlib.com')
ax.axhline(y=0.2, color='red', linestyle='-', label='Solid')
ax.axhline(y=0.4, color='green', linestyle='--', label='Dashed')
ax.axhline(y=0.6, color='blue', linestyle=':', label='Dotted')
ax.axhline(y=0.8, color='purple', linestyle='-.', label='Dash-dot')
ax.legend()
plt.show()
Output:
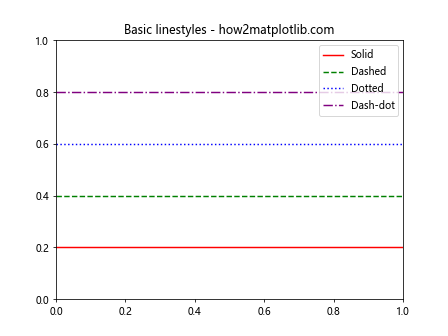
这个例子展示了四种基本线型:实线、虚线、点线和点划线。
3.2 使用线型简写
Matplotlib还支持使用简写来指定线型:
import matplotlib.pyplot as plt

fig, ax = plt.subplots()
ax.set_title('Linestyle shortcuts - how2matplotlib.com')
ax.axhline(y=0.2, color='red', ls='-', label='Solid (-)')
ax.axhline(y=0.4, color='green', ls='--', label='Dashed (--)')
ax.axhline(y=0.6, color='blue', ls=':', label='Dotted (:)')
ax.axhline(y=0.8, color='purple', ls='-.', label='Dash-dot (-.)')
ax.legend()
plt.show()
Output:
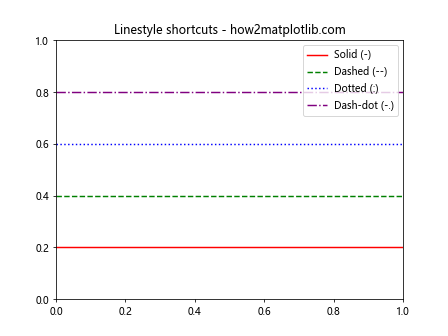
这个例子使用了线型的简写形式,效果与前一个例子相同。
3.3 自定义线型
除了预定义的线型,我们还可以使用更复杂的自定义线型:
import matplotlib.pyplot as plt

fig, ax = plt.subplots()
ax.set_title('Custom linestyles - how2matplotlib.com')
ax.axhline(y=0.2, color='red', linestyle=(0, (5, 5)), label='Equal on/off')
ax.axhline(y=0.4, color='green', linestyle=(0, (5, 1)), label='Long on, short off')
ax.axhline(y=0.6, color='blue', linestyle=(0, (1, 1)), label='Dotted')
ax.axhline(y=0.8, color='purple', linestyle=(0, (3, 5, 1, 5)), label='Dash-dot')
ax.legend()
plt.show()
Output:
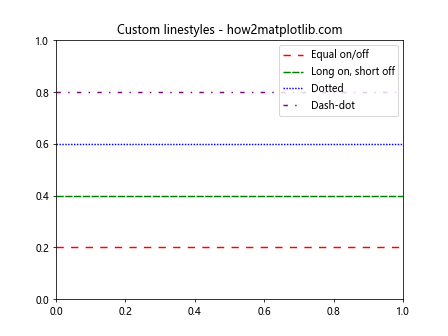
在这个例子中,我们使用元组来定义自定义线型。元组中的数字表示线段的长度和间隔。
4. 结合其他线条属性
除了线型,我们还可以设置其他线条属性来进一步自定义水平线的外观。
4.1 设置线宽
使用linewidth或lw参数可以调整线条的粗细:
import matplotlib.pyplot as plt

fig, ax = plt.subplots()
ax.set_title('Axhline with different linewidths - how2matplotlib.com')
ax.axhline(y=0.2, color='red', linewidth=1, label='1px')
ax.axhline(y=0.4, color='green', linewidth=2, label='2px')
ax.axhline(y=0.6, color='blue', linewidth=4, label='4px')
ax.axhline(y=0.8, color='purple', linewidth=6, label='6px')
ax.legend()
plt.show()
Output:
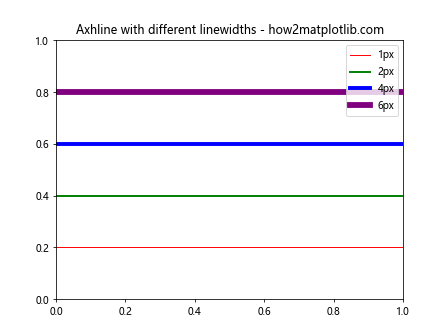
这个例子展示了不同线宽的水平线。
4.2 设置透明度
使用alpha参数可以调整线条的透明度:
import matplotlib.pyplot as plt

fig, ax = plt.subplots()
ax.set_title('Axhline with different alpha values - how2matplotlib.com')
ax.axhline(y=0.2, color='red', alpha=1.0, label='Alpha 1.0')
ax.axhline(y=0.4, color='green', alpha=0.7, label='Alpha 0.7')
ax.axhline(y=0.6, color='blue', alpha=0.4, label='Alpha 0.4')
ax.axhline(y=0.8, color='purple', alpha=0.1, label='Alpha 0.1')
ax.legend()
plt.show()
Output:
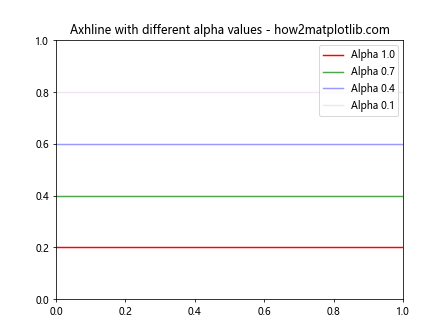
这个例子展示了不同透明度的水平线。
5. 在实际图表中应用axhline
让我们看看如何在实际的数据可视化中应用axhline。
5.1 添加平均线
在散点图中添加平均线是一个常见的需求:
import matplotlib.pyplot as plt
import numpy as np

np.random.seed(42)
x = np.linspace(0, 10, 100)
y = np.sin(x) + np.random.normal(0, 0.1, 100)

fig, ax = plt.subplots()
ax.scatter(x, y, alpha=0.5)
ax.axhline(y=np.mean(y), color='r', linestyle='--', label='Mean')
ax.set_title('Scatter plot with mean line - how2matplotlib.com')
ax.legend()
plt.show()
Output:
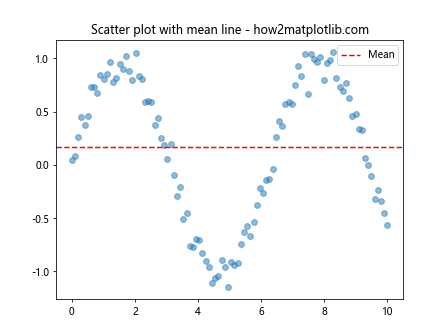
这个例子在散点图中添加了一条表示平均值的红色虚线。
5.2 添加阈值线
在某些情况下,我们可能需要在图表中添加阈值线:
import matplotlib.pyplot as plt
import numpy as np

np.random.seed(42)
x = np.linspace(0, 10, 100)
y = np.sin(x) + np.random.normal(0, 0.1, 100)

fig, ax = plt.subplots()
ax.plot(x, y)
ax.axhline(y=0.5, color='g', linestyle='--', label='Upper threshold')
ax.axhline(y=-0.5, color='r', linestyle='--', label='Lower threshold')
ax.set_title('Line plot with threshold lines - how2matplotlib.com')
ax.legend()
plt.show()
Output:
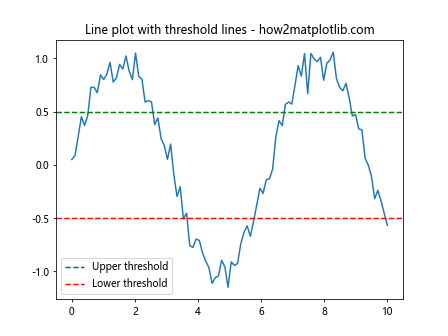
这个例子在线图中添加了上下两条阈值线。
6. 结合axvline使用
axhline通常与axvline(用于绘制垂直线)结合使用,以创建参考网格或突出显示特定区域。
6.1 创建十字准线
import matplotlib.pyplot as plt

fig, ax = plt.subplots()
ax.set_title('Crosshair using axhline and axvline - how2matplotlib.com')
ax.axhline(y=0.5, color='r', linestyle='--')
ax.axvline(x=0.5, color='b', linestyle='--')
plt.show()
Output:
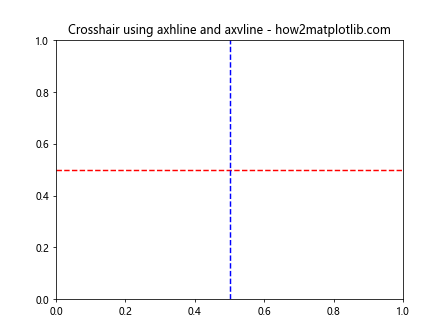
这个例子创建了一个简单的十字准线。
6.2 突出显示特定区域
import matplotlib.pyplot as plt
import numpy as np

x = np.linspace(0, 10, 100)
y = np.sin(x)

fig, ax = plt.subplots()
ax.plot(x, y)
ax.axhline(y=0.5, xmin=0.3, xmax=0.7, color='r', linestyle='--')
ax.axvline(x=3, ymin=0.2, ymax=0.8, color='g', linestyle='--')
ax.set_title('Highlighting areas with axhline and axvline - how2matplotlib.com')
plt.show()
Output:
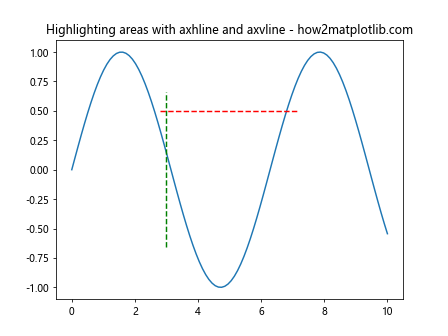
这个例子使用axhline和axvline突出显示了图表中的特定区域。
7. 在子图中使用axhline
当我们使用子图时,axhline可以应用于单个子图或所有子图。
7.1 在单个子图中使用axhline
import matplotlib.pyplot as plt
import numpy as np

fig, (ax1, ax2) = plt.subplots(2, 1, figsize=(8, 6))
x = np.linspace(0, 10, 100)

ax1.plot(x, np.sin(x))
ax1.axhline(y=0, color='r', linestyle='--')
ax1.set_title('Subplot 1 with axhline - how2matplotlib.com')

ax2.plot(x, np.cos(x))
ax2.set_title('Subplot 2 without axhline - how2matplotlib.com')

plt.tight_layout()
plt.show()
Output:
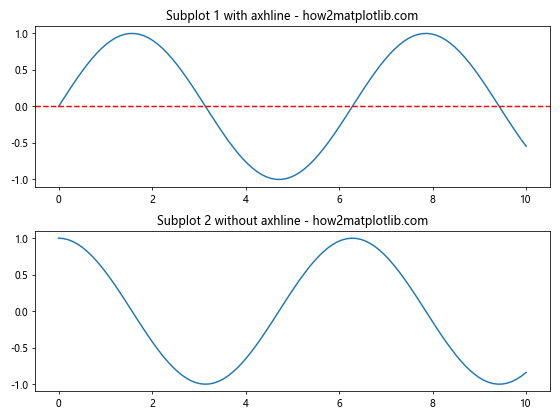
这个例子在两个子图中,只在第一个子图中添加了水平线。
7.2 在所有子图中使用axhline
import matplotlib.pyplot as plt
import numpy as np

fig, (ax1, ax2) = plt.subplots(2, 1, figsize=(8, 6))
x = np.linspace(0, 10, 100)

ax1.plot(x, np.sin(x))
ax1.axhline(y=0, color='r', linestyle='--')
ax1.set_title('Subplot 1 with axhline - how2matplotlib.com')

ax2.plot(x, np.cos(x))
ax2.axhline(y=0, color='r', linestyle='--')
ax2.set_title('Subplot 2 with axhline - how2matplotlib.com')

plt.tight_layout()
plt.show()
Output:
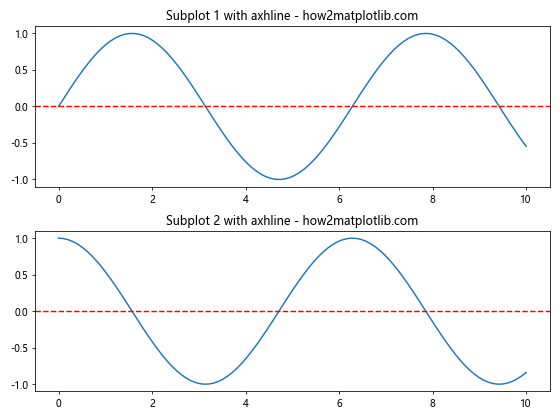
这个例子在两个子图中都添加了水平线。
8. 高级技巧和注意事项
在使用axhline和设置线型时,还有一些高级技巧和注意事项需要了解。
8.1 使用zorder控制线条层级
当图表中有多个元素时,可能会出现重叠。使用zorder参数可以控制元素的绘制顺序:
import matplotlib.pyplot as plt
import numpy as np

x = np.linspace(0, 10, 100)
y = np.sin(x)

fig, ax = plt.subplots()
ax.plot(x, y, zorder=1)
ax.axhline(y=0, color='r', linestyle='--', zorder=2)
ax.set_title('Controlling line order with zorder - how2matplotlib.com')
plt.show()
Output:
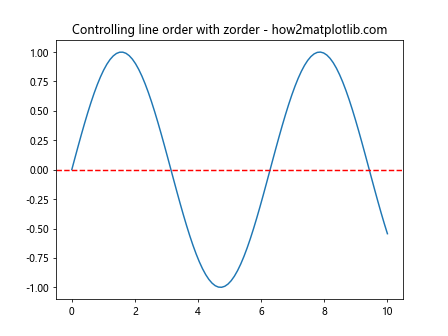
在这个例子中,水平线(zorder=2)会绘制在曲线(zorder=1)之上。
8.2 使用clip_on参数
默认情况下,axhline绘制的线条会被裁剪到轴的范围内。使用clip_on=False参数可以让线条延伸到轴的外部:
import matplotlib.pyplot as plt

fig, ax = plt.subplots()
ax.set_xlim(0, 1)
ax.set_ylim(0, 1)
ax.axhline(y=0.5, color='r', linestyle='--', clip_on=False)
ax.set_title('Axhline with clip_on=False - how2matplotlib.com')
plt.show()
Output:
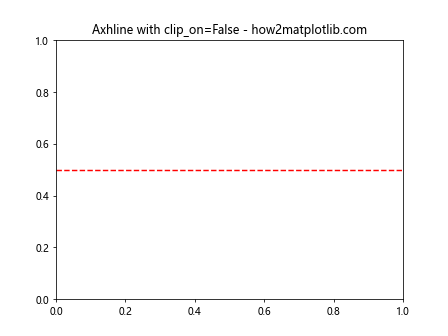
这个例子中的水平线会延伸到轴的外部。
8.3 结合transform使用
axhline默认使用数据坐标系。但我们可以结合transform参数使用不同的坐标系:
import matplotlib.pyplot as plt

fig, ax = plt.subplots()
ax.set_xlim(0, 10)
ax.set_ylim(0, 10)
ax.axhline(y=0.5, color='r', linestyle='--', transform=ax.figure.transFigure)
ax.set_title('Axhline with figure coordinates - how2matplotlib.com')
plt.show()
这个例子中的水平线使用图形坐标系,因此会在整个图形的50%高度处绘制。
9. 常见问题和解决方案
在使用axhline和设置线型时,可能会遇到一些常见问题。以下是一些问题及其解决方案:
9.1 线条不可见
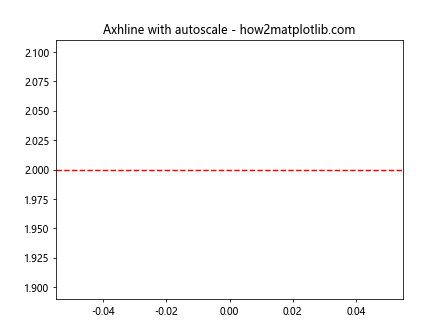
如果绘制的水平线不可见,可能是因为它超出了当前的y轴范围。解决方法是调整y轴的范围或使用autoscale:
import matplotlib.pyplot as plt

fig, ax = plt.subplots()
ax.set_ylim(0, 1)
ax.axhline(y=2, color='r', linestyle='--')
ax.autoscale()
ax.set_title('Axhline with autoscale - how2matplotlib.com')
plt.show()
Output:
9.2 线型在某些缩放级别下看起来不正确
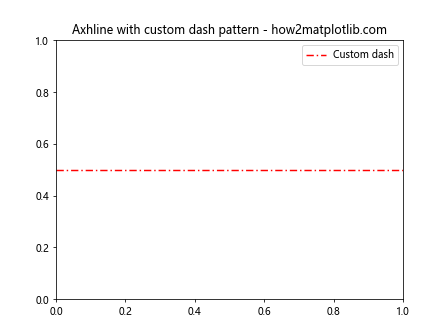
在某些缩放级别下,自定义线型可能看起来不正确。这是因为线型的定义是基于像素的。解决方法是使用dashes参数来定义基于点的线型:
import matplotlib.pyplot as plt

fig, ax = plt.subplots()
ax.axhline(y=0.5, color='r', dashes=[5, 2, 1, 2], label='Custom dash')
ax.set_title('Axhline with custom dash pattern - how2matplotlib.com')
ax.legend()
plt.show()
Output:
9.3 在对数刻度上使用axhline
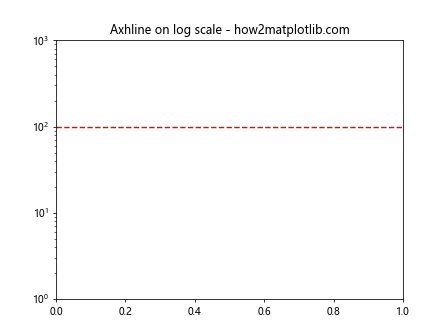
在对数刻度的轴上使用axhline时,可能需要调整y值:
import matplotlib.pyplot as plt
import numpy as np

fig, ax = plt.subplots()
ax.set_yscale('log')
ax.axhline(y=100, color='r', linestyle='--')
ax.set_ylim(1, 1000)
ax.set_title('Axhline on log scale - how2matplotlib.com')
plt.show()
Output:
10. 性能考虑
虽然axhline是一个非常有用的函数,但在处理大量数据或需要频繁更新的图表时,可能需要考虑性能问题。
10.1 使用Line2D对象
对于需要频繁更新的图表,使用Line2D对象可能会更高效:
import matplotlib.pyplot as plt
from matplotlib.lines import Line2D

fig, ax = plt.subplots()
line = Line2D([0, 1], [0.5, 0.5], transform=ax.transAxes, color='r', linestyle='--')
ax.add_line(line)
ax.set_title('Using Line2D for horizontal line - how2matplotlib.com')
plt.show()
Output:
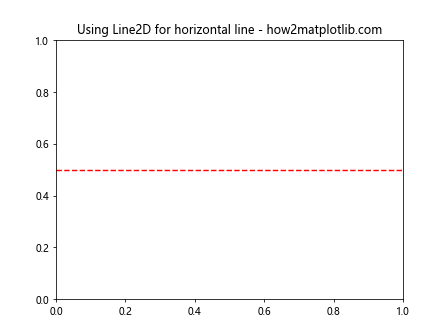
这种方法允许你直接操作线条对象,而不是每次都重新绘制。
10.2 批量绘制
如果需要绘制大量水平线,可以考虑使用vlines函数批量绘制:
import matplotlib.pyplot as plt
import numpy as np

fig, ax = plt.subplots()
y_positions = np.linspace(0, 1, 10)
ax.vlines(x=0, ymin=y_positions, ymax=y_positions, colors='r', linestyles='--', transform=ax.get_xaxis_transform())
ax.set_title('Multiple horizontal lines using vlines - how2matplotlib.com')
plt.show()
这个方法可以一次性绘制多条水平线,提高效率。
结论
Matplotlib的axhline函数是一个强大而灵活的工具,用于在图表中添加水平参考线。通过调整线型、颜色、宽度和其他属性,我们可以创建出既美观又信息丰富的可视化效果。无论是添加平均线、阈值线,还是创建复杂的参考网格,axhline都能满足各种需求。
在实际应用中,合理使用axhline可以大大提高图表的可读性和信息传递效率。同时,了解如何设置不同的线型可以让我们的图表更具表现力,更好地区分不同类型的参考线。
最后,虽然axhline非常易用,但在处理大规模数据或需要高性能的场景时,我们还需要考虑使用更高效的方法,如Line2D对象或批量绘制技术。通过掌握这些技巧,我们可以在各种场景下灵活运用axhline,创建出既专业又美观的数据可视化作品。
 极客笔记
极客笔记