Matplotlib Axes Annotate
Matplotlib 是一个用于绘制数据可视化图形的 Python 库,它提供了丰富的功能和灵活的选项来创建各种类型的图形。在 Matplotlib 中,Axes.annotate 函数是一个用于添加注释到图形中的方法,可以帮助我们在图形中标记重要的信息或者解释图形内容。
基本用法
Axes.annotate 函数可以用于在图形中添加注释,通过指定注释的文本内容、注释的位置坐标以及注释的样式等参数来进行设置。下面是一个基本的示例代码:
import matplotlib.pyplot as plt

fig, ax = plt.subplots()
ax.plot([1, 2, 3], [1, 2, 3])
ax.annotate('Example Annotation', xy=(2, 2), xytext=(2.5, 2.5),
            arrowprops = dict(facecolor='black', shrink=0.05))
plt.show()
Output:
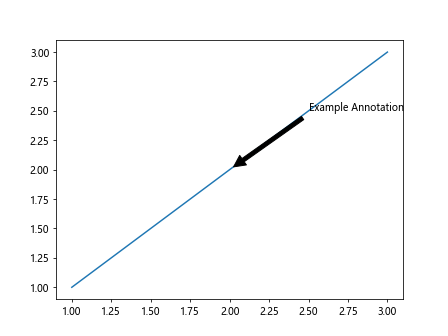
在这个示例中,我们首先创建了一个简单的折线图,然后使用 ax.annotate 函数在图形中添加了一个注释。其中参数 xy=(2, 2) 指定了注释的位置坐标,xytext=(2.5, 2.5) 指定了注释文本的位置坐标,在这里我们设置了箭头属性 arrowprops 为黑色,并且指定了箭头的大小。
文字注释
在 Matplotlib 中,Axes.annotate 函数可以用于添加不同样式的文字注释,比如指定字体、字号、颜色等。以下是一个文字注释的示例代码:
import matplotlib.pyplot as plt

fig, ax = plt.subplots()
ax.plot([1, 2, 3], [1, 2, 3])
ax.annotate('Example Annotation', xy=(2, 2), xytext=(2.5, 2.5),
            arrowprops = dict(facecolor='black', shrink=0.05),
            fontsize=12, fontweight='bold', color='red')
plt.show()
Output:
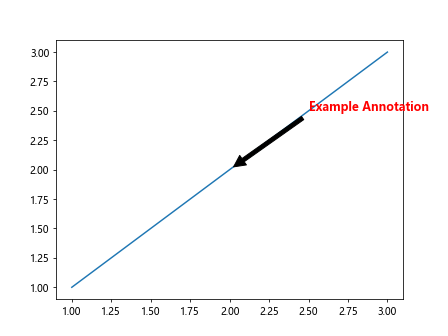
在这个示例中,我们通过指定 fontsize=12、fontweight='bold' 和 color='red' 参数设置了注释的字体大小、粗细和颜色。
箭头注释
除了文字注释外,Axes.annotate 函数还可以用于添加箭头注释,方便我们标记特定的位置或者关键点。以下是一个箭头注释的示例代码:
import matplotlib.pyplot as plt

fig, ax = plt.subplots()
ax.plot([1, 2, 3], [1, 2, 3])
ax.annotate('Example Annotation', xy=(2, 2), xytext=(2.5, 2.5),
            arrowprops = dict(arrowstyle='->'))
plt.show()
Output:
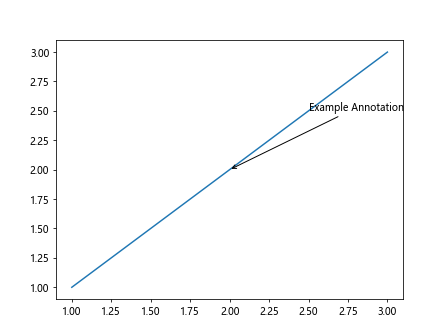
在这个示例中,我们设置了 arrowprops = dict(arrowstyle='->'),指定了箭头的样式为箭头。
复杂注释
Axes.annotate 函数还可以用于创建更加复杂的注释,比如添加带有文本框、边框样式或者阴影效果的注释。以下是一个复杂注释的示例代码:
import matplotlib.pyplot as plt

fig, ax = plt.subplots()
ax.plot([1, 2, 3], [1, 2, 3])
ax.annotate('Example Annotation', xy=(2, 2), xytext=(2.5, 2.5),
            bbox=dict(boxstyle='round', facecolor='red', alpha=0.5),
            arrowprops=dict(arrowstyle='->', connectionstyle='arc3,rad=0.5'))
plt.show()
Output:
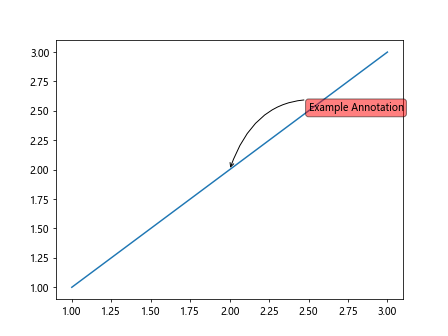
在这个示例中,我们设置了 bbox=dict(boxstyle='round', facecolor='red', alpha=0.5),添加了一个圆角矩形的文本框,并且设置了文本框的颜色和透明度。同时,我们也添加了箭头,样式为箭头,连接样式为 arc3,rad=0.5。
多个注释
除了在一个图形中添加单个注释外,Axes.annotate 函数也支持在一个图形中添加多个不同的注释。以下是一个多个注释的示例代码:
import matplotlib.pyplot as plt

fig, ax = plt.subplots()
ax.plot([1, 2, 3], [1, 2, 3])
ax.annotate('First Annotation', xy=(1, 1), xytext=(1.5, 1.5),
            arrowprops=dict(arrowstyle='->'))
ax.annotate('Second Annotation', xy=(2, 2), xytext=(2.5, 2.5),
            bbox=dict(boxstyle='round', facecolor='red', alpha=0.5),
            arrowprops=dict(arrowstyle='->', connectionstyle='arc3,rad=0.5'))
plt.show()
Output:
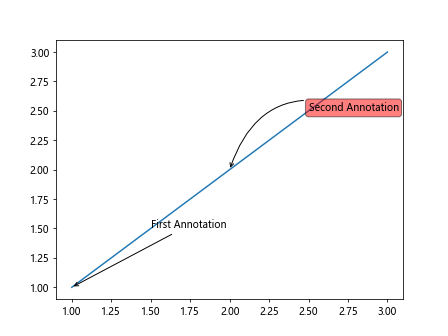
在这个示例中,我们在图形中添加了两个不同样式的注释,分别是箭头注释和带有文本框的注释。
自定义注释位置
Axes.annotate 函数还支持自定义注释的位置,可以通过设置 textcoords 参数来指定注释文本的坐标系。以下是一个自定义注释位置的示例代码:
import matplotlib.pyplot as plt

fig, ax = plt.subplots()
ax.plot([1, 2, 3], [1, 2, 3])
ax.annotate('Example Annotation', xy=(2, 2), xytext=(0.5, 0.5),
            textcoords='axes fraction',
            arrowprops=dict(arrowstyle='->'))
plt.show()
Output:
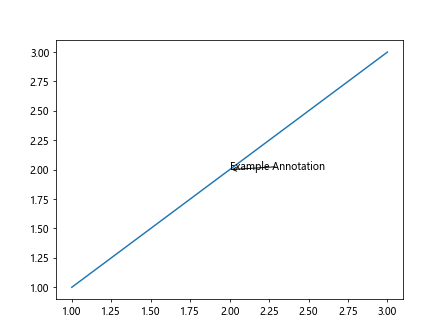
在这个示例中,我们通过设置 textcoords='axes fraction',指定了注释文本的坐标系为图形坐标系,即将坐标系归一化到 [0, 1] 的范围内。
注释偏移
Axes.annotate 函数还支持对注释位置进行偏移,可以通过设置 offset 参数来制定注释的偏移量。以下是一个注释偏移的示例代码:
import matplotlib.pyplot as plt

fig, ax = plt.subplots()
ax.plot([1, 2, 3], [1, 2, 3])
ax.annotate('Example Annotation', xy=(2, 2), xytext=(2.5, 2.5),
            arrowprops=dict(arrowstyle='->'),
            offset=(10, 10))
plt.show()
在这个示例中,我们通过设置 offset=(10, 10),指定了注释的偏移量为 (10, 10),让注释位置在 x 方向和 y 方向上向右和向上偏移了10个单位。
注释旋转
Axes.annotate 函数还支持对注释文本进行旋转,可以通过设置 rotation 参数来指定注释的旋转角度。以下是一个注释旋转的示例代码:
import matplotlib.pyplot as plt

fig, ax = plt.subplots()
ax.plot([1, 2, 3], [1, 2, 3])
ax.annotate('Example Annotation', xy=(2, 2), xytext=(2.5, 2.5),
            arrowprops=dict(arrowstyle='->'),
            rotation=45)
plt.show()
Output:
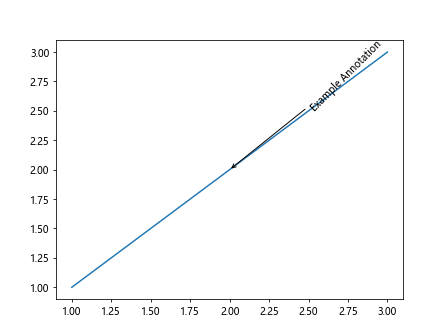
在这个示例中,我们通过设置 rotation=45,指定了注释文本的旋转角度为45度。
注释文本对齐
Axes.annotate 函数还支持对注释文本的对齐方式进行设置,可以通过设置 horizontalalignment 和 verticalalignment 参数来调整文本的水平对齐和垂直对齐方式。以下是一个注释文本对齐的示例代码:
import matplotlib.pyplot as plt

fig, ax = plt.subplots()
ax.plot([1, 2, 3], [1, 2, 3])
ax.annotate('Example Annotation', xy=(2, 2), xytext=(2.5, 2.5),
            arrowprops=dict(arrowstyle='->'),
            horizontalalignment='right', verticalalignment='top')
plt.show()
Output:
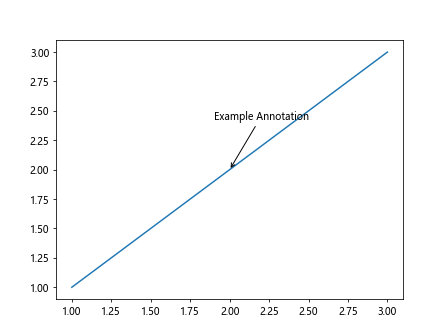
在这个示例中,我们通过设置 horizontalalignment='right' 和 verticalalignment='top',指定了注释文本的水平对齐方式为右对齐,垂直对齐方式为顶部对齐。
注释文本背景
Axes.annotate 函数还支持对注释文本添加背景色,可以通过设置 backgroundcolor 参数来指定文本的背景颜色。以下是一个添加文本背景色的示例代码:
import matplotlib.pyplot as plt

fig, ax = plt.subplots()
ax.plot([1, 2, 3], [1, 2, 3])
ax.annotate('Example Annotation', xy=(2, 2), xytext=(2.5, 2.5),
            arrowprops=dict(arrowstyle='->'),
            backgroundcolor='yellow')
plt.show()
Output:
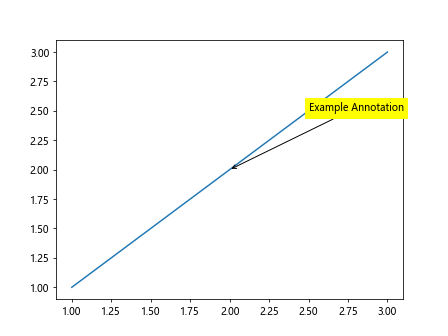
在这个示例中,我们通过设置 backgroundcolor='yellow',指定了注释文本的背景色为黄色。
改变注释箭头样式
Axes.annotate 函数还支持对注释箭头的样式进行设置,可以通过设置 arrowstyle 参数来更改箭头的样式。以下是一个更改注释箭头样式的示例代码:
import matplotlib.pyplot as plt

fig, ax = plt.subplots()
ax.plot([1, 2, 3], [1, 2, 3])
ax.annotate('Example Annotation', xy=(2, 2), xytext=(2.5, 2.5),
            arrowprops=dict(arrowstyle='wedge,tail_width=0.7'))
plt.show()
Output:
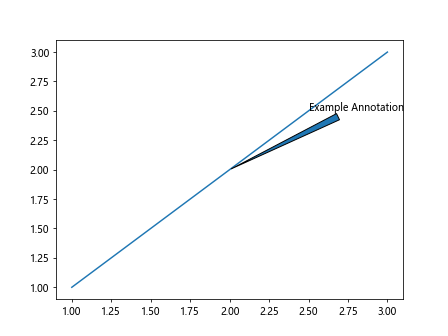
在这个示例中,我们通过设置 arrowprops=dict(arrowstyle='wedge,tail_width=0.7'),指定了注释箭头的样式为楔形,箭头尾部宽度为0.7。
自定义连接线样式
Axes.annotate 函数还支持对注释箭头的连接线样式进行设置,可以通过设置 connectionstyle 参数来指定连接线的样式。以下是一个自定义连接线样式的示例代码:
import matplotlib.pyplot as plt

fig, ax = plt.subplots()
ax.plot([1, 2, 3], [1, 2, 3])
ax.annotate('Example Annotation', xy=(1, 1), xytext=(1.5, 1.5),
            arrowprops=dict(arrowstyle='->', connectionstyle='angle,angleA=90,angleB=0,rad=5'))
plt.show()
Output:
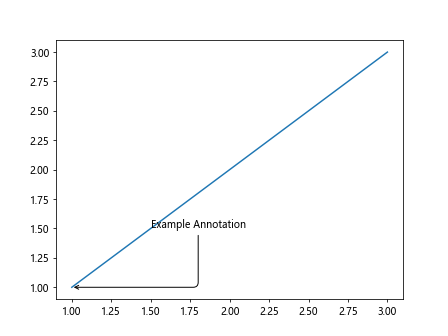
在这个示例中,我们通过设置 connectionstyle='angle,angleA=90,angleB=0,rad=5',指定了连接线的样式为角度连接,连接线起始角度为90度,终止角度为0度,连接线的弯曲半径为5。
结语
通过本文的介绍,我们学习了在 Matplotlib 中使用 Axes.annotate 函数来添加注释到图形中的方法。Axes.annotate 函数可以帮助我们在图形中标记重要的信息或者解释图形内容,提高图形的可读性和可视化效果。我们可以根据需求自定义注释的样式、位置、布局等参数,灵活地创建各种类型的注释。
 极客笔记
极客笔记