Matplotlib Artists
Matplotlib是一个用于创建可视化图表的Python库,提供了丰富的艺术家(Artists)类来创建各种图表元素。在本文中,我们将详细介绍Matplotlib中的艺术家类,包括如何创建图表元素、设置样式和属性等。
1. 创建Figure和Axes
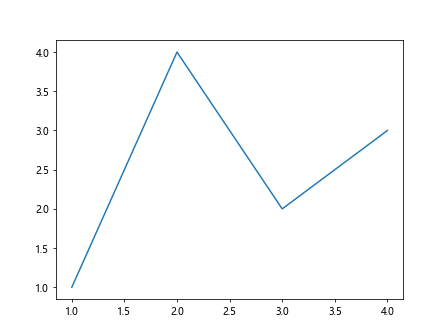
在Matplotlib中,Figure和Axes是创建图表的基本元素。Figure代表整个图表的窗口,而Axes则代表实际的绘图区域。下面是创建一个简单的图表的示例代码:
import matplotlib.pyplot as plt

fig, ax = plt.subplots()
ax.plot([1, 2, 3, 4], [1, 4, 2, 3])
plt.show()
Output:
2. 添加标题和标签
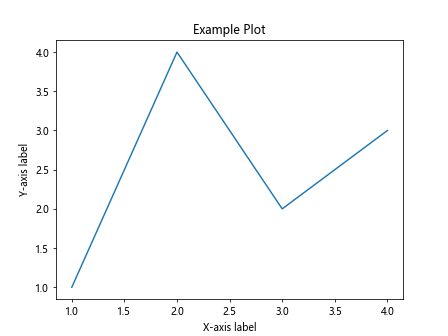
在图表中添加标题和标签是非常常见的操作,可以通过艺术家类来实现。下面是一个简单的示例代码:
import matplotlib.pyplot as plt

fig, ax = plt.subplots()
ax.plot([1, 2, 3, 4], [1, 4, 2, 3])
ax.set_title('Example Plot')
ax.set_xlabel('X-axis label')
ax.set_ylabel('Y-axis label')
plt.show()
Output:
3. 设置样式和颜色
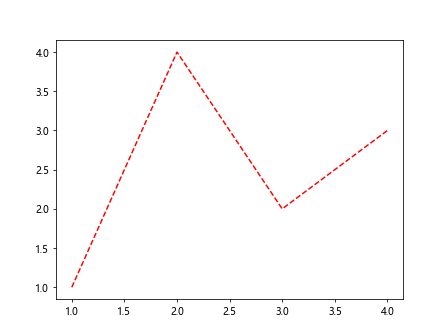
Matplotlib艺术家类提供了丰富的方法来设置图表的样式和颜色。下面是一个示例代码:
import matplotlib.pyplot as plt

fig, ax = plt.subplots()
ax.plot([1, 2, 3, 4], [1, 4, 2, 3], linestyle='--', color='r')
plt.show()
Output:
4. 添加图例
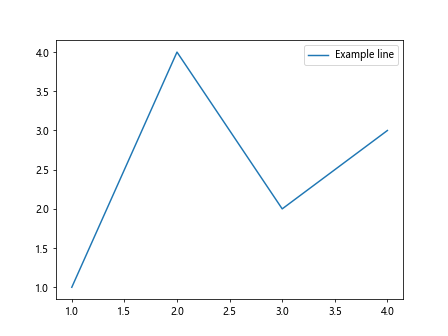
图例是用来解释图表中各个元素含义的标签,可以通过艺术家类来添加。下面是一个示例代码:
import matplotlib.pyplot as plt

fig, ax = plt.subplots()
ax.plot([1, 2, 3, 4], [1, 4, 2, 3], label='Example line')
ax.legend()
plt.show()
Output:
5. 添加注释和文本
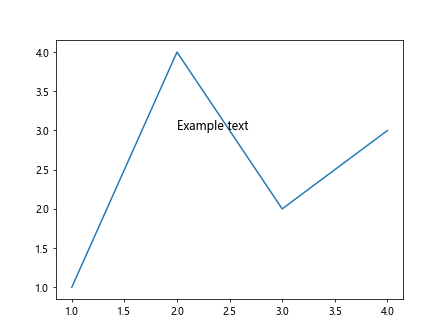
在图表中添加注释和文本可以帮助解释图表中的数据,可以通过艺术家类来实现。下面是一个示例代码:
import matplotlib.pyplot as plt

fig, ax = plt.subplots()
ax.plot([1, 2, 3, 4], [1, 4, 2, 3])
ax.text(2, 3, 'Example text', fontsize=12)
plt.show()
Output:
6. 绘制图形和图像
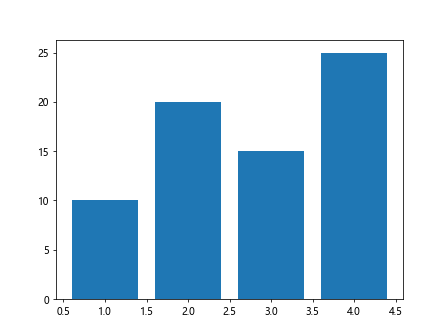
除了绘制线条之外,Matplotlib艺术家类还可以绘制各种图形和图像。下面是一个示例代码:
import matplotlib.pyplot as plt

fig, ax = plt.subplots()
ax.bar([1, 2, 3, 4], [10, 20, 15, 25])
plt.show()
Output:
7. 自定义坐标轴
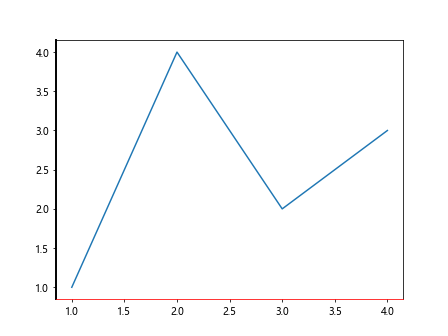
Matplotlib艺术家类还可以用来自定义坐标轴的样式和属性。下面是一个示例代码:
import matplotlib.pyplot as plt

fig, ax = plt.subplots()
ax.plot([1, 2, 3, 4], [1, 4, 2, 3])
ax.spines['bottom'].set_color('red')
ax.spines['left'].set_linewidth(2)
plt.show()
Output:
8. 绘制多个子图
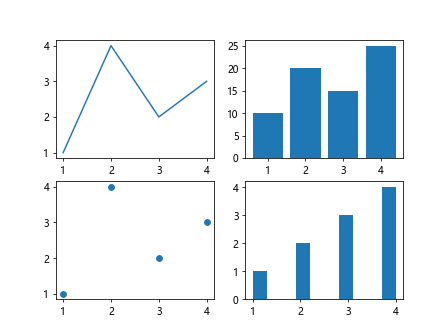
通过艺术家类,可以在同一个Figure中绘制多个子图。下面是一个示例代码:
import matplotlib.pyplot as plt

fig, axs = plt.subplots(2, 2)
axs[0, 0].plot([1, 2, 3, 4], [1, 4, 2, 3])
axs[0, 1].bar([1, 2, 3, 4], [10, 20, 15, 25])
axs[1, 0].scatter([1, 2, 3, 4], [1, 4, 2, 3])
axs[1, 1].hist([1, 2, 2, 3, 3, 3, 4, 4, 4, 4])
plt.show()
Output:
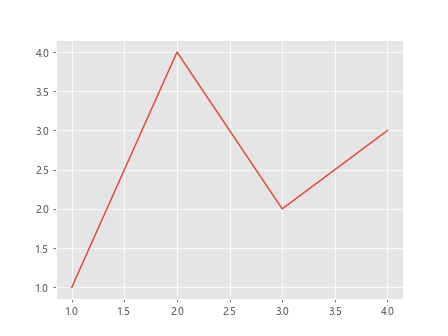
9. 使用样式表
Matplotlib提供了丰富的样式表来快速设置图表的样式,可以通过艺术家类来应用样式表。下面是一个示例代码:
import matplotlib.pyplot as plt

plt.style.use('ggplot')
fig, ax = plt.subplots()
ax.plot([1, 2, 3, 4], [1, 4, 2, 3])
plt.show()
Output:
10. 保存图表
最后,通过艺术家类,可以将绘制的图表保存为图片文件。下面是一个示例代码:
import matplotlib.pyplot as plt

fig, ax = plt.subplots()
ax.plot([1, 2, 3, 4], [1, 4, 2, 3])
plt.savefig('example_plot.png')
通过本文的介绍,我们了解了Matplotlib中艺术家类的基本用法,包括创建图表元素、设置样式和属性、添加注释和文本等操作。
 极客笔记
极客笔记