Matplotlib中使用Artist.set_picker()实现交互式图形选择
参考:Matplotlib.artist.Artist.set_picker() in Python
Matplotlib是Python中强大的数据可视化库,它提供了丰富的绘图功能。在Matplotlib中,Artist是所有可视化元素的基类,包括线条、文本、图像等。Artist类的set_picker()方法是一个非常有用的功能,它允许我们为图形元素添加可选择性,从而实现交互式的图形操作。本文将详细介绍如何在Matplotlib中使用Artist.set_picker()方法,以及如何通过这个方法实现各种交互式图形选择功能。
1. Artist.set_picker()方法简介
Artist.set_picker()方法是Matplotlib中Artist类的一个重要方法,它用于设置图形元素的可选择性。通过这个方法,我们可以定义图形元素如何响应鼠标点击事件,从而实现交互式的图形选择功能。
1.1 基本语法
set_picker()方法的基本语法如下:
artist.set_picker(picker)
其中,picker参数可以是以下几种类型:
- None:禁用选择功能
- 布尔值:True表示可选择,False表示不可选择
- 浮点数:表示选择的容差范围(以点为单位)
- 可调用对象:自定义选择逻辑的函数
1.2 简单示例
让我们从一个简单的例子开始,了解set_picker()方法的基本用法:
import matplotlib.pyplot as plt

fig, ax = plt.subplots()
ax.set_title("how2matplotlib.com - Simple Picker Example")

# 创建一个圆
circle = plt.Circle((0.5, 0.5), 0.1, color='r')
ax.add_artist(circle)

# 设置圆的可选择性
circle.set_picker(True)

def on_pick(event):
    if event.artist == circle:
        print("Circle picked!")

fig.canvas.mpl_connect('pick_event', on_pick)

plt.show()
Output:
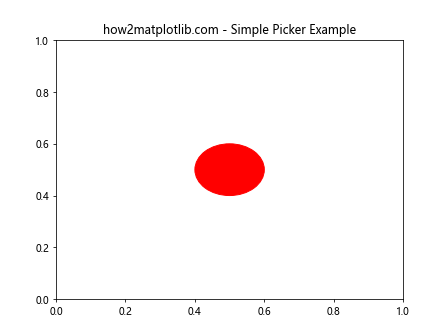
在这个例子中,我们创建了一个红色的圆,并通过set_picker(True)使其可选择。然后,我们定义了一个on_pick函数来处理选择事件,当圆被点击时,会打印一条消息。
2. 使用数值作为picker参数
当我们将一个数值作为set_picker()的参数时,它表示选择的容差范围。这在处理线条或散点图时特别有用。
2.1 线条选择示例
import matplotlib.pyplot as plt
import numpy as np

fig, ax = plt.subplots()
ax.set_title("how2matplotlib.com - Line Picker Example")

x = np.linspace(0, 10, 100)
line, = ax.plot(x, np.sin(x), picker=5)  # 5 points tolerance

def on_pick(event):
    thisline = event.artist
    xdata = thisline.get_xdata()
    ydata = thisline.get_ydata()
    ind = event.ind
    print(f'Selected point: x={xdata[ind]}, y={ydata[ind]}')

fig.canvas.mpl_connect('pick_event', on_pick)

plt.show()
Output:
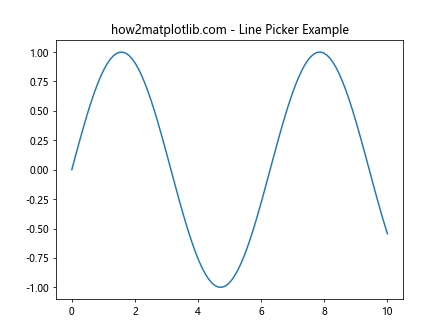
在这个例子中,我们绘制了一条正弦曲线,并设置了5个点的选择容差。当用户点击线条附近时,会打印出最近的数据点的坐标。
2.2 散点图选择示例
import matplotlib.pyplot as plt
import numpy as np

fig, ax = plt.subplots()
ax.set_title("how2matplotlib.com - Scatter Picker Example")

n = 100
x = np.random.rand(n)
y = np.random.rand(n)
colors = np.random.rand(n)
sizes = 1000 * np.random.rand(n)

scatter = ax.scatter(x, y, c=colors, s=sizes, alpha=0.5, picker=True)

def on_pick(event):
    ind = event.ind
    print(f'Selected points: {list(zip(x[ind], y[ind]))}')

fig.canvas.mpl_connect('pick_event', on_pick)

plt.show()
Output:
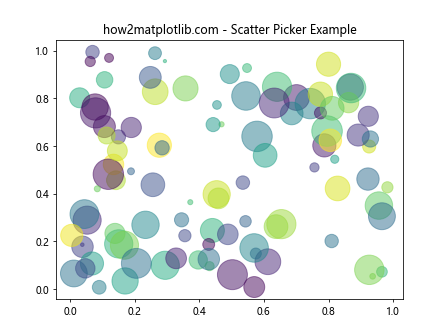
这个例子展示了如何在散点图中实现点的选择。当用户点击某个点时,会打印出被选中点的坐标。
3. 使用函数作为picker参数
set_picker()方法还可以接受一个函数作为参数,这允许我们自定义选择逻辑。
3.1 自定义选择逻辑示例
import matplotlib.pyplot as plt
import numpy as np

fig, ax = plt.subplots()
ax.set_title("how2matplotlib.com - Custom Picker Function Example")

x = np.linspace(0, 10, 100)
line, = ax.plot(x, np.sin(x), lw=3, color='blue')

def line_picker(line, mouseevent):
    if mouseevent.xdata is None:
        return False, dict()
    xdata = line.get_xdata()
    ydata = line.get_ydata()
    maxd = 0.05
    d = np.sqrt((xdata - mouseevent.xdata)**2 + (ydata - mouseevent.ydata)**2)
    ind = np.nonzero(np.less_equal(d, maxd))
    if len(ind[0]) > 0:
        pickx = xdata[ind[0][0]]
        picky = ydata[ind[0][0]]
        props = dict(ind=ind[0][0], pickx=pickx, picky=picky)
        return True, props
    else:
        return False, dict()

line.set_picker(line_picker)

def on_pick(event):
    if event.artist == line:
        print(f"Picked point: x={event.pickx:.2f}, y={event.picky:.2f}")

fig.canvas.mpl_connect('pick_event', on_pick)

plt.show()
Output:
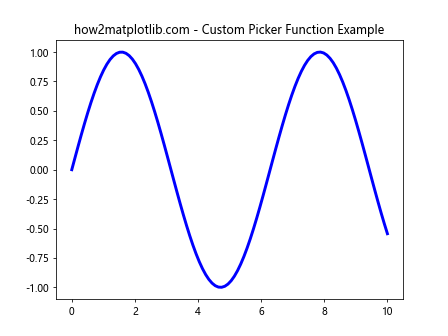
在这个例子中,我们定义了一个自定义的line_picker函数,它计算鼠标点击位置与线上最近点的距离。如果距离小于阈值,则认为选中了线上的点。
4. 多对象选择
set_picker()方法可以应用于多个对象,实现复杂的交互式选择功能。
4.1 多线条选择示例
import matplotlib.pyplot as plt
import numpy as np

fig, ax = plt.subplots()
ax.set_title("how2matplotlib.com - Multiple Line Picker Example")

x = np.linspace(0, 10, 100)
lines = []
for i in range(3):
    line, = ax.plot(x, np.sin(x + i), picker=5, label=f'Line {i+1}')
    lines.append(line)

ax.legend()

def on_pick(event):
    thisline = event.artist
    xdata = thisline.get_xdata()
    ydata = thisline.get_ydata()
    ind = event.ind
    print(f'Selected line: {thisline.get_label()}')
    print(f'Selected point: x={xdata[ind]}, y={ydata[ind]}')

fig.canvas.mpl_connect('pick_event', on_pick)

plt.show()
Output:
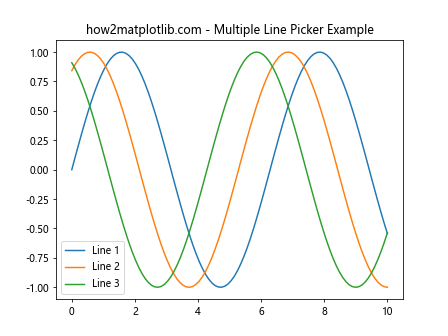
这个例子展示了如何在多条线中实现选择功能。每条线都可以被选中,并且会显示被选中的线的标签和点的坐标。
4.2 混合对象选择示例
import matplotlib.pyplot as plt
import numpy as np

fig, ax = plt.subplots()
ax.set_title("how2matplotlib.com - Mixed Object Picker Example")

# 创建线条
x = np.linspace(0, 10, 100)
line, = ax.plot(x, np.sin(x), picker=5, label='Sine Wave')

# 创建散点
n = 20
x_scatter = np.random.rand(n) * 10
y_scatter = np.random.rand(n)
scatter = ax.scatter(x_scatter, y_scatter, picker=True, label='Random Points')

# 创建文本
text = ax.text(5, 0.5, 'how2matplotlib.com', ha='center', va='center', picker=True)

ax.legend()

def on_pick(event):
    if event.artist == line:
        ind = event.ind
        print(f'Selected line point: x={x[ind]}, y={np.sin(x[ind])}')
    elif event.artist == scatter:
        ind = event.ind
        print(f'Selected scatter point: x={x_scatter[ind]}, y={y_scatter[ind]}')
    elif event.artist == text:
        print('Text selected!')

fig.canvas.mpl_connect('pick_event', on_pick)

plt.show()
Output:
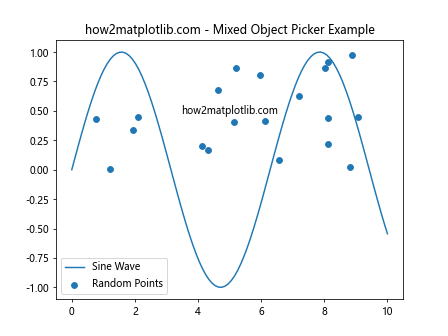
这个例子展示了如何在一个图表中实现多种不同类型对象(线条、散点和文本)的选择功能。
5. 动态更新选择对象
我们可以结合set_picker()方法和动态更新功能,实现更复杂的交互式可视化。
5.1 动态更新线条颜色示例
import matplotlib.pyplot as plt
import numpy as np

fig, ax = plt.subplots()
ax.set_title("how2matplotlib.com - Dynamic Color Update Example")

x = np.linspace(0, 10, 100)
lines = []
colors = ['red', 'green', 'blue']
for i, color in enumerate(colors):
    line, = ax.plot(x, np.sin(x + i), color=color, picker=5, label=f'Line {i+1}')
    lines.append(line)

ax.legend()

def on_pick(event):
    thisline = event.artist
    color = thisline.get_color()
    if color == 'yellow':
        thisline.set_color(colors[lines.index(thisline)])
    else:
        thisline.set_color('yellow')
    fig.canvas.draw()

fig.canvas.mpl_connect('pick_event', on_pick)

plt.show()
Output:
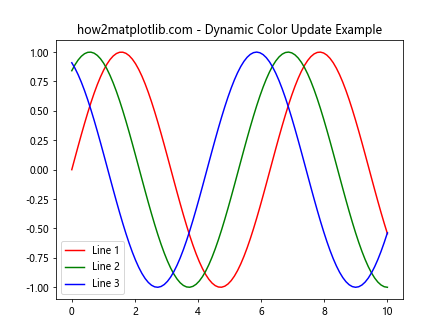
在这个例子中,当用户点击一条线时,线的颜色会在原始颜色和黄色之间切换。这展示了如何使用set_picker()方法实现动态的视觉反馈。
5.2 动态添加和删除对象示例
import matplotlib.pyplot as plt
import numpy as np

fig, ax = plt.subplots()
ax.set_title("how2matplotlib.com - Dynamic Object Addition/Removal Example")

points = []

def on_click(event):
    if event.inaxes != ax:
        return
    x, y = event.xdata, event.ydata
    point, = ax.plot(x, y, 'ro', picker=5)
    points.append(point)
    fig.canvas.draw()

def on_pick(event):
    if event.artist in points:
        event.artist.remove()
        points.remove(event.artist)
        fig.canvas.draw()

fig.canvas.mpl_connect('button_press_event', on_click)
fig.canvas.mpl_connect('pick_event', on_pick)

plt.show()
Output:
这个例子展示了如何使用set_picker()方法实现动态添加和删除对象。用户可以通过点击添加新的点,再次点击已存在的点可以删除它。
6. 高级应用:自定义选择行为
通过自定义选择函数,我们可以实现更复杂的选择行为。
6.1 区域选择示例
import matplotlib.pyplot as plt
import numpy as np

fig, ax = plt.subplots()
ax.set_title("how2matplotlib.com - Region Selection Example")

x = np.random.rand(100)
y = np.random.rand(100)
scatter = ax.scatter(x, y, picker=True)

selection_rect = plt.Rectangle((0,0), 0, 0, fill=False, edgecolor='red')
ax.add_patch(selection_rect)

start_point = None

def on_press(event):
    global start_point
    if event.inaxes == ax:
        start_point = (event.xdata, event.ydata)
        selection_rect.set_width(0)
        selection_rect.set_height(0)
        selection_rect.set_xy(start_point)
        selection_rect.set_visible(True)
        fig.canvas.draw()

def on_release(event):
    global start_point
    if start_point:
        end_point = (event.xdata, event.ydata)
        xmin, xmax = sorted([start_point[0], end_point[0]])
        ymin, ymax = sorted([start_point[1], end_point[1]])

        selected = np.where((x >= xmin) & (x <= xmax) & (y >= ymin) & (y <= ymax))[0]
        print(f"Selected points: {list(zip(x[selected], y[selected]))}")

        selection_rect.set_visible(False)
        fig.canvas.draw()
        start_point = None

def on_motion(event):
    if start_point:
        x0, y0 = start_point
        x1, y1 = event.xdata, event.ydata
        selection_rect.set_width(x1 - x0)
        selection_rect.set_height(y1 - y0)
        fig.canvas.draw()

fig.canvas.mpl_connect('button_press_event', on_press)
fig.canvas.mpl_connect('button_release_event', on_release)
fig.canvas.mpl_connect('motion_notify_event', on_motion)

plt.show()
Output:
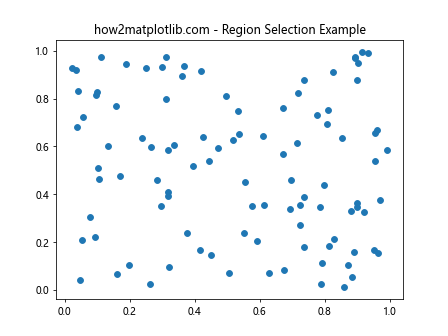
这个例子展示了如何实现区域选择功能。用户可以通过拖动鼠标选择一个矩形区域,程序会打印出落在这个区域内的所有点的坐标。
6.2 多重选择示例
import matplotlib.pyplot as plt
import numpy as np

fig, ax = plt.subplots()
ax.set_title("how2matplotlib.com - Multiple Selection Example")

x = np.random.rand(100)
y = np.random.rand(100)
colors = np.array(['blue'] * 100)
scatter = ax.scatter(x, y, c=colors, picker=True)

selected_points = set()

def on_pick(event):```python
def on_pick(event):
    ind = event.ind[0]
    if ind in selected_points:
        selected_points.remove(ind)
        colors[ind] = 'blue'
    else:
        selected_points.add(ind)
        colors[ind] = 'red'
    scatter.set_facecolors(colors)
    fig.canvas.draw()

fig.canvas.mpl_connect('pick_event', on_pick)

plt.show()
这个例子展示了如何实现多重选择功能。用户可以点击多个点来选择或取消选择,被选中的点会变成红色。
7. 结合其他Matplotlib功能
set_picker()方法可以与Matplotlib的其他功能结合使用,创造出更丰富的交互式可视化效果。
7.1 结合注释功能的选择示例
import matplotlib.pyplot as plt
import numpy as np

fig, ax = plt.subplots()
ax.set_title("how2matplotlib.com - Selection with Annotation Example")

x = np.linspace(0, 10, 100)
y = np.sin(x)
line, = ax.plot(x, y, picker=5)

annotation = ax.annotate("", xy=(0,0), xytext=(20,20), textcoords="offset points",
                         bbox=dict(boxstyle="round", fc="w"),
                         arrowprops=dict(arrowstyle="->"))
annotation.set_visible(False)

def on_pick(event):
    if event.artist != line:
        return
    xdata = event.artist.get_xdata()
    ydata = event.artist.get_ydata()
    ind = event.ind
    x = xdata[ind][0]
    y = ydata[ind][0]
    annotation.xy = (x, y)
    annotation.set_text(f"x={x:.2f}\ny={y:.2f}")
    annotation.set_visible(True)
    fig.canvas.draw()

fig.canvas.mpl_connect('pick_event', on_pick)

plt.show()
Output:
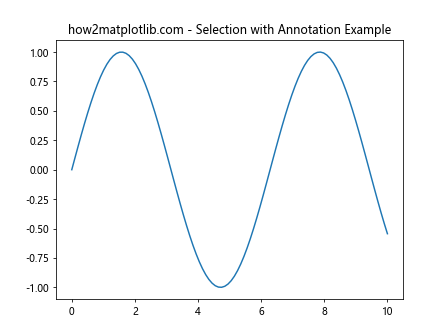
这个例子展示了如何结合set_picker()方法和注释功能。当用户点击线上的点时,会显示一个带有坐标信息的注释。
7.2 结合子图的选择示例
import matplotlib.pyplot as plt
import numpy as np

fig, (ax1, ax2) = plt.subplots(1, 2, figsize=(12, 5))
fig.suptitle("how2matplotlib.com - Selection with Subplots Example")

x = np.linspace(0, 10, 100)
y1 = np.sin(x)
y2 = np.cos(x)

line1, = ax1.plot(x, y1, picker=5)
line2, = ax2.plot(x, y2, picker=5)

ax1.set_title("Sin")
ax2.set_title("Cos")

def on_pick(event):
    if event.artist == line1:
        ax = ax1
        y = y1
        title = "Sin"
    else:
        ax = ax2
        y = y2
        title = "Cos"

    xdata = event.artist.get_xdata()
    ydata = event.artist.get_ydata()
    ind = event.ind
    x_val = xdata[ind][0]
    y_val = ydata[ind][0]

    ax.set_title(f"{title}: x={x_val:.2f}, y={y_val:.2f}")
    fig.canvas.draw()

fig.canvas.mpl_connect('pick_event', on_pick)

plt.show()
Output:
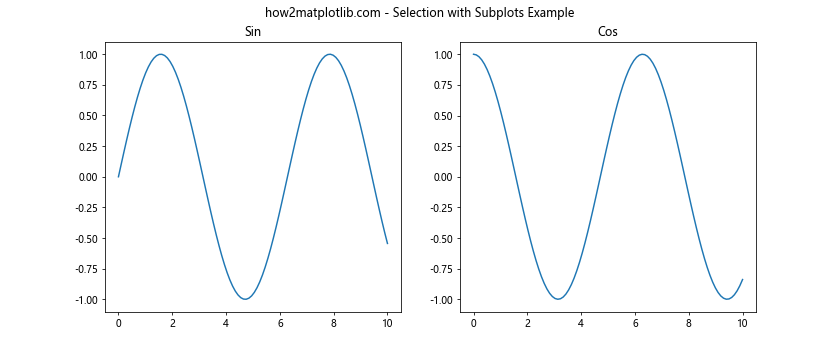
这个例子展示了如何在包含多个子图的图表中使用set_picker()方法。用户可以点击任一子图中的线,相应的子图标题会更新以显示所选点的坐标。
8. 处理大量数据
当处理大量数据时,set_picker()方法的性能可能会受到影响。在这种情况下,我们可以采用一些优化策略。
8.1 使用索引选择示例
import matplotlib.pyplot as plt
import numpy as np

fig, ax = plt.subplots()
ax.set_title("how2matplotlib.com - Large Dataset Selection Example")

n = 10000
x = np.linspace(0, 10, n)
y = np.sin(x) + np.random.normal(0, 0.1, n)

line, = ax.plot(x, y, 'o', markersize=2, picker=5)

def on_pick(event):
    if event.artist != line:
        return
    n = len(event.ind)
    if not n:
        return
    dataind = event.ind[0]

    ax.clear()
    ax.plot(x, y, 'o', markersize=2, picker=5)
    ax.plot(x[dataind], y[dataind], 'ro', markersize=10)
    ax.set_title(f"Selected point: x={x[dataind]:.2f}, y={y[dataind]:.2f}")
    fig.canvas.draw()

fig.canvas.mpl_connect('pick_event', on_pick)

plt.show()
Output:
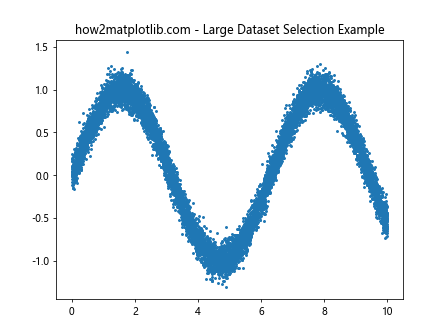
这个例子展示了如何处理包含大量数据点的图表。我们使用索引来快速定位被选中的点,并通过重绘整个图表来突出显示选中的点。
8.2 使用四叉树优化选择示例
import matplotlib.pyplot as plt
import numpy as np
from matplotlib.collections import QuadMesh

fig, ax = plt.subplots()
ax.set_title("how2matplotlib.com - QuadMesh Selection Example")

n = 100
x = np.linspace(0, 10, n)
y = np.linspace(0, 10, n)
X, Y = np.meshgrid(x, y)
Z = np.sin(X) * np.cos(Y)

mesh = ax.pcolormesh(X, Y, Z, picker=True)

def on_pick(event):
    if event.artist != mesh:
        return

    x, y = event.mouseevent.xdata, event.mouseevent.ydata
    i, j = int(x * (n-1) / 10), int(y * (n-1) / 10)
    value = Z[j, i]

    ax.set_title(f"Selected point: x={x:.2f}, y={y:.2f}, value={value:.2f}")
    fig.canvas.draw()

fig.canvas.mpl_connect('pick_event', on_pick)

plt.show()
Output:
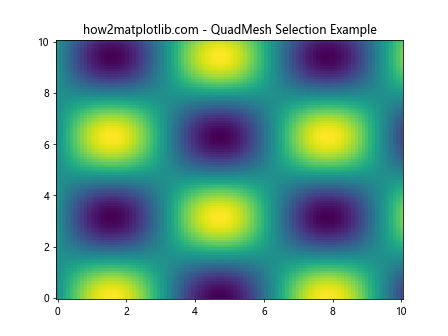
这个例子展示了如何使用QuadMesh来处理大型二维数据集。QuadMesh使用四叉树结构来优化选择操作,使得即使在处理大量数据时也能保持良好的性能。
9. 自定义鼠标光标
我们可以结合set_picker()方法和自定义鼠标光标,提供更直观的用户交互体验。
9.1 自定义光标示例
import matplotlib.pyplot as plt
import numpy as np
from matplotlib.backend_bases import cursors

fig, ax = plt.subplots()
ax.set_title("how2matplotlib.com - Custom Cursor Example")

x = np.linspace(0, 10, 100)
y = np.sin(x)
line, = ax.plot(x, y, picker=5)

def on_pick(event):
    if event.artist == line:
        fig.canvas.set_cursor(cursors.HAND)
    else:
        fig.canvas.set_cursor(cursors.POINTER)

def on_move(event):
    if event.inaxes == ax:
        contains, _ = line.contains(event)
        if contains:
            fig.canvas.set_cursor(cursors.HAND)
        else:
            fig.canvas.set_cursor(cursors.POINTER)

fig.canvas.mpl_connect('pick_event', on_pick)
fig.canvas.mpl_connect('motion_notify_event', on_move)

plt.show()
Output:
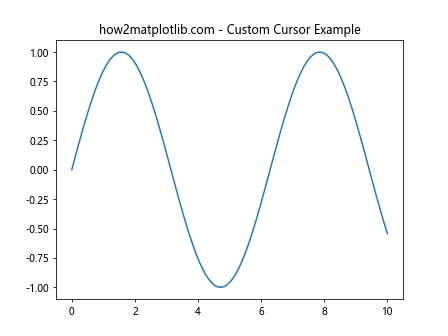
这个例子展示了如何根据鼠标是否悬停在可选择的对象上来改变鼠标光标的形状。当鼠标悬停在线上时,光标会变成手形;否则,它会保持默认的箭头形状。
10. 结合动画效果
我们可以将set_picker()方法与Matplotlib的动画功能结合,创造出动态的交互式可视化效果。
10.1 选择触发动画示例
import matplotlib.pyplot as plt
import numpy as np
from matplotlib.animation import FuncAnimation

fig, ax = plt.subplots()
ax.set_title("how2matplotlib.com - Selection Triggered Animation Example")

x = np.linspace(0, 10, 100)
y = np.sin(x)
line, = ax.plot(x, y, picker=5)

selected_point = None

def on_pick(event):
    global selected_point
    if event.artist == line:
        xdata = event.artist.get_xdata()
        ydata = event.artist.get_ydata()
        ind = event.ind
        selected_point = (xdata[ind][0], ydata[ind][0])
        ani.event_source.start()

def animate(frame):
    if selected_point:
        x, y = selected_point
        circle = plt.Circle((x, y), 0.1 * frame, fill=False)
        ax.add_artist(circle)
        if frame >= 10:
            ani.event_source.stop()
            ax.clear()
            ax.plot(x, y, picker=5)
            ax.set_title("how2matplotlib.com - Animation Complete")
    return line,

ani = FuncAnimation(fig, animate, frames=range(11), interval=50, blit=True)
ani.event_source.stop()

fig.canvas.mpl_connect('pick_event', on_pick)

plt.show()
Output:
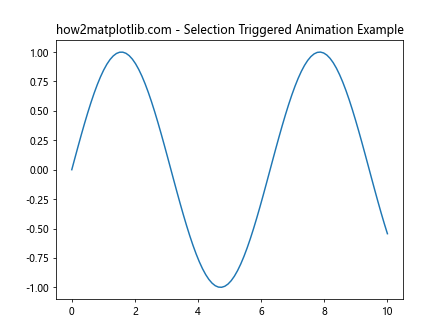
这个例子展示了如何在选择一个点后触发动画效果。当用户点击线上的一个点时,会在该点周围出现一个逐渐扩大的圆圈动画。
总结
Matplotlib的Artist.set_picker()方法是一个强大的工具,它为我们提供了创建交互式数据可视化的能力。通过本文的详细介绍和丰富的示例,我们了解了如何使用这个方法来实现各种选择功能,包括简单的点击选择、自定义选择逻辑、多对象选择、动态更新、区域选择等高级应用。
我们还探讨了如何将set_picker()方法与Matplotlib的其他功能结合使用,如注释、子图、大数据处理、自定义光标和动画效果等。这些组合使用可以创造出更加丰富和直观的交互式可视化效果。
在实际应用中,set_picker()方法可以帮助我们创建更加用户友好的数据探索工具,使用户能够直观地与数据进行交互,从而更好地理解和分析数据。无论是在科学研究、数据分析还是商业报告中,这种交互式可视化都能够提供更深入的洞察和更engaging的展示效果。
然而,在使用set_picker()方法时,我们也需要注意一些潜在的挑战,比如在处理大量数据时的性能问题。在这种情况下,我们可能需要采用一些优化策略,如使用索引选择或四叉树等数据结构来提高选择操作的效率。
总的来说,掌握Artist.set_picker()方法及其相关技巧,可以极大地提升我们使用Matplotlib创建交互式数据可视化的能力,为我们的数据分析和展示工作增添新的维度。
 极客笔记
极客笔记