Matplotlib中使用get_zorder()方法控制图形元素的绘制顺序
参考:Matplotlib.artist.Artist.get_zorder() in Python
Matplotlib是Python中最流行的数据可视化库之一,它提供了丰富的绘图功能和灵活的自定义选项。在创建复杂的图表时,控制不同图形元素的绘制顺序变得尤为重要。Matplotlib通过zorder属性来管理这一绘制顺序,而get_zorder()方法则允许我们获取特定Artist对象的zorder值。本文将深入探讨Matplotlib.artist.Artist.get_zorder()方法的使用,以及如何利用它来优化图表的视觉效果。
1. 理解zorder概念
在Matplotlib中,zorder是一个决定图形元素绘制顺序的数值属性。具有较高zorder值的元素会被绘制在具有较低zorder值的元素之上。默认情况下,不同类型的图形元素有不同的默认zorder值:
- 图像(Images): 0
- 轴(Axes): 0
- 补丁(Patches): 1
- 线条(Lines): 2
- 文本(Text): 3
了解这一概念对于创建层次分明的可视化效果至关重要。让我们通过一个简单的例子来说明zorder的作用:
import matplotlib.pyplot as plt

fig, ax = plt.subplots()

# 绘制两个重叠的圆
circle1 = plt.Circle((0.5, 0.5), 0.4, color='red', zorder=1)
circle2 = plt.Circle((0.7, 0.7), 0.4, color='blue', zorder=2)

ax.add_patch(circle1)
ax.add_patch(circle2)

ax.set_xlim(0, 1)
ax.set_ylim(0, 1)
ax.set_title('Zorder Example - how2matplotlib.com')

plt.show()
Output:
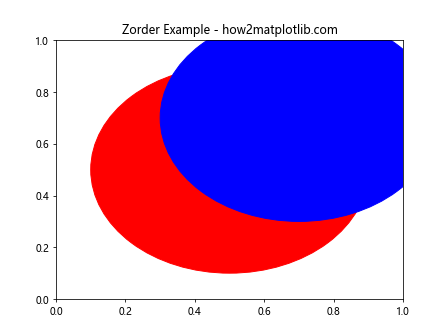
在这个例子中,我们创建了两个部分重叠的圆。蓝色圆的zorder值(2)高于红色圆(1),因此蓝色圆会被绘制在红色圆之上。
2. get_zorder()方法简介
get_zorder()是Matplotlib中Artist类的一个方法。Artist是Matplotlib中所有可视元素的基类,包括Figure、Axes以及所有的图形元素(如Line2D、Text、Patch等)。这个方法允许我们获取任何Artist对象的当前zorder值。
基本语法如下:
zorder = artist.get_zorder()
其中,artist是任何Artist对象,返回值zorder是一个整数,表示该对象的当前zorder值。
3. 使用get_zorder()方法
让我们通过一些实际例子来展示如何使用get_zorder()方法:
import matplotlib.pyplot as plt

fig, ax = plt.subplots()

# 创建一些图形元素
line = ax.plot([0, 1], [0, 1], label='Line - how2matplotlib.com')[0]
scatter = ax.scatter([0.5], [0.5], c='red', s=100, label='Scatter - how2matplotlib.com')
text = ax.text(0.5, 0.5, 'Text - how2matplotlib.com', ha='center', va='center')

# 获取并打印各元素的zorder值
print(f"Line zorder: {line.get_zorder()}")
print(f"Scatter zorder: {scatter.get_zorder()}")
print(f"Text zorder: {text.get_zorder()}")

ax.legend()
plt.show()
Output:
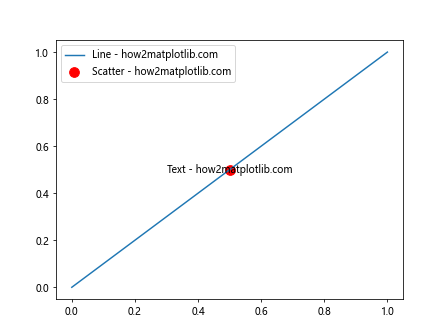
在这个例子中,我们创建了一条线、一个散点和一个文本对象,然后使用get_zorder()方法获取它们的zorder值。这可以帮助我们了解不同类型图形元素的默认zorder值,从而更好地控制它们的绘制顺序。
4. 动态调整zorder
get_zorder()方法通常与set_zorder()方法配合使用,以动态调整图形元素的绘制顺序。下面是一个示例,展示如何根据当前zorder值来调整元素的位置:
import matplotlib.pyplot as plt
import numpy as np

fig, ax = plt.subplots()

# 创建多个重叠的圆
circles = [plt.Circle((np.random.rand(), np.random.rand()), 0.1,
                      color=np.random.rand(3,)) for _ in range(5)]

for circle in circles:
    ax.add_patch(circle)
    current_zorder = circle.get_zorder()
    circle.set_zorder(current_zorder + 1)  # 增加zorder值

ax.set_xlim(0, 1)
ax.set_ylim(0, 1)
ax.set_title('Dynamic Zorder Adjustment - how2matplotlib.com')

plt.show()
Output:
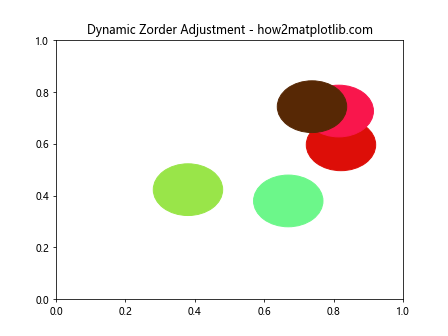
在这个例子中,我们创建了多个随机位置和颜色的圆。通过获取每个圆的当前zorder值并增加1,我们确保了后绘制的圆总是出现在先绘制的圆之上。
5. 在复杂图表中应用get_zorder()
在创建复杂的多层次图表时,get_zorder()方法可以帮助我们精确控制每个元素的位置。以下是一个更复杂的例子,展示了如何在包含多种元素的图表中使用get_zorder():
import matplotlib.pyplot as plt
import numpy as np

fig, ax = plt.subplots(figsize=(10, 6))

# 背景
background = plt.Rectangle((0, 0), 1, 1, facecolor='lightgray')
ax.add_patch(background)

# 数据
x = np.linspace(0, 1, 100)
y1 = np.sin(2 * np.pi * x)
y2 = np.cos(2 * np.pi * x)

# 绘制线条和填充区域
line1 = ax.plot(x, y1, color='blue', label='Sin - how2matplotlib.com')[0]
line2 = ax.plot(x, y2, color='red', label='Cos - how2matplotlib.com')[0]
fill = ax.fill_between(x, y1, y2, alpha=0.3, color='green')

# 添加一些点
scatter = ax.scatter(x[::10], y1[::10], c='purple', s=50)

# 添加文本
text = ax.text(0.5, 0, 'Complex Chart - how2matplotlib.com', ha='center', va='bottom')

# 获取并打印各元素的zorder值
print(f"Background zorder: {background.get_zorder()}")
print(f"Line1 zorder: {line1.get_zorder()}")
print(f"Line2 zorder: {line2.get_zorder()}")
print(f"Fill zorder: {fill.get_zorder()}")
print(f"Scatter zorder: {scatter.get_zorder()}")
print(f"Text zorder: {text.get_zorder()}")

# 调整zorder以优化视觉效果
background.set_zorder(background.get_zorder() - 1)  # 将背景移到最底层
fill.set_zorder(fill.get_zorder() - 1)  # 将填充区域移到线条下方
scatter.set_zorder(scatter.get_zorder() + 1)  # 将散点移到线条上方
text.set_zorder(text.get_zorder() + 1)  # 确保文本在最上层

ax.set_xlim(0, 1)
ax.set_ylim(-1.5, 1.5)
ax.legend()
ax.set_title('Complex Chart with Zorder Adjustments - how2matplotlib.com')

plt.show()
Output:
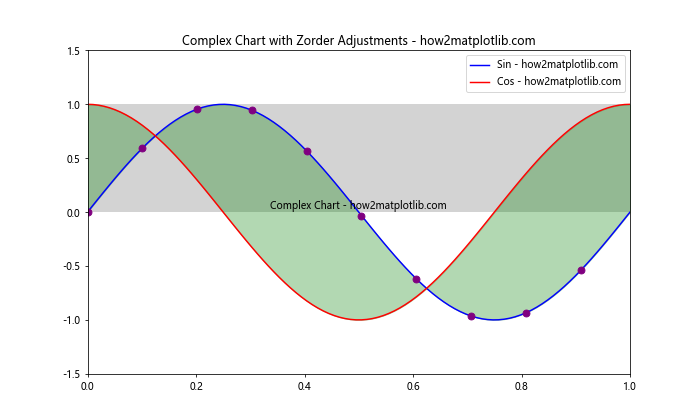
在这个复杂的例子中,我们创建了一个包含背景、线条、填充区域、散点和文本的图表。通过使用get_zorder()获取各元素的初始zorder值,然后使用set_zorder()调整这些值,我们可以精确控制每个元素的绘制顺序,从而优化整个图表的视觉效果。
6. 处理重叠元素
当图表中有多个重叠的元素时,正确设置zorder变得尤为重要。以下是一个处理重叠元素的示例:
import matplotlib.pyplot as plt
import numpy as np

fig, ax = plt.subplots(figsize=(8, 6))

# 创建重叠的条形图和线图
x = np.arange(5)
y1 = np.random.rand(5) * 10
y2 = np.random.rand(5) * 8

bars = ax.bar(x, y1, alpha=0.5, label='Bars - how2matplotlib.com')
line = ax.plot(x, y2, 'r-', linewidth=2, label='Line - how2matplotlib.com')[0]

# 获取并打印初始zorder值
print(f"Bars initial zorder: {bars[0].get_zorder()}")
print(f"Line initial zorder: {line.get_zorder()}")

# 调整zorder使线条出现在条形上方
new_line_zorder = max(bar.get_zorder() for bar in bars) + 1
line.set_zorder(new_line_zorder)

print(f"Line new zorder: {line.get_zorder()}")

ax.set_xlabel('X-axis - how2matplotlib.com')
ax.set_ylabel('Y-axis - how2matplotlib.com')
ax.set_title('Overlapping Elements with Adjusted Zorder - how2matplotlib.com')
ax.legend()

plt.show()
Output:
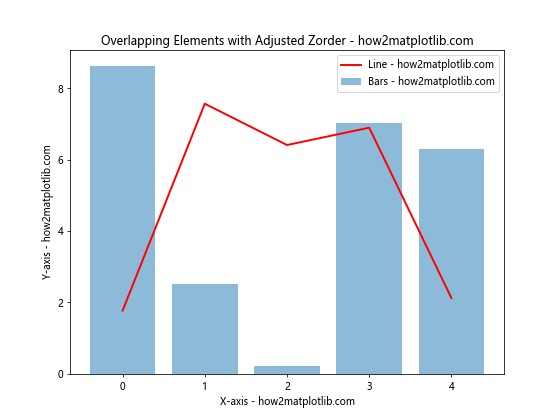
在这个例子中,我们创建了一个包含重叠的条形图和线图的图表。通过使用get_zorder()获取条形图的最大zorder值,然后将线图的zorder设置为比这个值大1,我们确保了线图会绘制在所有条形之上。
7. 在子图中使用get_zorder()
当处理包含多个子图的复杂图表时,get_zorder()方法同样适用。以下是一个在子图中使用get_zorder()的示例:
import matplotlib.pyplot as plt
import numpy as np

fig, (ax1, ax2) = plt.subplots(1, 2, figsize=(12, 5))

# 子图1:重叠的散点图
x = np.random.rand(50)
y = np.random.rand(50)
sizes = np.random.rand(50) * 200

scatter1 = ax1.scatter(x, y, s=sizes, c='blue', alpha=0.5, label='Blue - how2matplotlib.com')
scatter2 = ax1.scatter(x, y, s=sizes*0.8, c='red', alpha=0.5, label='Red - how2matplotlib.com')

print(f"Scatter1 zorder: {scatter1.get_zorder()}")
print(f"Scatter2 zorder: {scatter2.get_zorder()}")

# 调整zorder使蓝色点在红色点之上
scatter1.set_zorder(scatter2.get_zorder() + 1)

ax1.set_title('Overlapping Scatters - how2matplotlib.com')
ax1.legend()

# 子图2:带背景的线图
x = np.linspace(0, 10, 100)
y1 = np.sin(x)
y2 = np.cos(x)

background = ax2.axhspan(-1, 1, facecolor='lightgray', alpha=0.5)
line1 = ax2.plot(x, y1, label='Sin - how2matplotlib.com')[0]
line2 = ax2.plot(x, y2, label='Cos - how2matplotlib.com')[0]

print(f"Background zorder: {background.get_zorder()}")
print(f"Line1 zorder: {line1.get_zorder()}")
print(f"Line2 zorder: {line2.get_zorder()}")

# 确保背景在最底层
background.set_zorder(min(line1.get_zorder(), line2.get_zorder()) - 1)

ax2.set_title('Lines with Background - how2matplotlib.com')
ax2.legend()

plt.tight_layout()
plt.show()
Output:
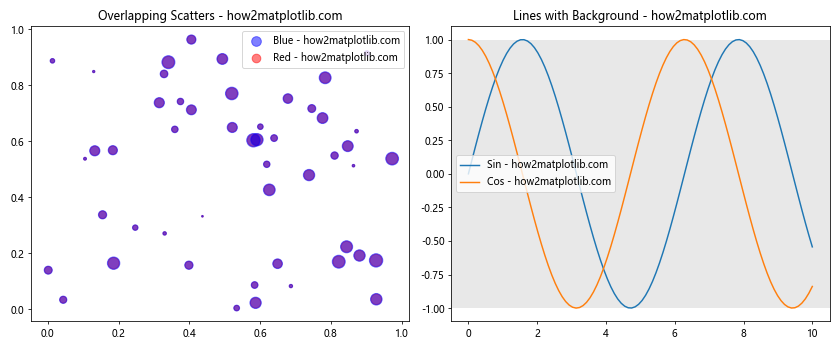
在这个例子中,我们创建了两个子图:一个包含重叠散点的图和一个带背景的线图。通过使用get_zorder()和set_zorder(),我们可以精确控制每个子图中元素的绘制顺序。
8. 动态更新zorder
在某些情况下,我们可能需要根据数据或其他条件动态更新图形元素的zorder。以下是一个示例,展示如何根据数据值动态设置散点的zorder:
import matplotlib.pyplot as plt
import numpy as np

fig, ax = plt.subplots(figsize=(8, 6))

# 生成随机数据
np.random.seed(42)
x = np.random.rand(100)
y = np.random.rand(100)
sizes = np.random.rand(100) * 200
colors = np.random.rand(100)

# 创建散点图
scatter = ax.scatter(x, y, s=sizes, c=colors, cmap='viridis', alpha=0.6)

# 动态设置zorder
for i, (xi, yi) in enumerate(zip(x, y)):
    point = scatter.get_paths()[i]
    current_zorder = point.get_zorder()
    new_zorder = int(yi * 10)  # 根据y值设置新的zorder
    point.set_zorder(new_zorder)

    # 打印一些zorder信息
    if i < 5:  # 只打印前5个点的信息
        print(f"Point {i}: Initial zorder = {current_zorder}, New zorder = {new_zorder}")

ax.set_xlabel('X-axis - how2matplotlib.com')
ax.set_ylabel('Y-axis - how2matplotlib.com')
ax.set_title('Dynamic Zorder Based on Y-values - how2matplotlib.com')

plt.colorbar(scatter, label='Color Value - how2matplotlib.com')
plt.show()
在这个例子中,我们创建了一个散点图,然后根据每个点的y值动态设置其zorder。这样,y值较高的点会被绘制在y值较低的点之上,创造出一种深度效果。
9. 在3D图中使用get_zorder()
虽然在3D图中z轴已经提供了一定的深度信息,但有时我们仍然需要使用zorder来控制绘制顺序。以下是一个在3D图中使用get_zorder()的示例:
import matplotlib.pyplot as plt
import numpy as np
from mpl_toolkits.mplot3d import Axes3D

fig = plt.figure(figsize=(10, 8))
ax = fig.add_subplot(111, projection='3d')

# 创建两个3D平面
x = y = np.arange(-3, 3, 0.5)
X, Y = np.meshgrid(x, y)
Z1 = np.sin(np.sqrt(X**2 + Y**2))
Z2 = np.cos(np.sqrt(X**2 + Y**2))

# 绘制两个平面
surf1 = ax.plot_surface(X, Y, Z1, cmap='viridis', alpha=0.7)
surf2 = ax.plot_surface(X, Y, Z2, cmap='plasma', alpha=0.7)

# 获取并打印初始zorder值
print(f"Surface 1 initial zorder: {surf1.get_zorder()}")
print(f"Surface 2 initial zorder: {surf2.get_zorder()}")

# 调整zorder
surf1.set_zorder(surf2.get_zorder() + 1)

print(f"Surface 1 new zorder: {surf1.get_zorder()}")

ax.set_xlabel('X-axis - how2matplotlib.com')
ax.set_ylabel('Y-axis - how2matplotlib.com')
ax.set_zlabel('Z-axis - how2matplotlib.com')
ax.set_title('3D Surfaces with Adjusted Zorder - how2matplotlib.com')

plt.show()
Output:
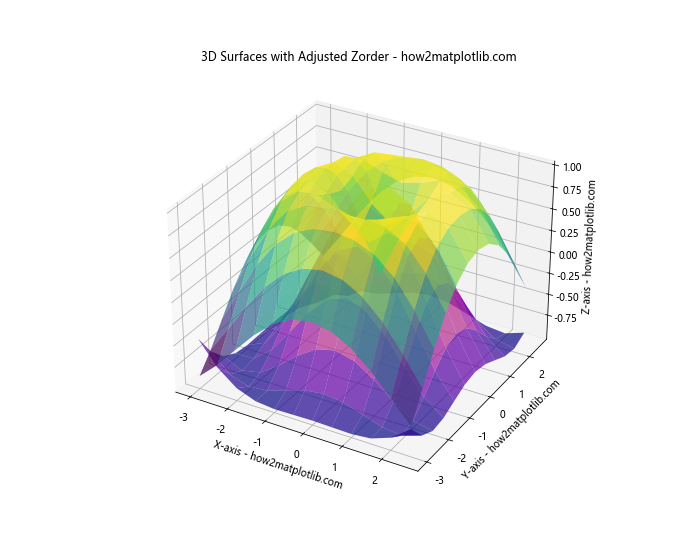
在这个3D图例子中,我们创建了两个重叠的曲面。通过调整zorder,我们可以控制哪个曲面在上方,即使它们在z轴上的位置可能有所不同。
10. 在动画中使用get_zorder()
当创建动画时,动态调整zorder可以产生有趣的视觉效果。以下是一个使用get_zorder()在动画中控制绘制顺序的示例:
import matplotlib.pyplot as plt
import matplotlib.animation as animation
import numpy as np

fig, ax = plt.subplots(figsize=(8, 6))

# 创建多个圆
circles = [plt.Circle((np.random.rand(), np.random.rand()), 0.1,
                      color=np.random.rand(3,)) for _ in range(10)]

for circle in circles:
    ax.add_patch(circle)

ax.set_xlim(0, 1)
ax.set_ylim(0, 1)

def update(frame):
    for i, circle in enumerate(circles):
        # 更新位置
        circle.center = (np.random.rand(), np.random.rand())

        # 动态调整zorder
        current_zorder = circle.get_zorder()
        new_zorder = (current_zorder + 1) % 10  # 循环使用0-9的zorder值
        circle.set_zorder(new_zorder)

        if i == 0:  # 只打印第一个圆的信息
            print(f"Frame {frame}: Circle 0 zorder = {new_zorder}")

    return circles

ani = animation.FuncAnimation(fig, update, frames=50, interval=200, blit=True)

ax.set_title('Animated Circles with Dynamic Zorder - how2matplotlib.com')
plt.show()
Output:
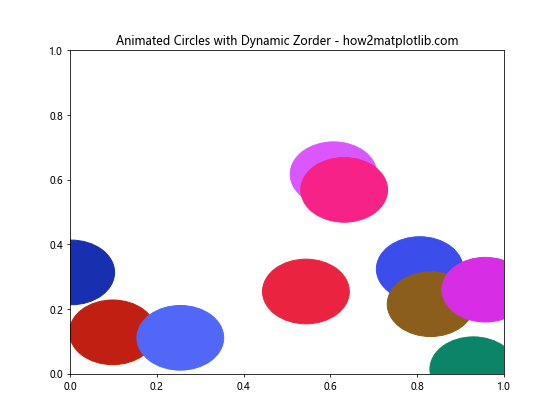
在这个动画示例中,我们创建了多个移动的圆。每一帧,我们都会更新圆的位置并动态调整它们的zorder。这创造了一种圆彼此交错移动的效果。
11. 在复杂的图例中使用get_zorder()
当处理复杂的图例时,控制图例元素的绘制顺序可能会变得重要。以下是一个使用get_zorder()来管理图例元素顺序的示例:
import matplotlib.pyplot as plt
import numpy as np

fig, ax = plt.subplots(figsize=(10, 6))

# 创建一些重叠的数据
x = np.linspace(0, 10, 100)
y1 = np.sin(x)
y2 = np.cos(x)
y3 = np.tan(x)

# 绘制数据
line1 = ax.plot(x, y1, label='Sin - how2matplotlib.com')[0]
line2 = ax.plot(x, y2, label='Cos - how2matplotlib.com')[0]
line3 = ax.plot(x, y3, label='Tan - how2matplotlib.com')[0]

# 创建图例
legend = ax.legend(loc='upper right')

# 获取图例中的线条对象
legend_lines = legend.get_lines()

# 打印初始zorder值
for i, line in enumerate(legend_lines):
    print(f"Legend line {i} initial zorder: {line.get_zorder()}")

# 调整图例中线条的zorder
for i, line in enumerate(legend_lines):
    line.set_zorder(len(legend_lines) - i)

# 打印调整后的zorder值
for i, line in enumerate(legend_lines):
    print(f"Legend line {i} new zorder: {line.get_zorder()}")

ax.set_xlabel('X-axis - how2matplotlib.com')
ax.set_ylabel('Y-axis - how2matplotlib.com')
ax.set_title('Complex Legend with Adjusted Zorder - how2matplotlib.com')

plt.show()
Output:
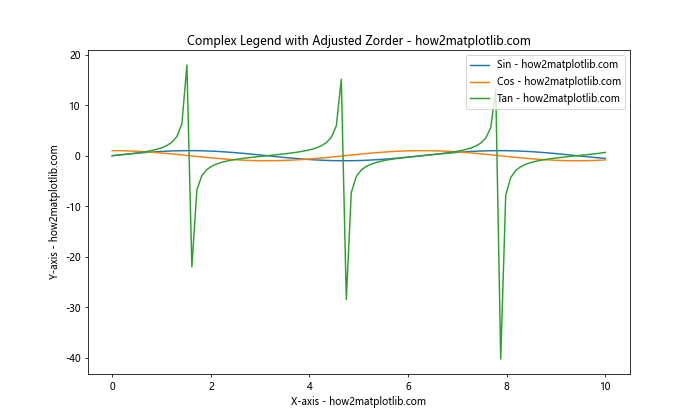
在这个例子中,我们创建了一个包含多条线的图表,然后调整了图例中线条的zorder。这允许我们控制图例中元素的视觉层次,可能用于强调某些特定的图例项。
12. 在热图中使用get_zorder()
热图通常用于显示矩阵数据,但有时我们可能需要在热图上添加其他元素。使用get_zorder()可以帮助我们控制这些额外元素的绘制顺序。以下是一个示例:
import matplotlib.pyplot as plt
import numpy as np

fig, ax = plt.subplots(figsize=(8, 6))

# 创建热图数据
data = np.random.rand(10, 10)

# 绘制热图
heatmap = ax.imshow(data, cmap='viridis')

# 在热图上添加一些点
x = np.random.randint(0, 10, 5)
y = np.random.randint(0, 10, 5)
scatter = ax.scatter(x, y, c='red', s=100)

# 获取并打印zorder值
print(f"Heatmap zorder: {heatmap.get_zorder()}")
print(f"Scatter zorder: {scatter.get_zorder()}")

# 确保散点在热图之上
scatter.set_zorder(heatmap.get_zorder() + 1)

# 添加一些文本
for i, (xi, yi) in enumerate(zip(x, y)):
    text = ax.text(xi, yi, f'P{i}', ha='center', va='center', color='white')
    text.set_zorder(scatter.get_zorder() + 1)

ax.set_title('Heatmap with Overlaid Elements - how2matplotlib.com')
plt.colorbar(heatmap, label='Value - how2matplotlib.com')

plt.show()
Output:
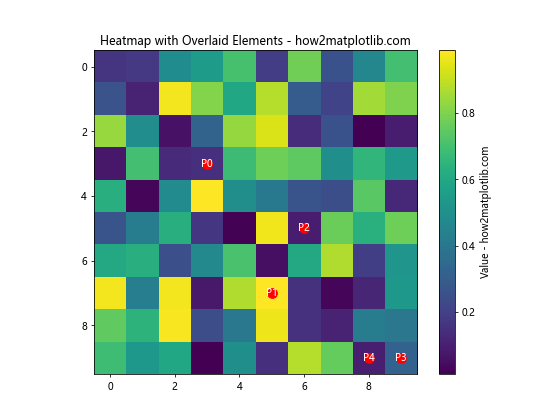
在这个例子中,我们首先创建了一个热图,然后在其上添加了一些散点和文本。通过使用get_zorder()和set_zorder(),我们确保散点显示在热图之上,而文本又显示在散点之上。
13. 在极坐标图中使用get_zorder()
极坐标图有时也需要精细控制元素的绘制顺序。以下是一个在极坐标图中使用get_zorder()的示例:
import matplotlib.pyplot as plt
import numpy as np

fig, ax = plt.subplots(figsize=(8, 8), subplot_kw=dict(projection='polar'))

# 创建一些数据
theta = np.linspace(0, 2*np.pi, 100)
r1 = np.random.rand(100) + 1
r2 = np.random.rand(100) + 2

# 绘制两条线
line1 = ax.plot(theta, r1, label='Line 1 - how2matplotlib.com')[0]
line2 = ax.plot(theta, r2, label='Line 2 - how2matplotlib.com')[0]

# 获取并打印初始zorder值
print(f"Line 1 initial zorder: {line1.get_zorder()}")
print(f"Line 2 initial zorder: {line2.get_zorder()}")

# 添加一些散点
scatter = ax.scatter(np.random.rand(20)*2*np.pi, np.random.rand(20)*3,
                     c='red', s=50, label='Points - how2matplotlib.com')

# 调整zorder
line1.set_zorder(line2.get_zorder() + 1)
scatter.set_zorder(line1.get_zorder() + 1)

print(f"Line 1 new zorder: {line1.get_zorder()}")
print(f"Scatter zorder: {scatter.get_zorder()}")

ax.set_title('Polar Plot with Adjusted Zorder - how2matplotlib.com')
ax.legend()

plt.show()
Output:
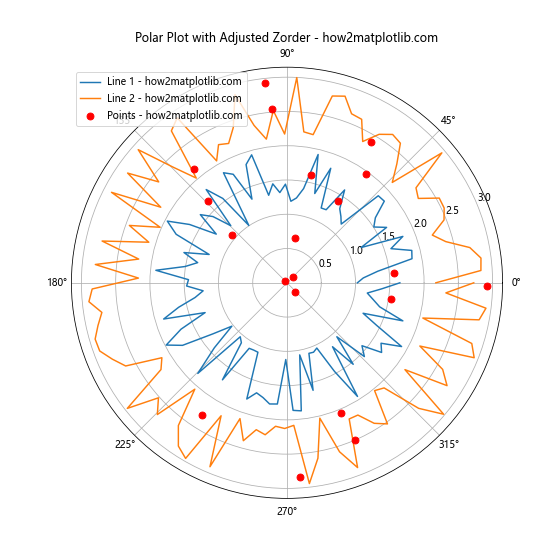
在这个极坐标图例子中,我们绘制了两条线和一些散点。通过调整zorder,我们可以控制这些元素的视觉层次,即使它们在极坐标系中的位置可能有重叠。
14. 在箱线图中使用get_zorder()
箱线图通常用于显示数据分布,但有时我们可能想要在其上添加额外的信息。使用get_zorder()可以帮助我们控制这些额外元素的显示顺序。以下是一个示例:
import matplotlib.pyplot as plt
import numpy as np

fig, ax = plt.subplots(figsize=(10, 6))

# 创建箱线图数据
data = [np.random.normal(0, std, 100) for std in range(1, 4)]

# 绘制箱线图
box_plot = ax.boxplot(data, patch_artist=True)

# 获取并打印箱子的zorder
for i, box in enumerate(box_plot['boxes']):
    print(f"Box {i} zorder: {box.get_zorder()}")

# 在箱线图上添加一些点
for i, d in enumerate(data):
    x = np.random.normal(i+1, 0.04, len(d))
    scatter = ax.scatter(x, d, alpha=0.5)
    scatter.set_zorder(box_plot['boxes'][0].get_zorder() + 1)

# 添加均值点
means = [np.mean(d) for d in data]
mean_scatter = ax.scatter(range(1, len(data)+1), means, color='red', s=100, zorder=1000)

print(f"Mean points zorder: {mean_scatter.get_zorder()}")

ax.set_xticklabels(['Group 1', 'Group 2', 'Group 3'])
ax.set_xlabel('Groups - how2matplotlib.com')
ax.set_ylabel('Values - how2matplotlib.com')
ax.set_title('Box Plot with Additional Elements - how2matplotlib.com')

plt.show()
Output:
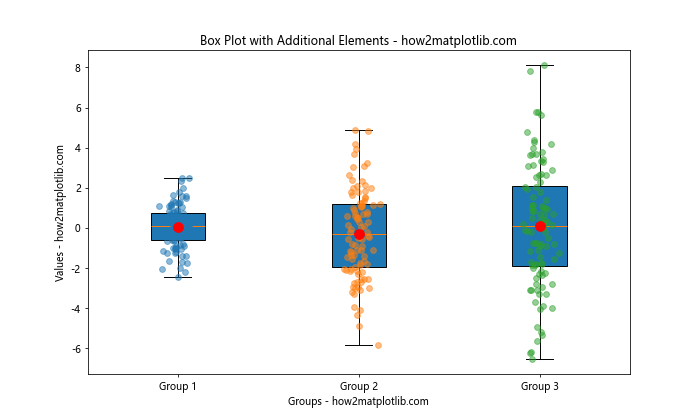
在这个例子中,我们首先创建了一个基本的箱线图,然后在其上添加了原始数据点和均值点。通过调整zorder,我们确保了额外的元素正确地显示在箱线图的上方。
15. 在等高线图中使用get_zorder()
等高线图可以展示三维数据在二维平面上的投影,但有时我们可能需要在其上添加额外的信息层。使用get_zorder()可以帮助我们管理这些层的顺序。以下是一个示例:
import matplotlib.pyplot as plt
import numpy as np

fig, ax = plt.subplots(figsize=(10, 8))

# 创建一些数据
x = np.linspace(-3, 3, 100)
y = np.linspace(-3, 3, 100)
X, Y = np.meshgrid(x, y)
Z = np.sin(X) * np.cos(Y)

# 绘制等高线
contour = ax.contourf(X, Y, Z, levels=20, cmap='viridis')

# 获取并打印等高线的zorder
print(f"Contour zorder: {contour.collections[0].get_zorder()}")

# 添加一些散点
x_scatter = np.random.uniform(-3, 3, 50)
y_scatter = np.random.uniform(-3, 3, 50)
scatter = ax.scatter(x_scatter, y_scatter, c='red', s=50)

# 设置散点的zorder
scatter.set_zorder(contour.collections[-1].get_zorder() + 1)

print(f"Scatter zorder: {scatter.get_zorder()}")

# 添加一些文本标签
for i in range(5):
    x_text = np.random.uniform(-3, 3)
    y_text = np.random.uniform(-3, 3)
    text = ax.text(x_text, y_text, f'P{i}', ha='center', va='center',
                   bbox=dict(facecolor='white', edgecolor='none', alpha=0.7))
    text.set_zorder(scatter.get_zorder() + 1)

ax.set_xlabel('X-axis - how2matplotlib.com')
ax.set_ylabel('Y-axis -how2matplotlib.com')
ax.set_title('Contour Plot with Additional Elements - how2matplotlib.com')

plt.colorbar(contour, label='Z-value - how2matplotlib.com')
plt.show()
Output:
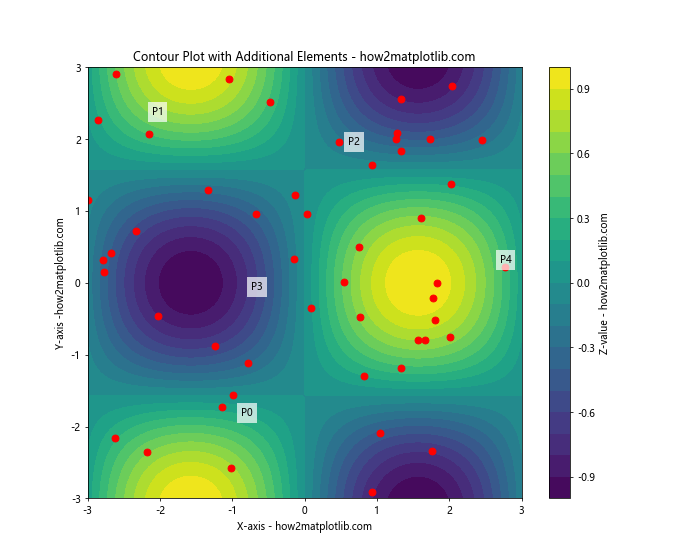
在这个例子中,我们首先创建了一个等高线图,然后在其上添加了散点和文本标签。通过使用get_zorder()和set_zorder(),我们确保散点显示在等高线之上,而文本标签又显示在散点之上。
16. 在堆叠图中使用get_zorder()
堆叠图通常用于显示多个数据系列的累积效果,但有时我们可能需要添加额外的视觉元素。使用get_zorder()可以帮助我们控制这些元素的显示顺序。以下是一个示例:
import matplotlib.pyplot as plt
import numpy as np

fig, ax = plt.subplots(figsize=(10, 6))

# 创建堆叠图数据
x = np.arange(10)
y1 = np.random.rand(10)
y2 = np.random.rand(10)
y3 = np.random.rand(10)

# 绘制堆叠图
stack = ax.stackplot(x, y1, y2, y3, labels=['Series 1 - how2matplotlib.com',
                                            'Series 2 - how2matplotlib.com',
                                            'Series 3 - how2matplotlib.com'])

# 获取并打印堆叠图的zorder
for i, poly in enumerate(stack):
    print(f"Stack {i} zorder: {poly.get_zorder()}")

# 添加一条趋势线
trend = ax.plot(x, (y1 + y2 + y3) * 0.5, 'r--', linewidth=2, label='Trend - how2matplotlib.com')[0]

# 设置趋势线的zorder
trend.set_zorder(max(poly.get_zorder() for poly in stack) + 1)

print(f"Trend line zorder: {trend.get_zorder()}")

# 添加一些标记点
markers = ax.scatter(x[::2], (y1 + y2 + y3)[::2], c='black', s=100, label='Markers - how2matplotlib.com')
markers.set_zorder(trend.get_zorder() + 1)

ax.set_xlabel('X-axis - how2matplotlib.com')
ax.set_ylabel('Y-axis - how2matplotlib.com')
ax.set_title('Stacked Plot with Additional Elements - how2matplotlib.com')
ax.legend(loc='upper left')

plt.show()
Output:
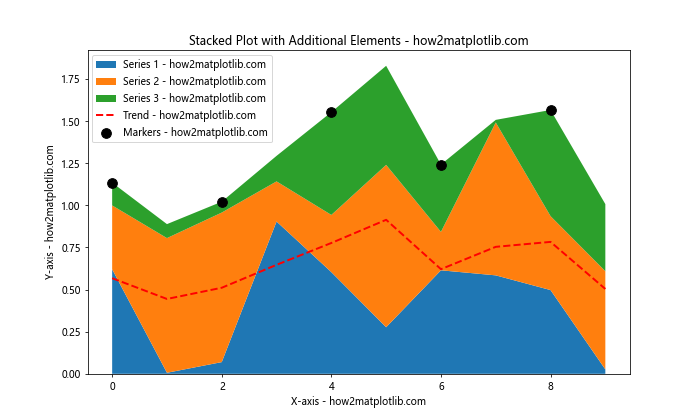
在这个例子中,我们首先创建了一个基本的堆叠图,然后添加了一条趋势线和一些标记点。通过调整zorder,我们确保趋势线显示在堆叠区域之上,而标记点又显示在趋势线之上。
17. 在饼图中使用get_zorder()
虽然饼图本身通常不需要调整zorder,但当我们想要在饼图上添加额外的注释或装饰时,了解和使用get_zorder()会很有帮助。以下是一个示例:
import matplotlib.pyplot as plt
import numpy as np

fig, ax = plt.subplots(figsize=(10, 8))

# 创建饼图数据
sizes = [15, 30, 45, 10]
labels = ['A - how2matplotlib.com', 'B - how2matplotlib.com',
          'C - how2matplotlib.com', 'D - how2matplotlib.com']
explode = (0, 0.1, 0, 0)

# 绘制饼图
pie = ax.pie(sizes, explode=explode, labels=labels, autopct='%1.1f%%',
             startangle=90, shadow=True)

# 获取并打印饼图各部分的zorder
for i, wedge in enumerate(pie[0]):
    print(f"Wedge {i} zorder: {wedge.get_zorder()}")

# 添加一个中心圆
center_circle = plt.Circle((0,0), 0.70, fc='white')
center_circle.set_zorder(max(wedge.get_zorder() for wedge in pie[0]) + 1)
ax.add_artist(center_circle)

print(f"Center circle zorder: {center_circle.get_zorder()}")

# 添加一些装饰性文本
text = ax.text(0, 0, 'Pie Chart\nhow2matplotlib.com', ha='center', va='center', fontsize=12)
text.set_zorder(center_circle.get_zorder() + 1)

ax.set_title('Pie Chart with Additional Elements - how2matplotlib.com')

plt.show()
Output:
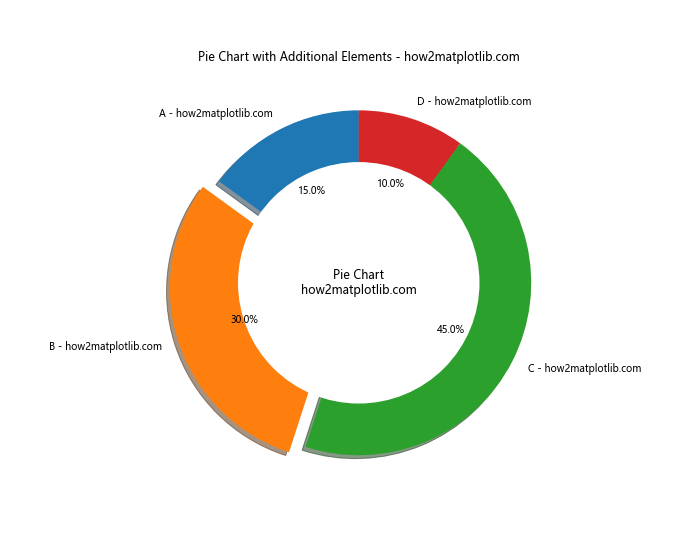
在这个例子中,我们首先创建了一个基本的饼图,然后添加了一个中心圆和一些装饰性文本。通过调整zorder,我们确保中心圆显示在饼图切片之上,而文本又显示在中心圆之上。
18. 在误差棒图中使用get_zorder()
误差棒图用于显示数据点的不确定性,但有时我们可能需要在其上添加额外的信息层。使用get_zorder()可以帮助我们管理这些层的顺序。以下是一个示例:
import matplotlib.pyplot as plt
import numpy as np

fig, ax = plt.subplots(figsize=(10, 6))

# 创建误差棒图数据
x = np.arange(0, 10, 1)
y = np.random.rand(10)
yerr = np.random.rand(10) * 0.1

# 绘制误差棒图
errorbar = ax.errorbar(x, y, yerr=yerr, fmt='o', capsize=5,
                       label='Data - how2matplotlib.com')

# 获取并打印误差棒的zorder
print(f"Errorbar zorder: {errorbar[0].get_zorder()}")

# 添加一条趋势线
trend = ax.plot(x, np.poly1d(np.polyfit(x, y, 1))(x), 'r--',
                label='Trend - how2matplotlib.com')[0]

# 设置趋势线的zorder
trend.set_zorder(errorbar[0].get_zorder() + 1)

print(f"Trend line zorder: {trend.get_zorder()}")

# 添加一些注释
for i in range(0, 10, 3):
    annotation = ax.annotate(f'Point {i}', (x[i], y[i]),
                             xytext=(5, 5), textcoords='offset points')
    annotation.set_zorder(trend.get_zorder() + 1)

ax.set_xlabel('X-axis - how2matplotlib.com')
ax.set_ylabel('Y-axis - how2matplotlib.com')
ax.set_title('Error Bar Plot with Additional Elements - how2matplotlib.com')
ax.legend()

plt.show()
Output:
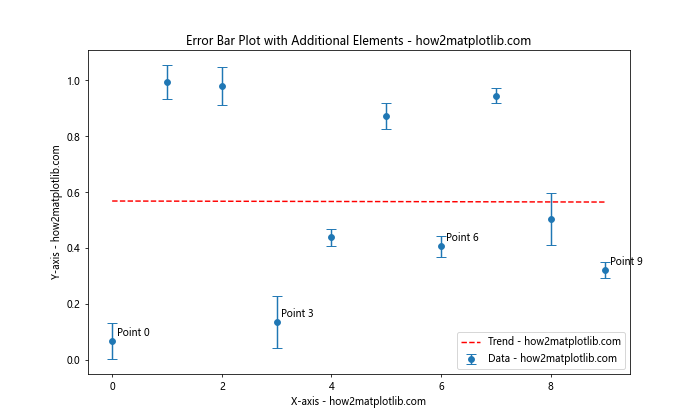
在这个例子中,我们首先创建了一个基本的误差棒图,然后添加了一条趋势线和一些注释。通过调整zorder,我们确保趋势线显示在误差棒之上,而注释又显示在趋势线之上。
结论
通过本文的详细探讨,我们深入了解了Matplotlib中get_zorder()方法的使用及其在各种图表类型中的应用。这个方法为我们提供了精确控制图形元素绘制顺序的能力,使我们能够创建更加复杂和视觉上吸引人的图表。
从简单的线图到复杂的3D图表,从静态图像到动态动画,get_zorder()方法都展现出了其强大的功能和灵活性。通过合理使用这个方法,我们可以:
- 解决元素重叠问题,确保重要信息不被遮挡。
- 创建层次感,增强图表的视觉深度。
- 动态调整元素顺序,实现更丰富的视觉效果。
- 在复杂的多元素图表中精确控制每个组件的显示。
然而,需要注意的是,过度使用或不当使用zorder可能会导致图表变得混乱或难以理解。因此,在应用这个技术时,我们应该始终牢记可视化的基本原则,确保图表清晰、直观、有效地传达信息。
总的来说,get_zorder()方法是Matplotlib工具箱中的一个强大工具,掌握它可以让我们的数据可视化技能更上一层楼,创造出更加精美和专业的图表。
 极客笔记
极客笔记