Matplotlib中的Artist.get_transform()方法:深入理解和实践应用
参考:Matplotlib.artist.Artist.get_transform() in Python
Matplotlib是Python中最流行的数据可视化库之一,它提供了丰富的绘图功能和灵活的自定义选项。在Matplotlib的架构中,Artist类是一个核心概念,它是所有可视化元素的基类。而Artist类的get_transform()方法则是一个重要的工具,用于获取和管理图形元素的坐标变换。本文将深入探讨Artist.get_transform()方法的原理、用法和实际应用,帮助读者更好地理解和使用这一强大的功能。
1. Artist类简介
在深入了解get_transform()方法之前,我们首先需要了解Artist类的基本概念。Artist类是Matplotlib中所有可视化元素的基类,包括Figure、Axes、Line2D、Text等。它定义了这些元素的共同属性和方法,如颜色、线型、透明度等。
以下是一个简单的示例,展示了如何创建一个基本的Artist对象:
import matplotlib.pyplot as plt
from matplotlib.artist import Artist

fig, ax = plt.subplots()
artist = Artist()
ax.add_artist(artist)
plt.title("Basic Artist Example - how2matplotlib.com")
plt.show()
Output:
在这个例子中,我们创建了一个空的Artist对象并将其添加到坐标轴中。虽然这个Artist对象本身不可见,但它展示了Artist类的基本用法。
2. 坐标变换的概念
在Matplotlib中,坐标变换是一个重要的概念,它决定了如何将数据坐标映射到图形坐标。get_transform()方法就是用来获取这种坐标变换的工具。
Matplotlib中主要有三种坐标系统:
- 数据坐标系:与实际数据值对应的坐标系。
- 轴坐标系:相对于坐标轴的坐标系,范围通常是0到1。
- 图形坐标系:相对于整个图形的坐标系,也是0到1的范围。
下面是一个展示不同坐标系的示例:
import matplotlib.pyplot as plt
import numpy as np

fig, ax = plt.subplots()

# 数据坐标系
ax.plot([0, 1], [0, 1], 'r-', transform=ax.transData, label='Data')

# 轴坐标系
ax.plot([0.2, 0.8], [0.2, 0.8], 'g-', transform=ax.transAxes, label='Axes')

# 图形坐标系
ax.plot([0.1, 0.9], [0.1, 0.9], 'b-', transform=fig.transFigure, label='Figure')

ax.legend()
plt.title("Coordinate Systems - how2matplotlib.com")
plt.show()
Output:
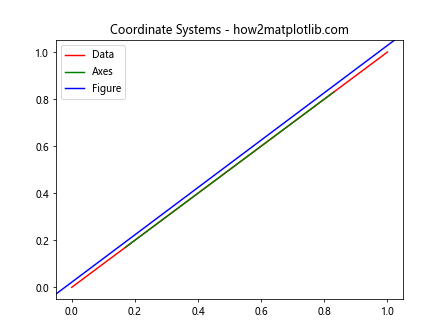
这个例子展示了三条线,分别使用数据坐标系、轴坐标系和图形坐标系绘制。
3. get_transform()方法的基本用法
Artist.get_transform()方法返回当前Artist对象使用的坐标变换。这个方法不需要任何参数,返回一个Transform对象。
以下是一个基本的使用示例:
import matplotlib.pyplot as plt
from matplotlib.patches import Rectangle

fig, ax = plt.subplots()
rect = Rectangle((0.2, 0.2), 0.6, 0.6, fill=False)
ax.add_patch(rect)

transform = rect.get_transform()
print(f"Transform type: {type(transform)}")

plt.title("get_transform() Example - how2matplotlib.com")
plt.show()
Output:
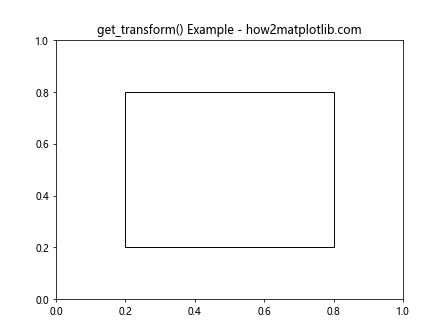
在这个例子中,我们创建了一个Rectangle对象,并使用get_transform()方法获取其坐标变换。虽然我们只是打印了变换的类型,但这个方法返回的Transform对象包含了更多有用的信息。
4. 不同Artist对象的默认变换
不同类型的Artist对象可能有不同的默认坐标变换。了解这些默认变换对于正确使用get_transform()方法非常重要。
4.1 Figure的默认变换
Figure对象的默认变换是图形坐标系(fig.transFigure)。
import matplotlib.pyplot as plt

fig = plt.figure()
fig_transform = fig.get_transform()

print(f"Figure transform: {fig_transform}")

plt.title("Figure Transform - how2matplotlib.com")
plt.show()
Output:
4.2 Axes的默认变换
Axes对象的默认变换是数据坐标系(ax.transData)。
import matplotlib.pyplot as plt

fig, ax = plt.subplots()
ax_transform = ax.get_transform()

print(f"Axes transform: {ax_transform}")

plt.title("Axes Transform - how2matplotlib.com")
plt.show()
Output:
4.3 Line2D的默认变换
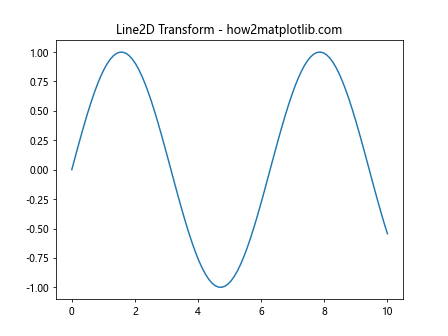
Line2D对象通常使用其所在Axes的数据坐标系作为默认变换。
import matplotlib.pyplot as plt
import numpy as np

fig, ax = plt.subplots()
x = np.linspace(0, 10, 100)
y = np.sin(x)
line = ax.plot(x, y)[0]

line_transform = line.get_transform()
print(f"Line2D transform: {line_transform}")

plt.title("Line2D Transform - how2matplotlib.com")
plt.show()
Output:
4.4 Text的默认变换
Text对象的默认变换通常是其所在Axes的数据坐标系,但也可以通过设置来使用其他坐标系。
import matplotlib.pyplot as plt

fig, ax = plt.subplots()
text = ax.text(0.5, 0.5, "how2matplotlib.com", ha='center', va='center')

text_transform = text.get_transform()
print(f"Text transform: {text_transform}")

plt.title("Text Transform - how2matplotlib.com")
plt.show()
Output:
5. 使用get_transform()进行坐标转换
get_transform()方法返回的Transform对象可以用于进行坐标转换。这在需要在不同坐标系之间转换坐标时非常有用。
import matplotlib.pyplot as plt
import numpy as np

fig, ax = plt.subplots()

# 创建一个点
point = np.array([[0.5, 0.5]])

# 获取数据坐标系到显示坐标系的变换
transform = ax.get_transform()

# 转换坐标
display_coord = transform.transform(point)

print(f"Data coordinate: {point}")
print(f"Display coordinate: {display_coord}")

ax.plot(point[0, 0], point[0, 1], 'ro')
plt.title("Coordinate Transformation - how2matplotlib.com")
plt.show()
Output:
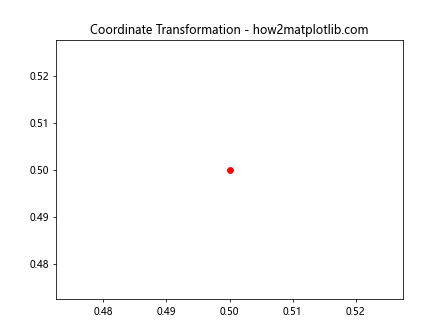
在这个例子中,我们使用get_transform()获取了从数据坐标系到显示坐标系的变换,然后使用这个变换将一个点从数据坐标转换到显示坐标。
6. 自定义变换
除了使用默认的变换,我们还可以为Artist对象设置自定义的变换。这可以通过set_transform()方法实现,然后用get_transform()方法验证。
import matplotlib.pyplot as plt
from matplotlib.transforms import Affine2D

fig, ax = plt.subplots()

# 创建一个自定义变换
custom_transform = Affine2D().rotate_deg(45) + ax.transData

# 创建一个矩形并设置自定义变换
rect = plt.Rectangle((0.2, 0.2), 0.6, 0.3, fill=False)
rect.set_transform(custom_transform)

# 验证变换
print(f"Custom transform: {rect.get_transform()}")

ax.add_patch(rect)
plt.title("Custom Transform - how2matplotlib.com")
plt.show()
Output:
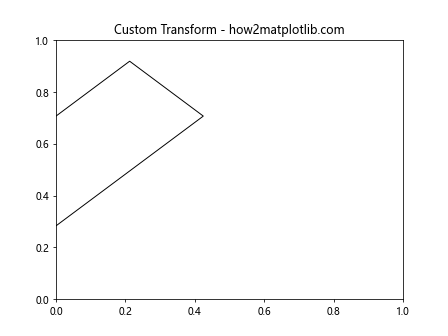
在这个例子中,我们创建了一个自定义的变换,它将矩形旋转45度,然后应用数据坐标系变换。我们使用set_transform()方法设置这个变换,然后用get_transform()方法验证。
7. 组合变换
Matplotlib允许我们组合多个变换。get_transform()方法可以用来获取这些组合变换。
import matplotlib.pyplot as plt
from matplotlib.transforms import Affine2D

fig, ax = plt.subplots()

# 创建一个组合变换
combined_transform = Affine2D().scale(0.5).rotate_deg(30) + ax.transData

# 创建一个使用组合变换的文本
text = ax.text(0.5, 0.5, "how2matplotlib.com", transform=combined_transform)

# 获取并打印变换
print(f"Combined transform: {text.get_transform()}")

plt.title("Combined Transform - how2matplotlib.com")
plt.show()
Output:
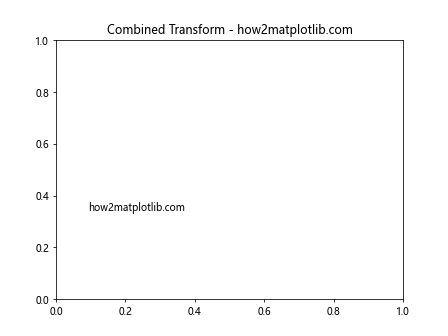
在这个例子中,我们创建了一个组合变换,它先将对象缩小一半,然后旋转30度,最后应用数据坐标系变换。我们将这个变换应用到一个文本对象上,然后使用get_transform()方法获取这个组合变换。
8. 在动画中使用get_transform()
get_transform()方法在创建动画时也非常有用,特别是当我们需要在动画过程中更新对象的变换时。
import matplotlib.pyplot as plt
import matplotlib.animation as animation
from matplotlib.transforms import Affine2D

fig, ax = plt.subplots()

# 创建一个矩形
rect = plt.Rectangle((0.5, 0.5), 0.2, 0.2, fill=False)
ax.add_patch(rect)

def animate(frame):
    # 创建一个旋转变换
    angle = frame * 5  # 每帧旋转5度
    transform = Affine2D().rotate_deg_around(0.5, 0.5, angle) + ax.transData
    rect.set_transform(transform)

    # 打印当前变换
    print(f"Frame {frame}, transform: {rect.get_transform()}")

    return rect,

ani = animation.FuncAnimation(fig, animate, frames=72, interval=50, blit=True)

plt.title("Animation with get_transform() - how2matplotlib.com")
plt.show()
Output:
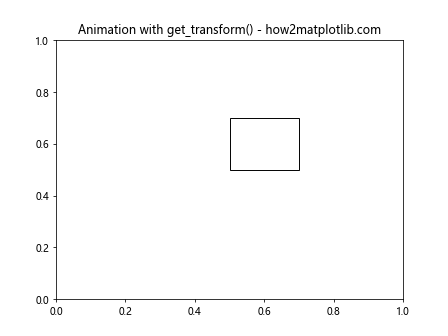
在这个动画示例中,我们创建了一个矩形,并在每一帧中更新其旋转变换。我们使用get_transform()方法在每一帧打印当前的变换,这对于调试和理解动画过程非常有用。
9. 在交互式绘图中使用get_transform()
get_transform()方法在创建交互式绘图时也很有用,特别是当我们需要根据用户输入动态更新图形元素的位置或形状时。
import matplotlib.pyplot as plt
from matplotlib.widgets import Slider

fig, ax = plt.subplots()

# 创建一个矩形
rect = plt.Rectangle((0.3, 0.3), 0.4, 0.4, fill=False)
ax.add_patch(rect)

# 创建一个滑块
axscale = plt.axes([0.2, 0.02, 0.6, 0.03])
scale_slider = Slider(axscale, 'Scale', 0.1, 2.0, valinit=1)

def update(val):
    # 获取当前变换
    current_transform = rect.get_transform()

    # 创建新的缩放变换
    scale_transform = current_transform + Affine2D().scale(val)

    # 设置新的变换
    rect.set_transform(scale_transform)

    # 打印新的变换
    print(f"New transform: {rect.get_transform()}")

    fig.canvas.draw_idle()

scale_slider.on_changed(update)

plt.title("Interactive Plot with get_transform() - how2matplotlib.com")
plt.show()
Output:
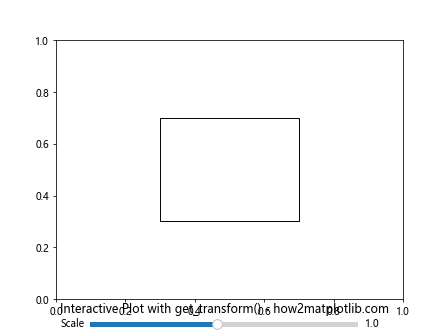
在这个交互式示例中,我们创建了一个矩形和一个滑块。当用户移动滑块时,矩形的大小会相应地改变。我们使用get_transform()方法获取当前的变换,然后基于这个变换创建一个新的缩放变换。这个例子展示了如何在交互式环境中动态更新和获取变换。
10. 处理复杂的坐标变换
在某些情况下,我们可能需要处理更复杂的坐标变换,例如在极坐标系中。get_transform()方法在这种情况下也能派上用场。
import matplotlib.pyplot as plt
import numpy as np

fig, ax = plt.subplots(subplot_kw=dict(projection='polar'))

# 创建一些数据
theta = np.linspace(0, 2*np.pi, 100)
r = np.sin(2*theta)

# 绘制极坐标图
line, = ax.plot(theta, r)

# 获取变换
transform = line.get_transform()
print(f"Polar transform: {transform}")

# 转换一些点
points = np.array([[np.pi/4, 0.5], [np.pi/2, 1]])
display_points = transform.transform(points)

print(f"Polar points: {points}")
print(f"Display points: {display_points}")

plt.title("Complex Coordinate Transform - how2matplotlib.com")
plt.show()
Output:
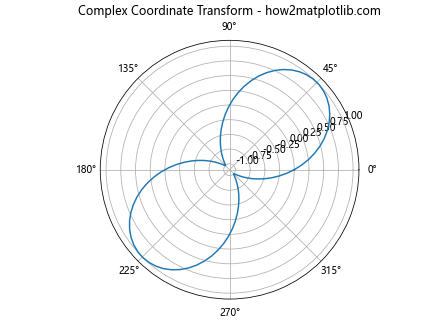
在这个例子中,我们创建了一个极坐标图,并使用get_transform()方法获取了从极坐标到显示坐标的变换。我们还展示了如何使用这个变换将极坐标点转换为显示坐标点。
11. 在3D图形中使用get_transform()
get_transform()方法也可以在3D图形中使用,尽管3D变换比2D变换更复杂。
import matplotlib.pyplot as plt
from mpl_toolkits.mplot3d import Axes3D
import numpy as np

fig = plt.figure()
ax = fig.add_subplot(111, projection='3d')

# 创建一些3D数据
x = np.linspace(-5, 5, 100)
y = np.linspace(-5, 5, 100)
X, Y = np.meshgrid(x, y)
Z = np.sin(np.sqrt(X**2 + Y**2))

# 绘制3D表面
surface = ax.plot_surface(X, Y, Z)

# 获取3D变换
transform = surface.get_transform()
print(f"3D transform: {transform}")

# 转换一些3D点
points = np.array([[0, 0, 0], [1, 1, 1]])
display_points = transform.transform(points)

print(f"3D points: {points}")
print(f"Display points: {display_points}")

plt.title("3D Transform - how2matplotlib.com")
plt.show()
Output:
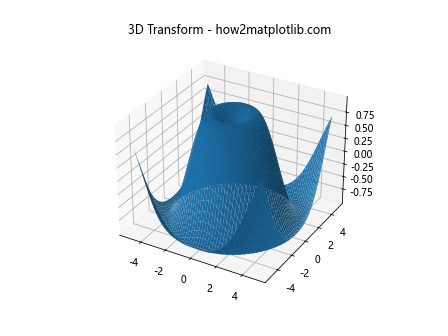
在这个3D示例中,我们创建了一个3D表面图,并使用get_transform()方法获取了从3D坐标到显示坐标的变换。我们还展示了如何使用这个变换将3D点转换为显示坐标点。
12. 在子图中使用get_transform()
当我们使用子图时,每个子图都有自己的坐标系统。get_transform()方法可以帮助我们理解和操作这些不同的坐标系统。
import matplotlib.pyplot as plt
import numpy as np

fig, (ax1, ax2) = plt.subplots(1, 2, figsize=(10, 5))

# 在第一个子图中绘制
line1, = ax1.plot([0, 1], [0, 1], 'r-')
transform1 = line1.get_transform()
print(f"Transform of subplot 1: {transform1}")

# 在第二个子图中绘制
line2, = ax2.plot([0, 1], [0, 1], 'b-')
transform2 = line2.get_transform()
print(f"Transform of subplot 2: {transform2}")

# 转换点
point = np.array([[0.5, 0.5]])
display_point1 = transform1.transform(point)
display_point2 = transform2.transform(point)

print(f"Display point in subplot 1: {display_point1}")
print(f"Display point in subplot 2: {display_point2}")

plt.suptitle("Subplots and Transforms - how2matplotlib.com")
plt.show()
Output:
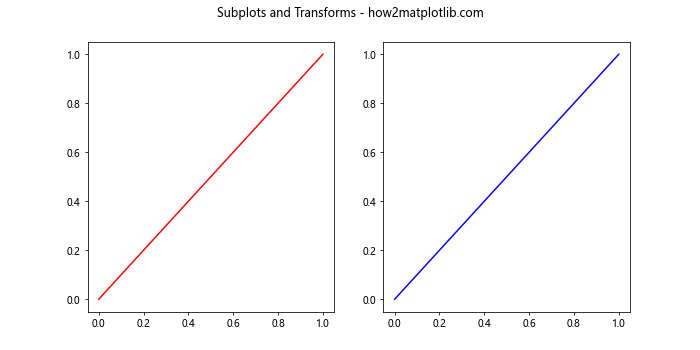
这个例子展示了如何在包含多个子图的图形中使用get_transform()方法。我们可以看到,尽管两个子图中的数据点相同,但它们在显示坐标系中的位置是不同的。
13. 在图例中使用get_transform()
图例也是Artist对象,因此我们也可以使用get_transform()方法来操作图例的位置和大小。
import matplotlib.pyplot as plt
import numpy as np
from matplotlib.transforms import Affine2D

fig, ax = plt.subplots()

# 绘制一些数据
x = np.linspace(0, 10, 100)
ax.plot(x, np.sin(x), label='sin(x)')
ax.plot(x, np.cos(x), label='cos(x)')

# 创建图例
legend = ax.legend()

# 获取图例的变换
legend_transform = legend.get_transform()
print(f"Legend transform: {legend_transform}")

# 创建一个新的变换来移动图例
new_transform = legend_transform + Affine2D().translate(100, 100)
legend.set_transform(new_transform)

# 验证新的变换
print(f"New legend transform: {legend.get_transform()}")

plt.title("Legend Transform - how2matplotlib.com")
plt.show()
Output:
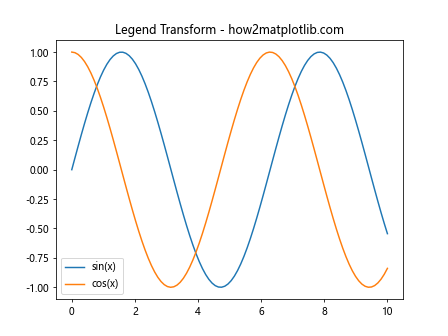
在这个例子中,我们首先获取了图例的原始变换,然后创建了一个新的变换来移动图例。我们使用set_transform()方法应用这个新的变换,并用get_transform()方法验证变化。
14. 在自定义Artist中使用get_transform()
如果我们创建了自定义的Artist类,我们也可以实现get_transform()方法来返回自定义的变换。
import matplotlib.pyplot as plt
from matplotlib.artist import Artist
from matplotlib.transforms import Affine2D

class CustomArtist(Artist):
    def __init__(self):
        super().__init__()
        self._transform = Affine2D()

    def draw(self, renderer):
        # 在这里实现绘制逻辑
        pass

    def get_transform(self):
        return self._transform + self.axes.transData

fig, ax = plt.subplots()

custom_artist = CustomArtist()
ax.add_artist(custom_artist)

print(f"Custom artist transform: {custom_artist.get_transform()}")

plt.title("Custom Artist Transform - how2matplotlib.com")
plt.show()
Output:
在这个例子中,我们创建了一个自定义的Artist类,并实现了get_transform()方法。这个方法返回一个组合变换,包括一个自定义的Affine2D变换和坐标轴的数据变换。
15. 使用get_transform()进行调试
get_transform()方法在调试复杂的图形时非常有用,特别是当我们需要理解不同元素之间的空间关系时。
import matplotlib.pyplot as plt
import numpy as np

fig, ax = plt.subplots()

# 创建一些数据
x = np.linspace(0, 10, 100)
y1 = np.sin(x)
y2 = np.cos(x)

# 绘制数据
line1, = ax.plot(x, y1, label='sin(x)')
line2, = ax.plot(x, y2, label='cos(x)')

# 添加一些文本
text = ax.text(5, 0, "how2matplotlib.com", ha='center')

# 打印各元素的变换
print(f"Line1 transform: {line1.get_transform()}")
print(f"Line2 transform: {line2.get_transform()}")
print(f"Text transform: {text.get_transform()}")
print(f"Axes transform: {ax.get_transform()}")
print(f"Figure transform: {fig.get_transform()}")

plt.title("Debugging with get_transform() - how2matplotlib.com")
plt.legend()
plt.show()
Output:
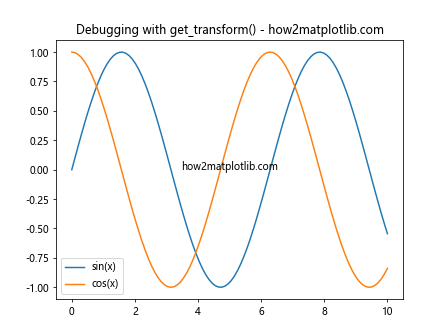
在这个调试示例中,我们创建了一个包含多个元素的图形,并打印出每个元素的变换。这可以帮助我们理解每个元素是如何定位的,以及它们之间的关系。
结论
Artist.get_transform()方法是Matplotlib中一个强大而灵活的工具,它允许我们获取和操作图形元素的坐标变换。通过本文的详细介绍和丰富的示例,我们深入了解了这个方法的工作原理和各种应用场景。从基本的坐标变换到复杂的3D图形,从静态图表到动画和交互式绘图,get_transform()方法都展现出了其强大的功能和广泛的适用性。
掌握get_transform()方法不仅可以帮助我们更精确地控制图形元素的位置和形状,还能让我们更深入地理解Matplotlib的工作机制。无论是进行数据可视化、科学绘图,还是创建复杂的图形界面,get_transform()方法都是一个不可或缺的工具。
通过实践和探索,读者可以进一步发掘get_transform()方法的潜力,创造出更加精美和富有表现力的图形。希望本文能为读者提供有价值的参考,帮助大家在Matplotlib的使用过程中更好地利用这个强大的功能。
 极客笔记
极客笔记