Matplotlib中Artist对象的get_gid()方法详解与应用
参考:Matplotlib.artist.Artist.get_gid() in Python
Matplotlib是Python中最流行的数据可视化库之一,它提供了丰富的绘图功能和灵活的自定义选项。在Matplotlib的架构中,Artist对象扮演着重要的角色,它是所有可视化元素的基类。本文将深入探讨Artist对象的get_gid()方法,这是一个用于获取图形元素唯一标识符的重要方法。我们将详细介绍get_gid()方法的用法、应用场景以及相关的高级技巧,帮助读者更好地理解和使用这个方法来增强Matplotlib图表的交互性和可维护性。
1. Artist对象简介
在深入了解get_gid()方法之前,我们首先需要了解Matplotlib中的Artist对象。Artist是Matplotlib中所有可视化元素的基类,包括图形、轴、线条、文本等。每个Artist对象都有一些共同的属性和方法,get_gid()就是其中之一。
以下是一个简单的示例,展示了如何创建一个基本的Artist对象:
import matplotlib.pyplot as plt
import matplotlib.patches as patches

fig, ax = plt.subplots()
circle = patches.Circle((0.5, 0.5), 0.2, fill=False)
ax.add_patch(circle)
ax.set_title("how2matplotlib.com - Basic Artist Example")
plt.show()
Output:
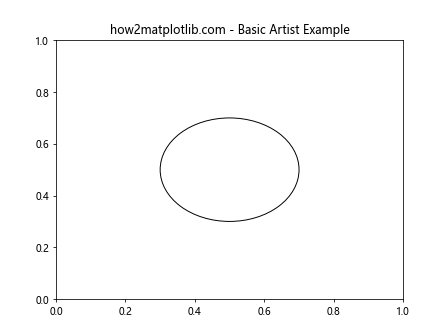
在这个例子中,我们创建了一个Circle对象,它是Artist的一个子类。我们将这个圆添加到坐标轴中,形成了一个简单的图表。
2. get_gid()方法介绍
get_gid()是Artist类的一个方法,用于获取图形元素的组标识符(Group ID)。这个标识符可以用来唯一标识一个Artist对象,便于后续的操作和管理。
下面是一个使用get_gid()方法的基本示例:
import matplotlib.pyplot as plt
import matplotlib.patches as patches

fig, ax = plt.subplots()
circle = patches.Circle((0.5, 0.5), 0.2, fill=False)
circle.set_gid("how2matplotlib.com_circle")
ax.add_patch(circle)

gid = circle.get_gid()
print(f"The GID of the circle is: {gid}")

ax.set_title("how2matplotlib.com - get_gid() Example")
plt.show()
Output:
在这个例子中,我们首先为圆形对象设置了一个GID,然后使用get_gid()方法获取并打印这个GID。这个方法返回我们之前设置的字符串”how2matplotlib.com_circle”。
3. get_gid()方法的应用场景
get_gid()方法在许多场景下都非常有用,特别是在处理复杂图表或需要交互功能时。以下是一些常见的应用场景:
3.1 图形元素的选择和操作
当我们需要在图表中选择和操作特定的元素时,get_gid()方法可以帮助我们精确定位目标元素。
import matplotlib.pyplot as plt
import matplotlib.patches as patches

fig, ax = plt.subplots()

circle1 = patches.Circle((0.3, 0.3), 0.1, fill=True, color='red')
circle1.set_gid("how2matplotlib.com_circle1")
ax.add_patch(circle1)

circle2 = patches.Circle((0.7, 0.7), 0.1, fill=True, color='blue')
circle2.set_gid("how2matplotlib.com_circle2")
ax.add_patch(circle2)

for artist in ax.get_children():
    if isinstance(artist, patches.Circle) and artist.get_gid() == "how2matplotlib.com_circle1":
        artist.set_radius(0.15)

ax.set_title("how2matplotlib.com - Selecting Elements by GID")
plt.show()
Output:
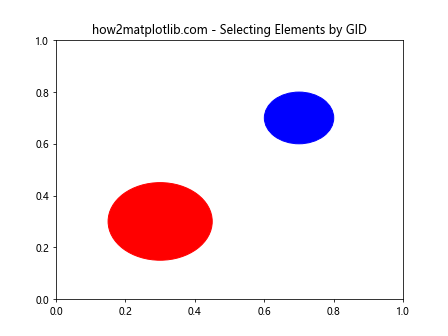
在这个例子中,我们创建了两个圆,并为它们分别设置了不同的GID。然后,我们遍历坐标轴中的所有子元素,找到GID为”how2matplotlib.com_circle1″的圆,并修改其半径。
3.2 交互式图表中的元素识别
在创建交互式图表时,get_gid()方法可以帮助我们识别用户点击或悬停的元素。
import matplotlib.pyplot as plt
import matplotlib.patches as patches

fig, ax = plt.subplots()

circle = patches.Circle((0.5, 0.5), 0.2, fill=True, color='green')
circle.set_gid("how2matplotlib.com_interactive_circle")
ax.add_patch(circle)

def on_click(event):
    if event.inaxes is not None:
        for artist in event.inaxes.get_children():
            if isinstance(artist, patches.Circle) and artist.contains(event)[0]:
                print(f"Clicked on circle with GID: {artist.get_gid()}")

fig.canvas.mpl_connect('button_press_event', on_click)

ax.set_title("how2matplotlib.com - Interactive Element Identification")
plt.show()
Output:
这个例子演示了如何在交互式图表中使用get_gid()方法。当用户点击圆形时,程序会打印出被点击元素的GID。
3.3 动画中的元素追踪
在创建动画时,get_gid()方法可以帮助我们追踪和更新特定的元素。
import matplotlib.pyplot as plt
import matplotlib.animation as animation
import matplotlib.patches as patches

fig, ax = plt.subplots()

circle = patches.Circle((0.5, 0.5), 0.1, fill=True, color='purple')
circle.set_gid("how2matplotlib.com_animated_circle")
ax.add_patch(circle)

def animate(frame):
    for artist in ax.get_children():
        if isinstance(artist, patches.Circle) and artist.get_gid() == "how2matplotlib.com_animated_circle":
            artist.center = (0.5 + 0.1 * frame, 0.5)
    return ax.get_children()

anim = animation.FuncAnimation(fig, animate, frames=10, interval=200, blit=True)

ax.set_title("how2matplotlib.com - Animated Element Tracking")
plt.show()
Output:
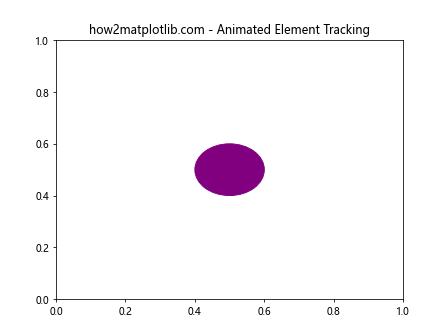
在这个动画示例中,我们使用get_gid()方法来识别和更新特定的圆形元素,使其在动画过程中移动。
4. get_gid()方法的高级用法
除了基本的应用场景,get_gid()方法还有一些高级用法,可以帮助我们更灵活地管理和操作图表元素。
4.1 批量设置和获取GID
当处理大量图形元素时,我们可以批量设置和获取GID,以提高效率。
import matplotlib.pyplot as plt
import matplotlib.patches as patches

fig, ax = plt.subplots()

circles = []
for i in range(5):
    circle = patches.Circle((0.1 + i*0.2, 0.5), 0.05, fill=True)
    circle.set_gid(f"how2matplotlib.com_circle_{i}")
    ax.add_patch(circle)
    circles.append(circle)

gids = [circle.get_gid() for circle in circles]
print("GIDs of all circles:", gids)

ax.set_title("how2matplotlib.com - Batch GID Operations")
plt.show()
Output:
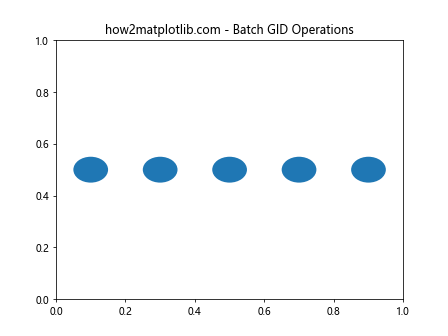
这个例子展示了如何为多个圆形对象批量设置GID,并一次性获取所有的GID。
4.2 使用GID进行图层管理
GID可以用于管理图表中的不同图层,方便我们控制元素的显示和隐藏。
import matplotlib.pyplot as plt
import matplotlib.patches as patches

fig, ax = plt.subplots()

layer1 = [patches.Circle((0.3, 0.3), 0.1, fill=True, color='red'),
          patches.Rectangle((0.5, 0.5), 0.2, 0.3, fill=True, color='blue')]

layer2 = [patches.Circle((0.7, 0.7), 0.1, fill=True, color='green'),
          patches.Rectangle((0.1, 0.1), 0.2, 0.2, fill=True, color='yellow')]

for shape in layer1:
    shape.set_gid("how2matplotlib.com_layer1")
    ax.add_patch(shape)

for shape in layer2:
    shape.set_gid("how2matplotlib.com_layer2")
    ax.add_patch(shape)

def toggle_layer(layer_gid):
    for artist in ax.get_children():
        if isinstance(artist, patches.Patch) and artist.get_gid() == layer_gid:
            artist.set_visible(not artist.get_visible())
    plt.draw()

# 使用这个函数来切换图层的可见性
# toggle_layer("how2matplotlib.com_layer1")
# toggle_layer("how2matplotlib.com_layer2")

ax.set_title("how2matplotlib.com - Layer Management with GID")
plt.show()
Output:
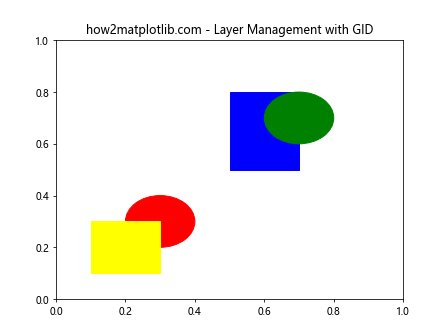
在这个例子中,我们创建了两个图层,每个图层包含不同的形状。通过设置相同的GID,我们可以轻松地控制整个图层的显示和隐藏。
4.3 结合事件处理使用GID
我们可以将get_gid()方法与Matplotlib的事件处理系统结合使用,创建更复杂的交互式图表。
import matplotlib.pyplot as plt
import matplotlib.patches as patches

fig, ax = plt.subplots()

shapes = [
    patches.Circle((0.3, 0.3), 0.1, fill=True, color='red', gid="how2matplotlib.com_circle"),
    patches.Rectangle((0.5, 0.5), 0.2, 0.2, fill=True, color='blue', gid="how2matplotlib.com_rectangle"),
    patches.Polygon([(0.7, 0.1), (0.8, 0.3), (0.9, 0.1)], fill=True, color='green', gid="how2matplotlib.com_triangle")
]

for shape in shapes:
    ax.add_patch(shape)

def on_hover(event):
    if event.inaxes is not None:
        for artist in event.inaxes.get_children():
            if isinstance(artist, patches.Patch) and artist.contains(event)[0]:
                gid = artist.get_gid()
                ax.set_title(f"Hovering over: {gid}")
                fig.canvas.draw_idle()
                return
    ax.set_title("how2matplotlib.com - Hover Interaction")
    fig.canvas.draw_idle()

fig.canvas.mpl_connect('motion_notify_event', on_hover)

plt.show()
Output:
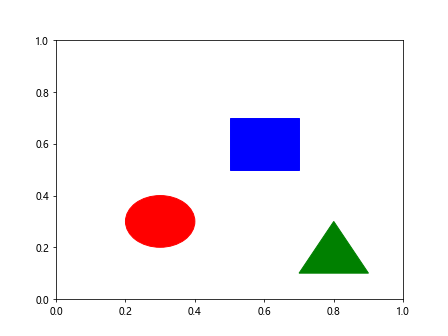
这个例子展示了如何使用get_gid()方法来识别鼠标悬停的图形元素,并更新图表标题来显示当前悬停的元素GID。
5. get_gid()方法的注意事项和最佳实践
在使用get_gid()方法时,有一些注意事项和最佳实践可以帮助我们更有效地使用这个功能:
5.1 GID的唯一性
确保为每个需要单独识别的元素设置唯一的GID。重复的GID可能会导致混淆和错误。
import matplotlib.pyplot as plt
import matplotlib.patches as patches

fig, ax = plt.subplots()

circle1 = patches.Circle((0.3, 0.3), 0.1, fill=True, color='red')
circle1.set_gid("how2matplotlib.com_unique_circle_1")

circle2 = patches.Circle((0.7, 0.7), 0.1, fill=True, color='blue')
circle2.set_gid("how2matplotlib.com_unique_circle_2")

ax.add_patch(circle1)
ax.add_patch(circle2)

print(f"Circle 1 GID: {circle1.get_gid()}")
print(f"Circle 2 GID: {circle2.get_gid()}")

ax.set_title("how2matplotlib.com - Unique GIDs")
plt.show()
Output:
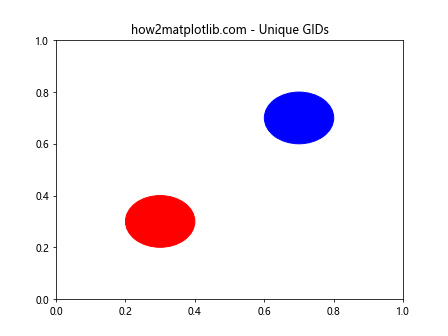
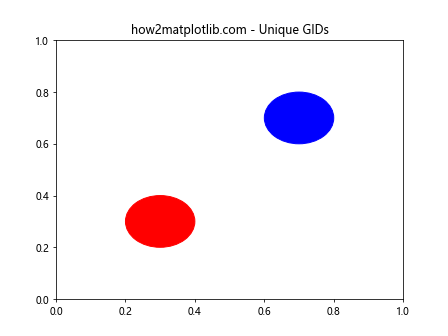
这个例子展示了如何为不同的圆形对象设置唯一的GID。
5.2 GID命名规范
采用一致的命名规范可以使GID更易读和管理。例如,可以使用前缀来区分不同类型的元素。
import matplotlib.pyplot as plt
import matplotlib.patches as patches

fig, ax = plt.subplots()

circle = patches.Circle((0.3, 0.3), 0.1, fill=True, color='red')
circle.set_gid("how2matplotlib.com_shape_circle")

rectangle = patches.Rectangle((0.5, 0.5), 0.2, 0.2, fill=True, color='blue')
rectangle.set_gid("how2matplotlib.com_shape_rectangle")

triangle = patches.Polygon([(0.7, 0.1), (0.8, 0.3), (0.9, 0.1)], fill=True, color='green')
triangle.set_gid("how2matplotlib.com_shape_triangle")

ax.add_patch(circle)
ax.add_patch(rectangle)
ax.add_patch(triangle)

for artist in ax.get_children():
    if isinstance(artist, patches.Patch):
        print(f"Shape GID: {artist.get_gid()}")

ax.set_title("how2matplotlib.com - GID Naming Convention")
plt.show()
Output:
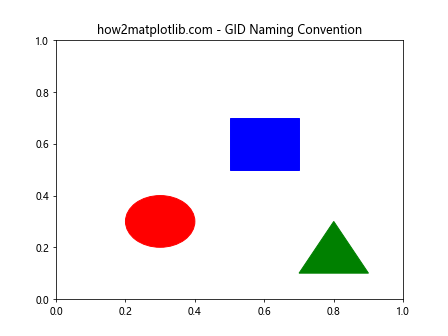
在这个例子中,我们为不同的形状使用了统一的前缀”how2matplotlib.com_shape_”,使GID更具可读性和一致性。
5.3 性能考虑
在处理大量元素时,频繁使用get_gid()方法可能会影响性能。在这种情况下,可以考虑缓存GID或使用其他标识方法。
import matplotlib.pyplot as plt
import matplotlib.patches as patches
import time

fig, ax = plt.subplots()

start_time = time.time```python
start_time = time.time()

circles = []
for i in range(1000):
    circle = patches.Circle((0.001 * i, 0.5), 0.001, fill=True)
    circle.set_gid(f"how2matplotlib.com_circle_{i}")
    ax.add_patch(circle)
    circles.append(circle)

end_time = time.time()
print(f"Time to create and set GIDs: {end_time - start_time:.4f} seconds")

# 缓存GID
start_time = time.time()
gid_cache = {circle: circle.get_gid() for circle in circles}
end_time = time.time()
print(f"Time to cache GIDs: {end_time - start_time:.4f} seconds")

# 使用缓存
start_time = time.time()
for circle in circles:
    gid = gid_cache[circle]
end_time = time.time()
print(f"Time to retrieve GIDs from cache: {end_time - start_time:.4f} seconds")

ax.set_title("how2matplotlib.com - Performance Considerations")
plt.show()
这个例子展示了在处理大量元素时,缓存GID可以显著提高性能。
6. get_gid()方法与其他Artist方法的结合使用
get_gid()方法通常与其他Artist方法结合使用,以实现更复杂的功能。以下是一些常见的组合:
6.1 结合set_gid()方法
set_gid()方法是get_gid()的配套方法,用于设置Artist对象的GID。
import matplotlib.pyplot as plt
import matplotlib.patches as patches

fig, ax = plt.subplots()

circle = patches.Circle((0.5, 0.5), 0.2, fill=True, color='purple')
circle.set_gid("how2matplotlib.com_purple_circle")
ax.add_patch(circle)

print(f"Initial GID: {circle.get_gid()}")

circle.set_gid("how2matplotlib.com_updated_circle")
print(f"Updated GID: {circle.get_gid()}")

ax.set_title("how2matplotlib.com - set_gid() and get_gid()")
plt.show()
Output:
这个例子展示了如何使用set_gid()方法设置GID,然后使用get_gid()方法获取更新后的GID。
6.2 结合get_label()方法
get_label()方法返回Artist对象的标签,这可以与get_gid()方法结合使用,提供更多的元素信息。
import matplotlib.pyplot as plt
import matplotlib.patches as patches

fig, ax = plt.subplots()

circle = patches.Circle((0.5, 0.5), 0.2, fill=True, color='orange')
circle.set_gid("how2matplotlib.com_orange_circle")
circle.set_label("Orange Circle")
ax.add_patch(circle)

print(f"GID: {circle.get_gid()}")
print(f"Label: {circle.get_label()}")

ax.set_title("how2matplotlib.com - get_gid() and get_label()")
plt.legend()
plt.show()
Output:
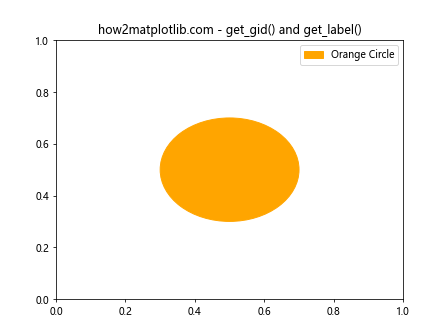
在这个例子中,我们同时使用了get_gid()和get_label()方法来获取圆形对象的完整信息。
6.3 结合get_zorder()方法
get_zorder()方法返回Artist对象的z-order值,这决定了元素的绘制顺序。结合get_gid()方法,我们可以管理元素的层级关系。
import matplotlib.pyplot as plt
import matplotlib.patches as patches

fig, ax = plt.subplots()

circle1 = patches.Circle((0.5, 0.5), 0.2, fill=True, color='red', zorder=1)
circle1.set_gid("how2matplotlib.com_bottom_circle")
ax.add_patch(circle1)

circle2 = patches.Circle((0.6, 0.6), 0.2, fill=True, color='blue', zorder=2)
circle2.set_gid("how2matplotlib.com_top_circle")
ax.add_patch(circle2)

for artist in ax.get_children():
    if isinstance(artist, patches.Circle):
        print(f"GID: {artist.get_gid()}, Z-order: {artist.get_zorder()}")

ax.set_title("how2matplotlib.com - get_gid() and get_zorder()")
plt.show()
Output:
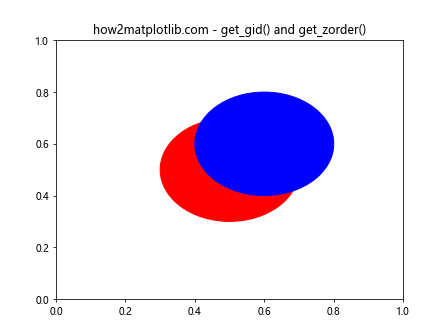
这个例子展示了如何结合使用get_gid()和get_zorder()方法来管理和显示元素的层级关系。
7. get_gid()方法在不同类型的图表中的应用
get_gid()方法不仅适用于简单的形状,还可以应用于各种类型的Matplotlib图表。以下是一些在不同图表类型中使用get_gid()方法的示例:
7.1 在折线图中使用get_gid()
import matplotlib.pyplot as plt

fig, ax = plt.subplots()

line1, = ax.plot([1, 2, 3, 4], [1, 4, 2, 3], label='Line 1')
line1.set_gid("how2matplotlib.com_line1")

line2, = ax.plot([1, 2, 3, 4], [2, 3, 4, 1], label='Line 2')
line2.set_gid("how2matplotlib.com_line2")

for line in ax.get_lines():
    print(f"Line GID: {line.get_gid()}")

ax.set_title("how2matplotlib.com - get_gid() in Line Plot")
ax.legend()
plt.show()
Output:
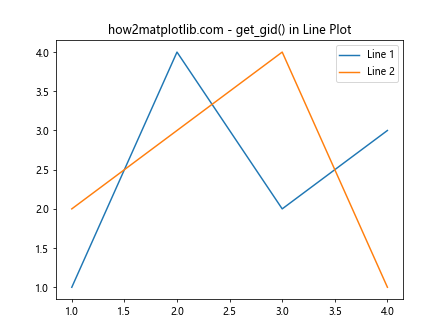
这个例子展示了如何在折线图中为每条线设置和获取GID。
7.2 在柱状图中使用get_gid()
import matplotlib.pyplot as plt
import numpy as np

fig, ax = plt.subplots()

x = np.arange(3)
heights = [3, 7, 5]
bars = ax.bar(x, heights)

for i, bar in enumerate(bars):
    bar.set_gid(f"how2matplotlib.com_bar_{i}")
    print(f"Bar {i} GID: {bar.get_gid()}")

ax.set_title("how2matplotlib.com - get_gid() in Bar Plot")
plt.show()
Output:
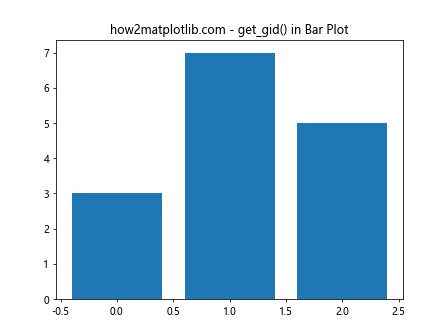
这个例子展示了如何在柱状图中为每个柱子设置和获取GID。
7.3 在散点图中使用get_gid()
import matplotlib.pyplot as plt
import numpy as np

fig, ax = plt.subplots()

x = np.random.rand(50)
y = np.random.rand(50)
colors = np.random.rand(50)
sizes = 1000 * np.random.rand(50)

scatter = ax.scatter(x, y, c=colors, s=sizes, alpha=0.5)
scatter.set_gid("how2matplotlib.com_scatter_points")

print(f"Scatter plot GID: {scatter.get_gid()}")

ax.set_title("how2matplotlib.com - get_gid() in Scatter Plot")
plt.show()
Output:
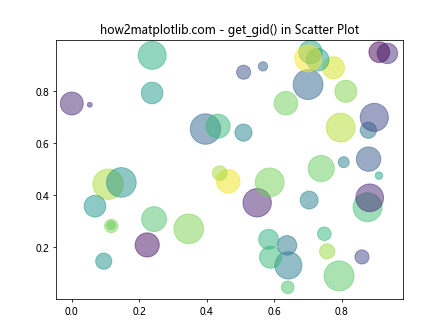
这个例子展示了如何在散点图中为整个散点集合设置和获取GID。
8. get_gid()方法在自定义可视化中的应用
get_gid()方法在创建自定义可视化时也非常有用,特别是当我们需要管理复杂的图表元素时。以下是一个更复杂的例子,展示了如何在自定义可视化中使用get_gid()方法:
import matplotlib.pyplot as plt
import matplotlib.patches as patches
import numpy as np

fig, ax = plt.subplots(figsize=(10, 6))

# 创建背景
background = patches.Rectangle((0, 0), 1, 1, fill=True, color='lightgray')
background.set_gid("how2matplotlib.com_background")
ax.add_patch(background)

# 创建多个圆形
np.random.seed(42)
circles = []
for i in range(20):
    x, y = np.random.rand(2)
    size = np.random.uniform(0.05, 0.1)
    color = np.random.rand(3,)
    circle = patches.Circle((x, y), size, fill=True, color=color, alpha=0.7)
    circle.set_gid(f"how2matplotlib.com_circle_{i}")
    ax.add_patch(circle)
    circles.append(circle)

# 创建文本标签
text = ax.text(0.5, 0.95, "Custom Visualization", ha='center', va='top', fontsize=16)
text.set_gid("how2matplotlib.com_title")

# 创建图例
legend_elements = [patches.Patch(facecolor='red', edgecolor='r', label='Red'),
                   patches.Patch(facecolor='green', edgecolor='g', label='Green'),
                   patches.Patch(facecolor='blue', edgecolor='b', label='Blue')]
legend = ax.legend(handles=legend_elements, loc='upper right')
legend.set_gid("how2matplotlib.com_legend")

# 打印所有元素的GID
for artist in ax.get_children():
    if hasattr(artist, 'get_gid'):
        print(f"Element GID: {artist.get_gid()}")

ax.set_title("how2matplotlib.com - Custom Visualization with GIDs")
ax.set_xlim(0, 1)
ax.set_ylim(0, 1)
ax.axis('off')
plt.show()
Output:
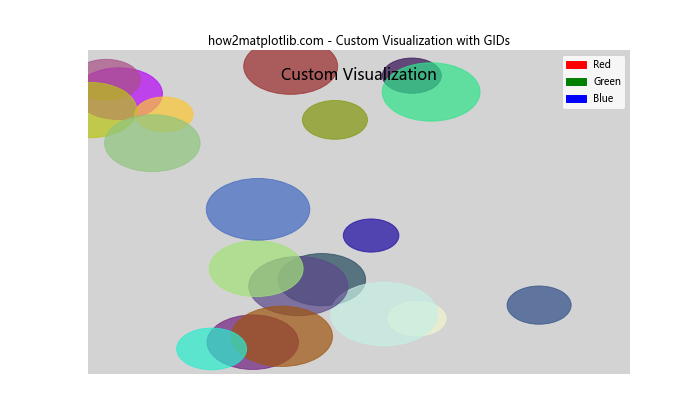
在这个复杂的例子中,我们创建了一个自定义可视化,包含背景、多个随机位置和颜色的圆形、标题文本和图例。我们为每个元素都设置了唯一的GID,并打印出所有元素的GID。这种方法使得我们可以轻松地识别和管理复杂可视化中的各个元素。
9. get_gid()方法的潜在问题和解决方案
尽管get_gid()方法非常有用,但在使用过程中可能会遇到一些问题。以下是一些常见问题及其解决方案:
9.1 GID冲突
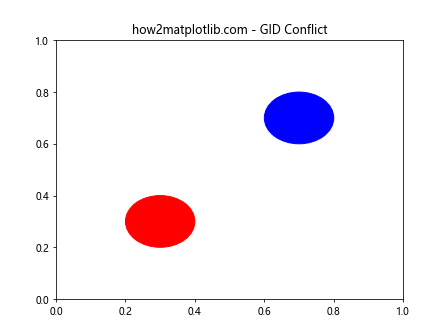
当多个元素使用相同的GID时,可能会导致混淆和错误。
问题示例:
import matplotlib.pyplot as plt
import matplotlib.patches as patches

fig, ax = plt.subplots()

circle1 = patches.Circle((0.3, 0.3), 0.1, fill=True, color='red')
circle1.set_gid("how2matplotlib.com_circle")

circle2 = patches.Circle((0.7, 0.7), 0.1, fill=True, color='blue')
circle2.set_gid("how2matplotlib.com_circle")

ax.add_patch(circle1)
ax.add_patch(circle2)

for artist in ax.get_children():
    if isinstance(artist, patches.Circle):
        print(f"Circle GID: {artist.get_gid()}")

ax.set_title("how2matplotlib.com - GID Conflict")
plt.show()
Output:
解决方案:使用唯一的GID或添加额外的标识符:
import matplotlib.pyplot as plt
import matplotlib.patches as patches
import uuid

fig, ax = plt.subplots()

def generate_unique_gid(base_gid):
    return f"{base_gid}_{uuid.uuid4().hex[:8]}"

circle1 = patches.Circle((0.3, 0.3), 0.1, fill=True, color='red')
circle1.set_gid(generate_unique_gid("how2matplotlib.com_circle"))

circle2 = patches.Circle((0.7, 0.7), 0.1, fill=True, color='blue')
circle2.set_gid(generate_unique_gid("how2matplotlib.com_circle"))

ax.add_patch(circle1)
ax.add_patch(circle2)

for artist in ax.get_children():
    if isinstance(artist, patches.Circle):
        print(f"Circle GID: {artist.get_gid()}")

ax.set_title("how2matplotlib.com - Unique GIDs")
plt.show()
Output:
9.2 GID不存在
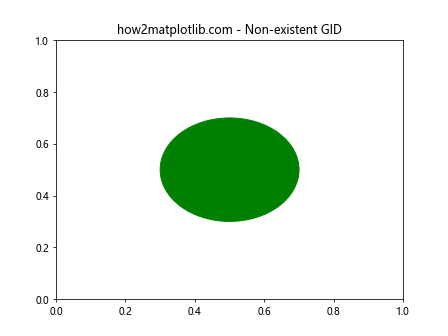
当尝试获取未设置GID的元素的GID时,get_gid()方法会返回None。
问题示例:
import matplotlib.pyplot as plt
import matplotlib.patches as patches

fig, ax = plt.subplots()

circle = patches.Circle((0.5, 0.5), 0.2, fill=True, color='green')
ax.add_patch(circle)

print(f"Circle GID: {circle.get_gid()}")

ax.set_title("how2matplotlib.com - Non-existent GID")
plt.show()
Output:
解决方案:在使用get_gid()之前检查GID是否存在:
import matplotlib.pyplot as plt
import matplotlib.patches as patches

fig, ax = plt.subplots()

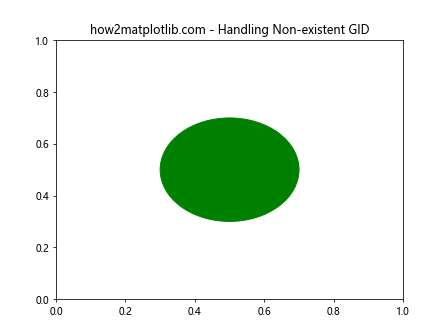
circle = patches.Circle((0.5, 0.5), 0.2, fill=True, color='green')
ax.add_patch(circle)

gid = circle.get_gid()
if gid is None:
    print("GID not set for this circle")
    circle.set_gid("how2matplotlib.com_default_circle")
    gid = circle.get_gid()

print(f"Circle GID: {gid}")

ax.set_title("how2matplotlib.com - Handling Non-existent GID")
plt.show()
Output:
9.3 性能问题
在处理大量元素时,频繁调用get_gid()可能会影响性能。
问题示例:
import matplotlib.pyplot as plt
import matplotlib.patches as patches
import time

fig, ax = plt.subplots()

circles = []
for i in range(10000):
    circle = patches.Circle((0.001 * i, 0.5), 0.001, fill=True)
    circle.set_gid(f"how2matplotlib.com_circle_{i}")
    ax.add_patch(circle)
    circles.append(circle)

start_time = time.time()
for circle in circles:
    gid = circle.get_gid()
end_time = time.time()

print(f"Time to get all GIDs: {end_time - start_time:.4f} seconds")

ax.set_title("how2matplotlib.com - Performance Issue")
plt.show()
Output:
解决方案:使用缓存或批量处理:
import matplotlib.pyplot```python
import matplotlib.pyplot as plt
import matplotlib.patches as patches
import time

fig, ax = plt.subplots()

circles = []
for i in range(10000):
    circle = patches.Circle((0.001 * i, 0.5), 0.001, fill=True)
    circle.set_gid(f"how2matplotlib.com_circle_{i}")
    ax.add_patch(circle)
    circles.append(circle)

# 使用缓存
start_time = time.time()
gid_cache = {circle: circle.get_gid() for circle in circles}
end_time = time.time()
print(f"Time to cache all GIDs: {end_time - start_time:.4f} seconds")

start_time = time.time()
for circle in circles:
    gid = gid_cache[circle]
end_time = time.time()
print(f"Time to get all GIDs from cache: {end_time - start_time:.4f} seconds")

ax.set_title("how2matplotlib.com - Performance Optimization")
plt.show()
10. get_gid()方法在大型项目中的最佳实践
在大型项目中使用get_gid()方法时,遵循一些最佳实践可以帮助我们更好地组织和管理代码:
10.1 使用命名约定
为不同类型的元素使用一致的命名约定可以使代码更易读和维护。
import matplotlib.pyplot as plt
import matplotlib.patches as patches

def create_shape(shape_type, **kwargs):
    if shape_type == 'circle':
        shape = patches.Circle(**kwargs)
        shape.set_gid(f"how2matplotlib.com_circle_{kwargs.get('gid_suffix', '')}")
    elif shape_type == 'rectangle':
        shape = patches.Rectangle(**kwargs)
        shape.set_gid(f"how2matplotlib.com_rectangle_{kwargs.get('gid_suffix', '')}")
    else:
        raise ValueError("Unsupported shape type")
    return shape

fig, ax = plt.subplots()

circle = create_shape('circle', xy=(0.3, 0.3), radius=0.1, fill=True, color='red', gid_suffix='main')
rectangle = create_shape('rectangle', xy=(0.5, 0.5), width=0.2, height=0.3, fill=True, color='blue', gid_suffix='secondary')

ax.add_patch(circle)
ax.add_patch(rectangle)

for artist in ax.get_children():
    if isinstance(artist, patches.Patch):
        print(f"Shape GID: {artist.get_gid()}")

ax.set_title("how2matplotlib.com - GID Naming Convention")
plt.show()
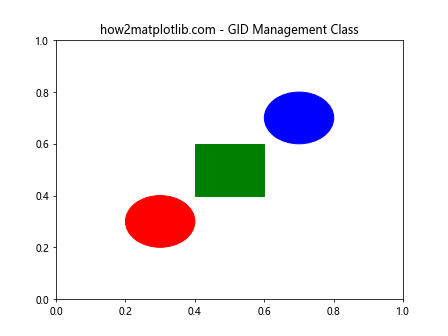
10.2 创建GID管理类
对于复杂的项目,创建一个专门的GID管理类可以帮助我们更好地组织和追踪GID。
import matplotlib.pyplot as plt
import matplotlib.patches as patches

class GIDManager:
    def __init__(self, prefix="how2matplotlib.com"):
        self.prefix = prefix
        self.counters = {}

    def get_next_gid(self, category):
        if category not in self.counters:
            self.counters[category] = 0
        self.counters[category] += 1
        return f"{self.prefix}_{category}_{self.counters[category]}"

fig, ax = plt.subplots()

gid_manager = GIDManager()

circle1 = patches.Circle((0.3, 0.3), 0.1, fill=True, color='red')
circle1.set_gid(gid_manager.get_next_gid("circle"))

circle2 = patches.Circle((0.7, 0.7), 0.1, fill=True, color='blue')
circle2.set_gid(gid_manager.get_next_gid("circle"))

rectangle = patches.Rectangle((0.4, 0.4), 0.2, 0.2, fill=True, color='green')
rectangle.set_gid(gid_manager.get_next_gid("rectangle"))

ax.add_patch(circle1)
ax.add_patch(circle2)
ax.add_patch(rectangle)

for artist in ax.get_children():
    if isinstance(artist, patches.Patch):
        print(f"Shape GID: {artist.get_gid()}")

ax.set_title("how2matplotlib.com - GID Management Class")
plt.show()
Output:
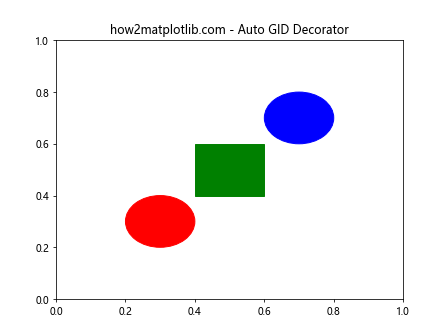
10.3 使用装饰器自动设置GID
我们可以使用装饰器来自动为Artist对象设置GID,这样可以减少重复代码并确保一致性。
import matplotlib.pyplot as plt
import matplotlib.patches as patches
import functools

def auto_gid(prefix="how2matplotlib.com"):
    def decorator(func):
        @functools.wraps(func)
        def wrapper(*args, **kwargs):
            artist = func(*args, **kwargs)
            if isinstance(artist, patches.Patch):
                artist.set_gid(f"{prefix}_{func.__name__}_{id(artist)}")
            return artist
        return wrapper
    return decorator

@auto_gid()
def create_circle(ax, x, y, radius, color):
    circle = patches.Circle((x, y), radius, fill=True, color=color)
    ax.add_patch(circle)
    return circle

@auto_gid()
def create_rectangle(ax, x, y, width, height, color):
    rectangle = patches.Rectangle((x, y), width, height, fill=True, color=color)
    ax.add_patch(rectangle)
    return rectangle

fig, ax = plt.subplots()

circle1 = create_circle(ax, 0.3, 0.3, 0.1, 'red')
circle2 = create_circle(ax, 0.7, 0.7, 0.1, 'blue')
rectangle = create_rectangle(ax, 0.4, 0.4, 0.2, 0.2, 'green')

for artist in ax.get_children():
    if isinstance(artist, patches.Patch):
        print(f"Shape GID: {artist.get_gid()}")

ax.set_title("how2matplotlib.com - Auto GID Decorator")
plt.show()
Output:
结论
Matplotlib的Artist.get_gid()方法是一个强大的工具,可以帮助我们更好地管理和操作图表中的元素。通过本文的详细介绍,我们了解了get_gid()方法的基本用法、应用场景、高级技巧以及在不同类型图表中的应用。我们还探讨了使用get_gid()方法时可能遇到的问题及其解决方案,并提供了在大型项目中使用该方法的最佳实践。
正确使用get_gid()方法可以显著提高图表的可维护性和交互性。无论是简单的图表还是复杂的可视化项目,掌握get_gid()方法都将使您的Matplotlib使用技能更上一层楼。希望本文能够帮助您更好地理解和应用get_gid()方法,创建出更加灵活和强大的数据可视化作品。
 极客笔记
极客笔记