Matplotlib中Artist对象的format_cursor_data()方法详解与应用
参考:Matplotlib.artist.Artist.format_cursor_data() in Python
Matplotlib是Python中最流行的数据可视化库之一,它提供了丰富的绘图功能和灵活的自定义选项。在Matplotlib的架构中,Artist对象扮演着重要的角色,它是所有可视化元素的基类。本文将深入探讨Artist对象的一个重要方法:format_cursor_data()。我们将详细介绍这个方法的功能、用法以及在实际应用中的各种场景。
1. Artist对象简介
在深入了解format_cursor_data()方法之前,我们先简要介绍一下Artist对象。在Matplotlib中,几乎所有可以在图形中看到的元素都是Artist的子类,例如Figure、Axes、Line2D、Text等。Artist对象负责绘制图形中的各种元素,并提供了许多方法来控制这些元素的属性和行为。
以下是一个简单的示例,展示了如何创建一个基本的Artist对象:
import matplotlib.pyplot as plt
import matplotlib.patches as patches

fig, ax = plt.subplots()
circle = patches.Circle((0.5, 0.5), 0.2, fill=False)
ax.add_artist(circle)
ax.set_title("How2matplotlib.com - Basic Artist Example")
plt.show()
Output:
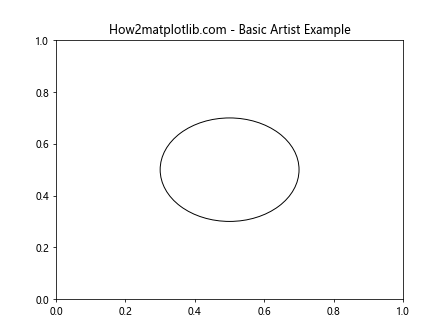
在这个例子中,我们创建了一个Circle对象,它是Artist的一个子类。我们将这个圆形添加到Axes中,从而在图形上显示出来。
2. format_cursor_data()方法概述
format_cursor_data()是Artist类中的一个方法,它的主要作用是格式化光标位置处的数据,以便在交互式环境中显示。当用户将鼠标悬停在图形上时,这个方法会被调用来生成显示的文本信息。
这个方法的基本语法如下:
Artist.format_cursor_data(data)
其中,data参数是与光标位置相关的数据。默认情况下,这个方法会将数据转换为字符串并返回。然而,我们可以通过重写这个方法来自定义数据的显示格式。
3. 默认行为示例
让我们先看一个使用默认format_cursor_data()行为的例子:
import matplotlib.pyplot as plt
import numpy as np

fig, ax = plt.subplots()
x = np.linspace(0, 10, 100)
y = np.sin(x)
line, = ax.plot(x, y, label='How2matplotlib.com')
ax.set_title("Default format_cursor_data() Behavior")

def on_move(event):
    if event.inaxes:
        data = line.get_ydata()[int(event.xdata)]
        formatted_data = line.format_cursor_data(data)
        print(f"Y value at x={event.xdata:.2f}: {formatted_data}")

fig.canvas.mpl_connect('motion_notify_event', on_move)
plt.show()
Output:
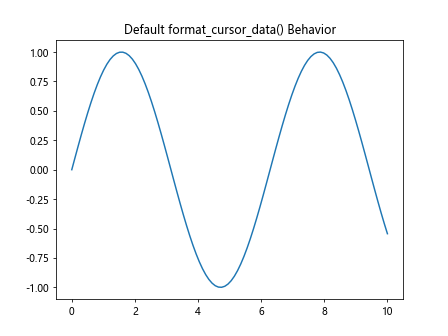
在这个例子中,我们绘制了一条正弦曲线,并添加了一个鼠标移动事件处理器。当鼠标在图形上移动时,我们获取光标位置对应的y值,并使用format_cursor_data()方法格式化这个值。默认情况下,这个方法简单地将数值转换为字符串。
4. 自定义format_cursor_data()方法
虽然默认的format_cursor_data()方法已经能满足基本需求,但在某些情况下,我们可能希望对显示的数据进行更复杂的格式化。这时,我们可以通过继承Artist类并重写format_cursor_data()方法来实现自定义格式化。
下面是一个自定义format_cursor_data()方法的例子:
import matplotlib.pyplot as plt
import numpy as np

class CustomLine(plt.Line2D):
    def format_cursor_data(self, data):
        return f"Value: {data:.4f} (How2matplotlib.com)"

fig, ax = plt.subplots()
x = np.linspace(0, 10, 100)
y = np.sin(x)
line = CustomLine(x, y)
ax.add_line(line)
ax.set_xlim(0, 10)
ax.set_ylim(-1, 1)
ax.set_title("Custom format_cursor_data() Example")

def on_move(event):
    if event.inaxes:
        data = line.get_ydata()[int(event.xdata)]
        formatted_data = line.format_cursor_data(data)
        print(f"At x={event.xdata:.2f}: {formatted_data}")

fig.canvas.mpl_connect('motion_notify_event', on_move)
plt.show()
Output:
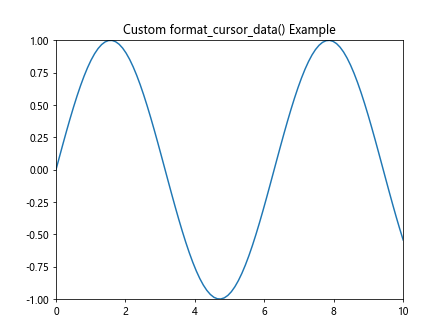
在这个例子中,我们创建了一个CustomLine类,它继承自plt.Line2D。我们重写了format_cursor_data()方法,使其返回一个包含更多信息的格式化字符串。这样,当鼠标移动到图形上时,我们就能看到更详细的数据信息。
5. 在不同类型的图表中应用format_cursor_data()
format_cursor_data()方法可以应用于各种类型的图表。让我们看几个在不同图表类型中使用这个方法的例子。
5.1 散点图
import matplotlib.pyplot as plt
import numpy as np

class CustomScatter(plt.scatter):
    def format_cursor_data(self, data):
        return f"(x, y) = ({data[0]:.2f}, {data[1]:.2f}) - How2matplotlib.com"

fig, ax = plt.subplots()
x = np.random.rand(50)
y = np.random.rand(50)
scatter = CustomScatter(x, y, ax=ax)
ax.set_title("Custom Scatter Plot with format_cursor_data()")

def on_move(event):
    if event.inaxes:
        cont, ind = scatter.contains(event)
        if cont:
            data = scatter.get_offsets()[ind["ind"][0]]
            formatted_data = scatter.format_cursor_data(data)
            print(formatted_data)

fig.canvas.mpl_connect('motion_notify_event', on_move)
plt.show()
在这个散点图的例子中,我们自定义了format_cursor_data()方法来同时显示x和y坐标。
5.2 柱状图
import matplotlib.pyplot as plt
import numpy as np

class CustomBar(plt.Rectangle):
    def format_cursor_data(self, data):
        return f"Height: {data:.2f} - How2matplotlib.com"

fig, ax = plt.subplots()
x = np.arange(5)
y = np.random.rand(5)
bars = ax.bar(x, y)
ax.set_title("Custom Bar Plot with format_cursor_data()")

for bar in bars:
    bar.__class__ = CustomBar

def on_move(event):
    if event.inaxes:
        for bar in bars:
            contains, _ = bar.contains(event)
            if contains:
                height = bar.get_height()
                formatted_data = bar.format_cursor_data(height)
                print(formatted_data)
                break

fig.canvas.mpl_connect('motion_notify_event', on_move)
plt.show()
Output:
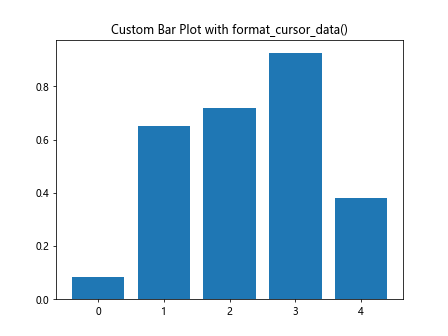
在这个柱状图的例子中,我们为每个柱子自定义了format_cursor_data()方法,使其显示柱子的高度。
6. 在复杂图表中使用format_cursor_data()
当我们处理更复杂的图表时,format_cursor_data()方法可以帮助我们提供更丰富的交互信息。让我们看一个包含多个数据系列的复杂图表例子:
import matplotlib.pyplot as plt
import numpy as np

class CustomLine(plt.Line2D):
    def __init__(self, *args, **kwargs):
        self.series_name = kwargs.pop('series_name', '')
        super().__init__(*args, **kwargs)

    def format_cursor_data(self, data):
        return f"{self.series_name}: {data:.4f} - How2matplotlib.com"

fig, ax = plt.subplots()
x = np.linspace(0, 10, 100)
y1 = np.sin(x)
y2 = np.cos(x)
y3 = np.tan(x)

line1 = CustomLine(x, y1, color='red', series_name='Sin')
line2 = CustomLine(x, y2, color='blue', series_name='Cos')
line3 = CustomLine(x, y3, color='green', series_name='Tan')

ax.add_line(line1)
ax.add_line(line2)
ax.add_line(line3)
ax.set_xlim(0, 10)
ax.set_ylim(-2, 2)
ax.set_title("Complex Plot with Custom format_cursor_data()")

def on_move(event):
    if event.inaxes:
        for line in [line1, line2, line3]:
            data = line.get_ydata()[int(event.xdata)]
            formatted_data = line.format_cursor_data(data)
            print(formatted_data)

fig.canvas.mpl_connect('motion_notify_event', on_move)
plt.show()
Output:
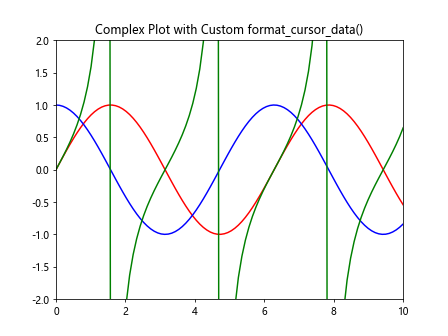
在这个例子中,我们创建了一个包含三条曲线(正弦、余弦和正切)的复杂图表。每条曲线都使用自定义的CustomLine类,该类重写了format_cursor_data()方法以显示曲线名称和对应的y值。
7. 在3D图表中应用format_cursor_data()
format_cursor_data()方法也可以应用于3D图表,尽管在3D环境中获取准确的光标位置可能会更复杂。以下是一个在3D散点图中使用format_cursor_data()的例子:
import matplotlib.pyplot as plt
import numpy as np
from mpl_toolkits.mplot3d import Axes3D

class Custom3DScatter(plt.Line3D):
    def format_cursor_data(self, data):
        return f"(x, y, z) = ({data[0]:.2f}, {data[1]:.2f}, {data[2]:.2f}) - How2matplotlib.com"

fig = plt.figure()
ax = fig.add_subplot(111, projection='3d')

n = 100
x = np.random.rand(n)
y = np.random.rand(n)
z = np.random.rand(n)

scatter = Custom3DScatter(x, y, z, marker='o')
ax.add_line(scatter)
ax.set_title("3D Scatter Plot with Custom format_cursor_data()")

def on_move(event):
    if event.inaxes:
        cont, ind = scatter.contains(event)
        if cont:
            data = scatter.get_data_3d()
            point = [data[0][ind["ind"][0]], data[1][ind["ind"][0]], data[2][ind["ind"][0]]]
            formatted_data = scatter.format_cursor_data(point)
            print(formatted_data)

fig.canvas.mpl_connect('motion_notify_event', on_move)
plt.show()
在这个3D散点图的例子中,我们自定义了format_cursor_data()方法来显示三维坐标。注意,由于3D图形的特性,鼠标悬停可能不会精确对应到单个点,所以这个例子可能需要在实际应用中进行进一步的优化。
8. 在动画中使用format_cursor_data()
format_cursor_data()方法也可以在动画中使用,为用户提供实时的数据信息。以下是一个简单的动画例子,展示了如何在动画中使用这个方法:
import matplotlib.pyplot as plt
import numpy as np
from matplotlib.animation import FuncAnimation

class CustomLine(plt.Line2D):
    def format_cursor_data(self, data):
        return f"Value: {data:.4f} - How2matplotlib.com"

fig, ax = plt.subplots()
x = np.linspace(0, 2*np.pi, 100)
line = CustomLine([], [], lw=2)
ax.add_line(line)
ax.set_xlim(0, 2*np.pi)
ax.set_ylim(-1, 1)
ax.set_title("Animated Plot with Custom format_cursor_data()")

def init():
    line.set_data([], [])
    return line,

def animate(i):
    y = np.sin(x + i/10.0)
    line.set_data(x, y)
    return line,

def on_move(event):
    if event.inaxes:
        data = line.get_ydata()[int(event.xdata)]
        formatted_data = line.format_cursor_data(data)
        print(f"At x={event.xdata:.2f}: {formatted_data}")

anim = FuncAnimation(fig, animate, init_func=init, frames=200, interval=50, blit=True)
fig.canvas.mpl_connect('motion_notify_event', on_move)
plt.show()
Output:
在这个动画例子中,我们创建了一个随时间变化的正弦波。自定义的format_cursor_data()方法用于格式化光标位置的y值。当动画运行时,用户可以移动鼠标来查看不同位置的实时数据。
9. 在交互式工具中应用format_cursor_data()
format_cursor_data()方法在创建交互式工具时特别有用。例如,我们可以创建一个简单的数据探索工具,允许用户通过鼠标点击来选择数据点并查看详细信息。以下是一个这样的例子:
import matplotlib.pyplot as plt
import numpy as np

class CustomScatter(plt.scatter):
    def format_cursor_data(self, data):
        return f"(x, y) = ({data[0]:.2f}, {data[1]:.2f}) - How2matplotlib.com"

fig, ax = plt.subplots()
x = np.random.rand(50)
y = np.random.rand(50)
scatter = CustomScatter(x, y, ax=ax)
ax.set_title("Interactive Data Explorer")

selected_point = ax.plot([], [], 'ro', markersize=12, fillstyle='none')[0]

def on_click(event):
    if event.inaxes:
        cont, ind = scatter.contains(event)
        if cont:
            data = scatter.get_offsets()[ind["ind"][0]]
            formatted_data = scatter.format_cursor_data(data)
            print(f"Selected point: {formatted_data}")
            selected_point.set_data(data[0], data[1])
            fig.canvas.draw_idle()

fig.canvas.mpl_connect('button_press_event', on_click)
plt.show()
在这个例子中,我们创建了一个交互式散点图。用户可以点击任何数据点,选中的点会被红色圆圈标记,同时控制台会打印出该点的格式化数据。这种交互式工具可以帮助用户更直观地探索数据。
10. 在自定义图例中使用format_cursor_data()
format_cursor_data()方法也可以用于自定义图例的行为。以下是一个例子,展示了如何在图例中使用这个方法:
import matplotlib.pyplot as plt
import numpy as np

class CustomLine(plt.Line2D):
    def __init__(self, *args, **kwargs):
        self.series_name = kwargs.pop('series_name', '')
        super().__init__(*args, **kwargs)

    def format_cursor_data(self, data):
        return f"{self.series_name}: {data:.4f} - How2matplotlib.com"

fig, ax = plt.subplots()
x = np.linspace(0, 10, 100)
y1 = np.sin(x)
y2 = np.cos(x)

line1 = CustomLine(x, y1, color='red', series_name='Sin')
line2 = CustomLine(x, y2, color='blue', series_name='Cos')

ax.add_line(line1)
ax.add_line(line2)
ax.set_xlim(0, 10)
ax.set_ylim(-1, 1)
ax.set_title("Custom Legend with format_cursor_data()")

legend = ax.legend([line1, line2], ['Sin', 'Cos'])

def on_move(event):
    if event.inaxes:
        for line in [line1, line2]:
            data = line.get_ydata()[int(event.xdata)]
            formatted_data = line.format_cursor_data(data)
            print(formatted_data)

fig.canvas.mpl_connect('motion_notify_event', on_move)
plt.show()
Output:
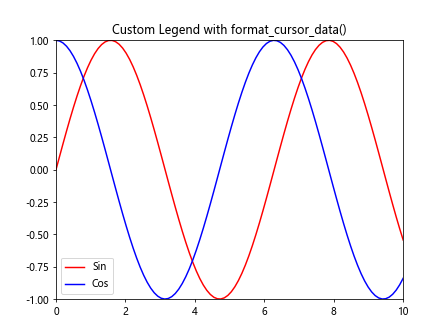
在这个例子中,我们为每条线创建了自定义的CustomLine类,并在图例中使用这些自定义线条。当鼠标移动到图形上时,会显示每条线对应位置的格式化数据。
11. 在多子图中应用format_cursor_data()
当我们处理包含多个子图的复杂图形时,format_cursor_data()方法可以帮助我们为每个子图提供独特的数据格式化。以下是一个在多子图中使用format_cursor_data()的例子:
import matplotlib.pyplot as plt
import numpy as np

class CustomLine(plt.Line2D):
    def __init__(self, *args, **kwargs):
        self.subplot_name = kwargs.pop('subplot_name', '')
        super().__init__(*args, **kwargs)

    def format_cursor_data(self, data):
        return f"{self.subplot_name}: {data:.4f} - How2matplotlib.com"

fig, (ax1, ax2) = plt.subplots(2, 1, figsize=(8, 8))
x = np.linspace(0, 10, 100)
y1 = np.sin(x)
y2 = np.cos(x)

line1 = CustomLine(x, y1, color='red', subplot_name='Sin')
line2 = CustomLine(x, y2, color='blue', subplot_name='Cos')

ax1.add_line(line1)
ax2.add_line(line2)

ax1.set_xlim(0, 10)
ax1.set_ylim(-1, 1)
ax1.set_title("Subplot 1: Sin")

ax2.set_xlim(0, 10)
ax2.set_ylim(-1, 1)
ax2.set_title("Subplot 2: Cos")

fig.suptitle("Multiple Subplots with Custom format_cursor_data()")

def on_move(event):
    if event.inaxes:
        if event.inaxes == ax1:
            data = line1.get_ydata()[int(event.xdata)]
            formatted_data = line1.format_cursor_data(data)
        elif event.inaxes == ax2:
            data = line2.get_ydata()[int(event.xdata)]
            formatted_data = line2.format_cursor_data(data)
        print(formatted_data)

fig.canvas.mpl_connect('motion_notify_event', on_move)
plt.tight_layout()
plt.show()
Output:
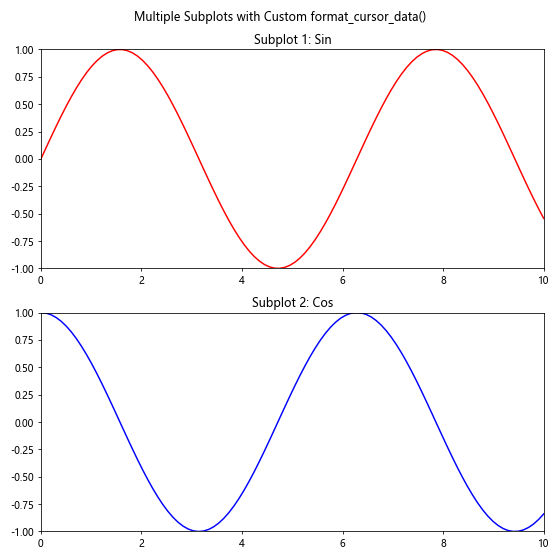
在这个例子中,我们创建了两个子图,分别显示正弦和余弦函数。每个子图使用自定义的CustomLine类,该类的format_cursor_data()方法会显示子图名称和对应的y值。
12. 在极坐标图中使用format_cursor_data()
format_cursor_data()方法同样可以应用于极坐标图。以下是一个在极坐标图中使用这个方法的例子:
import matplotlib.pyplot as plt
import numpy as np

class CustomPolarLine(plt.Line2D):
    def format_cursor_data(self, data):
        r, theta = data
        return f"(r, θ) = ({r:.2f}, {np.degrees(theta):.2f}°) - How2matplotlib.com"

fig, ax = plt.subplots(subplot_kw=dict(projection='polar'))
theta = np.linspace(0, 2*np.pi, 100)
r = 1 + np.sin(theta)

line = CustomPolarLine(theta, r)
ax.add_line(line)
ax.set_title("Polar Plot with Custom format_cursor_data()")

def on_move(event):
    if event.inaxes:
        r = np.sqrt(event.xdata**2 + event.ydata**2)
        theta = np.arctan2(event.ydata, event.xdata)
        formatted_data = line.format_cursor_data((r, theta))
        print(formatted_data)

fig.canvas.mpl_connect('motion_notify_event', on_move)
plt.show()
Output:
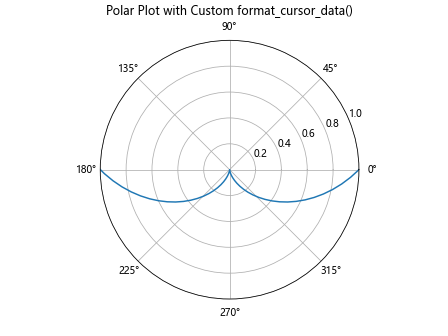
在这个极坐标图的例子中,我们自定义了format_cursor_data()方法来显示极坐标系中的r和θ值。注意,我们需要将θ值从弧度转换为度数,以便更直观地显示。
13. 在热图中应用format_cursor_data()
热图是另一种可以受益于format_cursor_data()方法的图表类型。以下是一个在热图中使用这个方法的例子:
import matplotlib.pyplot as plt
import numpy as np

class CustomHeatmap(plt.AxesImage):
    def format_cursor_data(self, data):
        return f"Value: {data:.2f} - How2matplotlib.com"

fig, ax = plt.subplots()
data = np.random.rand(10, 10)
heatmap = CustomHeatmap(ax, data)
ax.add_image(heatmap)
ax.set_title("Heatmap with Custom format_cursor_data()")

def on_move(event):
    if event.inaxes:
        x, y = int(event.xdata), int(event.ydata)
        if 0 <= x < data.shape[1] and 0 <= y < data.shape[0]:
            value = data[y, x]
            formatted_data = heatmap.format_cursor_data(value)
            print(f"At (x, y) = ({x}, {y}): {formatted_data}")

fig.canvas.mpl_connect('motion_notify_event', on_move)
plt.colorbar(heatmap)
plt.show()
在这个热图的例子中,我们自定义了format_cursor_data()方法来显示热图中每个单元格的值。当用户将鼠标移动到热图上时,会显示对应位置的格式化数据。
14. 在等高线图中使用format_cursor_data()
等高线图是另一种可以通过format_cursor_data()方法提供有用信息的图表类型。以下是一个在等高线图中使用这个方法的例子:
import matplotlib.pyplot as plt
import numpy as np

class CustomContour(plt.QuadContourSet):
    def format_cursor_data(self, data):
        return f"Contour level: {data:.2f} - How2matplotlib.com"

fig, ax = plt.subplots()
x = np.linspace(-3, 3, 100)
y = np.linspace(-3, 3, 100)
X, Y = np.meshgrid(x, y)
Z = np.sin(X) * np.cos(Y)

contour = CustomContour(ax, X, Y, Z)
ax.add_collection(contour)
ax.set_title("Contour Plot with Custom format_cursor_data()")

def on_move(event):
    if event.inaxes:
        x, y = event.xdata, event.ydata
        z = np.sin(x) * np.cos(y)
        formatted_data = contour.format_cursor_data(z)
        print(f"At (x, y) = ({x:.2f}, {y:.2f}): {formatted_data}")

fig.canvas.mpl_connect('motion_notify_event', on_move)
plt.colorbar(contour)
plt.show()
在这个等高线图的例子中,我们自定义了format_cursor_data()方法来显示等高线的水平。当用户将鼠标移动到图上时,会显示对应位置的等高线水平。
15. 结合其他交互工具使用format_cursor_data()
format_cursor_data()方法可以与Matplotlib的其他交互工具结合使用,以创建更强大的数据可视化应用。以下是一个结合缩放和平移功能的例子:
import matplotlib.pyplot as plt
import numpy as np
from matplotlib.widgets import RectangleSelector

class CustomLine(plt.Line2D):
    def format_cursor_data(self, data):
        return f"Value: {data:.4f} - How2matplotlib.com"

fig, ax = plt.subplots()
x = np.linspace(0, 10, 1000)
y = np.sin(x) * np.exp(-x/10)
line = CustomLine(x, y)
ax.add_line(line)
ax.set_xlim(0, 10)
ax.set_ylim(-1, 1)
ax.set_title("Interactive Plot with Zoom and Pan")

def on_move(event):
    if event.inaxes:
        data = line.get_ydata()[int(event.xdata * 100)]
        formatted_data = line.format_cursor_data(data)
        print(f"At x={event.xdata:.2f}: {formatted_data}")

def on_select(eclick, erelease):
    x1, y1 = eclick.xdata, eclick.ydata
    x2, y2 = erelease.xdata, erelease.ydata
    ax.set_xlim(min(x1, x2), max(x1, x2))
    ax.set_ylim(min(y1, y2), max(y1, y2))
    fig.canvas.draw_idle()

rect_selector = RectangleSelector(ax, on_select, useblit=True,
                                  button=[1], minspanx=5, minspany=5,
                                  spancoords='pixels', interactive=True)

fig.canvas.mpl_connect('motion_notify_event', on_move)
plt.show()
Output:
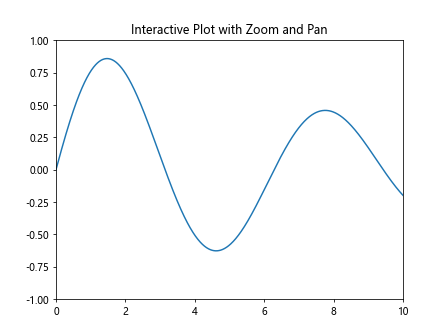
在这个例子中,我们结合了自定义的format_cursor_data()方法和矩形选择工具。用户可以通过拖动鼠标来选择要放大的区域,同时还能看到光标位置的格式化数据。
总结
通过本文的详细介绍和丰富的示例,我们深入探讨了Matplotlib中Artist对象的format_cursor_data()方法。这个方法为我们提供了一种强大的方式来自定义数据的显示格式,特别是在交互式图表中。我们看到了如何在各种不同类型的图表中应用这个方法,包括线图、散点图、柱状图、3D图表、动画、极坐标图、热图和等高线图等。
format_cursor_data()方法的灵活性使得它可以适应各种数据可视化需求。通过自定义这个方法,我们可以为用户提供更丰富、更有意义的数据信息,从而增强数据可视化的交互性和信息量。
在实际应用中,format_cursor_data()方法可以与其他Matplotlib功能和工具结合使用,创建出功能更加强大的数据可视化应用。无论是进行数据探索、创建交互式仪表板,还是制作科学报告,掌握这个方法都将大大提升你的Matplotlib使用技能。
 极客笔记
极客笔记