如何在matplotlib中使用annotation box
在使用matplotlib绘制图形时,我们经常需要在图中添加一些注释来说明数据或突出关键信息。其中一种常用的注释方式就是使用annotation box。annotation box可以用来显示文字和箭头,并且可以指向图中的特定位置。本文将详细介绍如何在matplotlib中使用annotation box。
基本用法
在matplotlib中,可以使用annotate函数来添加annotation box。下面是一个简单的示例代码:
import matplotlib.pyplot as plt

fig, ax = plt.subplots()

ax.plot([1, 2, 3, 4], [1, 4, 2, 3])

ax.annotate('This is the point', xy=(3, 2), xytext=(2, 3),
            arrowprops=dict(facecolor='black', shrink=0.05))

plt.show()
Output:
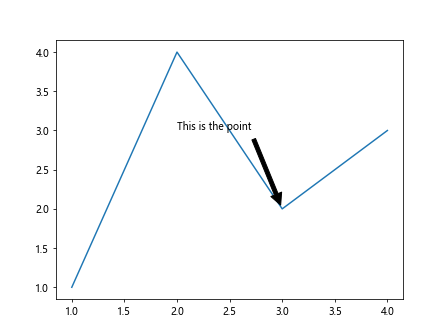
在这个示例中,我们通过annotate函数在图中添加了一个annotation box,注释内容为”This is the point”。xy参数指定了箭头指向的位置,xytext参数指定了文本框的位置。
自定义样式
我们可以对annotation box的样式进行自定义,比如修改文本框的颜色、边框的样式等。下面是一个示例代码:
import matplotlib.pyplot as plt

fig, ax = plt.subplots()

ax.plot([1, 2, 3, 4], [1, 4, 2, 3])

ax.annotate('This is the point', xy=(3, 2), xytext=(2, 3),
            arrowprops=dict(facecolor='red', edgecolor='blue', arrowstyle='->'))

plt.show()
Output:
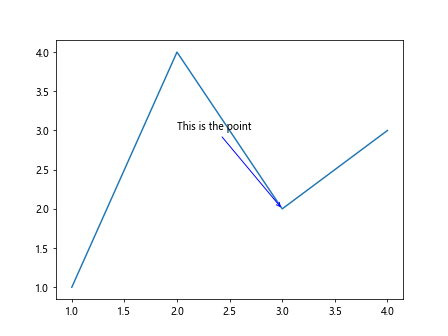
在这个示例中,我们修改了文本框的颜色为红色,边框的颜色为蓝色,箭头的样式为->。
多个annotation box
在一个图中可以添加多个annotation box,下面是一个示例代码:
import matplotlib.pyplot as plt

fig, ax = plt.subplots()

ax.plot([1, 2, 3, 4], [1, 4, 2, 3])

ax.annotate('Point 1', xy=(1, 1), xytext=(1.5, 1.5),
            arrowprops=dict(facecolor='black', shrink=0.05))

ax.annotate('Point 2', xy=(2, 4), xytext=(2.5, 3.5),
            arrowprops=dict(facecolor='black', shrink=0.05))

plt.show()
Output:
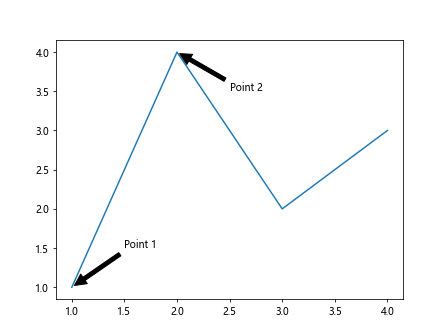
在这个示例中,我们在图中添加了两个annotation box,分别注释了两个点。
文本框样式
可以对文本框的样式进行修改,比如修改文本框的透明度、边框宽度等。下面是一个示例代码:
import matplotlib.pyplot as plt

fig, ax = plt.subplots()

ax.plot([1, 2, 3, 4], [1, 4, 2, 3])

ax.annotate('This is the point', xy=(3, 2), xytext=(2, 3),
            arrowprops=dict(facecolor='black', shrink=0.05),
            bbox=dict(boxstyle='round,pad=0.5', fc='yellow', ec='green', lw=2))

plt.show()
Output:
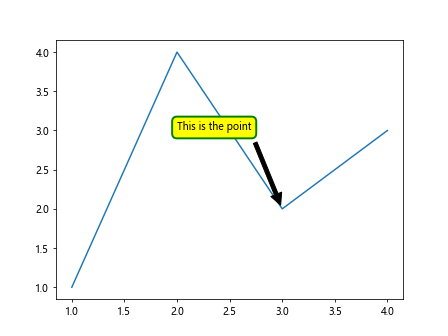
在这个示例中,我们修改了文本框的样式,将文本框设置为圆角,背景颜色为黄色,边框颜色为绿色,边框宽度为2。
偏移箭头
可以对箭头的位置进行微调,比如修改箭头与指向的位置的距离。下面是一个示例代码:
import matplotlib.pyplot as plt

fig, ax = plt.subplots()

ax.plot([1, 2, 3, 4], [1, 4, 2, 3])

ax.annotate('This is the point', xy=(3, 2), xytext=(2, 3),
            arrowprops=dict(facecolor='black', shrink=0.05, mutation_scale=15))

plt.show()
Output:
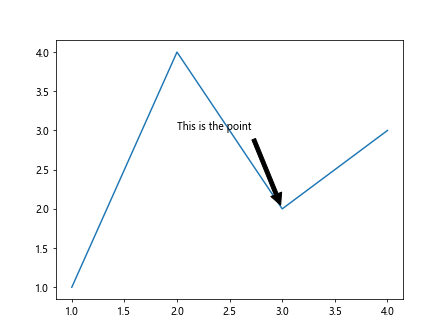
在这个示例中,我们对箭头的位置进行微调,将其与指向的位置的距离增加为15。
支持HTML标签
在annotation box中支持使用HTML标签,可以实现更加灵活的文本格式。下面是一个示例代码:
import matplotlib.pyplot as plt

fig, ax = plt.subplots()

ax.plot([1, 2, 3, 4], [1, 4, 2, 3])

ax.annotate('<span style="color:red">This is the point</span>', xy=(3, 2), xytext=(2, 3),
            arrowprops=dict(facecolor='black', shrink=0.05),
            fontsize=14, fontweight='bold', family='fantasy')

plt.show()
Output:
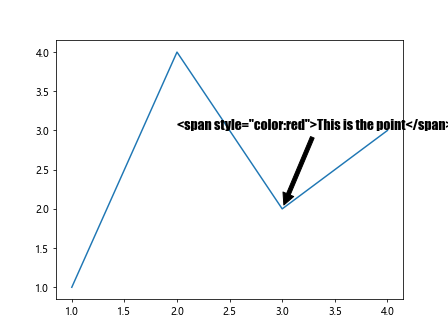
在这个示例中,我们使用了HTML标签来修改文本的样式,将文本颜色设置为红色,字体加粗,字体为fantasy风格。
使用subplot
在subplot中也可以添加annotation box,下面是一个示例代码:
import matplotlib.pyplot as plt

fig, ax = plt.subplots()
ax = plt.subplot(211)

ax.plot([1, 2, 3, 4], [1, 4, 2, 3])

ax.annotate('This is the point', xy=(3, 2), xytext=(2, 3),
            arrowprops=dict(facecolor='black', shrink=0.05))

plt.show()
Output:
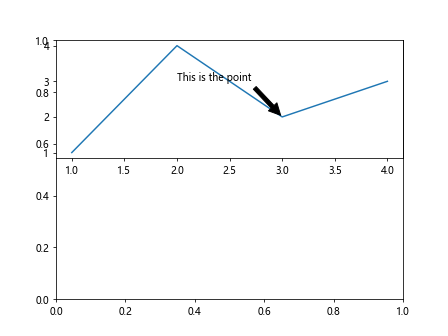
在这个示例中,我们在subplot中添加了一个annotation box。
改变箭头样式
可以通过修改arrowprops参数来改变箭头的样式,比如修改箭头的宽度、颜色等。下面是一个示例代码:
import matplotlib.pyplot as plt

fig, ax = plt.subplots()

ax.plot([1, 2, 3, 4], [1, 4, 2, 3])

ax.annotate('This is the point', xy=(3, 2), xytext=(2, 3),
            arrowprops=dict(facecolor='black', shrink=0.05, connectionstyle="angle,angleA=0,angleB=90,rad=10"))

plt.show()
在这个示例中,我们通过connectionstyle参数修改了箭头的样式,使其变成了一个弧线。
指定箭头方向
可以通过修改arrowprops参数来指定箭头的方向,比如修改箭头指向的位置、箭头的长度等。下面是一个示例代码:
import matplotlib.pyplot as plt

fig, ax = plt.subplots()

ax.plot([1, 2, 3, 4], [1, 4, 2, 3])

ax.annotate('This is the point', xy=(3, 2), xytext=(2, 3),
            arrowprops=dict(arrowstyle="fancy,tail_width=0.6,head_width=1,head_length=0.8"))

plt.show()
Output:
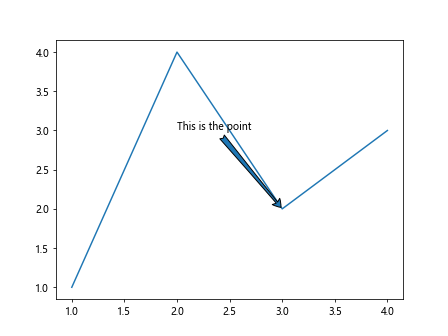
在这个示例中,我们通过arrowstyle参数修改了箭头的样式和长度。
指定注释框位置
可以通过修改xytext参数来指定注释框的位置,比如修改注释框相对于指向位置的偏移量。下面是一个示例代码:
import matplotlib.pyplot as plt

fig, ax = plt.subplots()

ax.plot([1, 2, 3, 4], [1, 4, 2, 3])

ax.annotate('This is the point', xy=(3, 2), xytext=(3, 3),
            arrowprops=dict(facecolor='black', shrink=0.05))

plt.show()
Output:
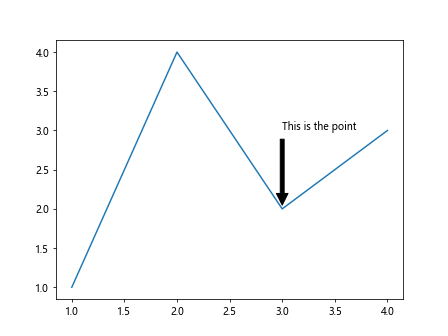
在这个示例中,我们将注释框的位置修改为指向位置的正上方,并且对注释框的位置进行微调。
修改文本样式
可以通过修改fontsize、fontweight等参数来修改文本的样式,比如修改文本的大小、粗细等。下面是一个示例代码:
import matplotlib.pyplot as plt

fig, ax = plt.subplots()

ax.plot([1, 2, 3, 4], [1, 4, 2, 3])

ax.annotate('This is the point', xy=(3, 2), xytext=(2, 3),
            arrowprops=dict(facecolor='black', shrink=0.05),
            fontsize=16, fontweight='bold')

plt.show()
Output:
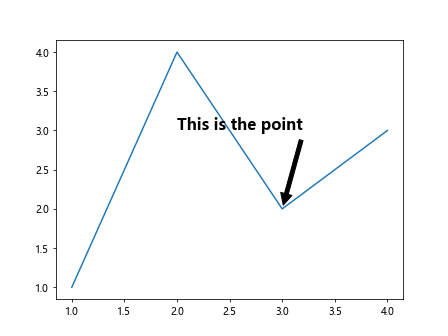
在这个示例中,我们修改了文本的大小为16,字体加粗。
改变箭头方向
可以通过xycoords参数来指定arrowprops中的坐标系,比如修改箭头的方向和长度。下面是一个示例代码:
import matplotlib.pyplot as plt

fig, ax = plt.subplots()

ax.plot([1, 2, 3, 4], [1, 4, 2, 3])

ax.annotate('This is the point', xy=(3, 2), xytext=(2, 3),
            arrowprops=dict(facecolor='black', shrink=0.05, arrowstyle='->', connectionstyle="arc3,rad=-0.3"))

plt.show()
在这个示例中,我们通过connectionstyle参数修改了箭头的样式,使其呈现弧线。
综述
本文介绍了matplotlib中annotation box的基本用法、自定义样式、多个annotation box、文本框样式、偏移箭头、支持HTML标签、使用subplot、改变箭头样式、指定箭头方向、指定注释框位置、修改文本样式等相关知识点。通过对这些示例代码的学习,相信读者已经掌握了在matplotlib中添加annotation box的方法和技巧。在实际应用中,根据需要可以灵活运用这些知识,为图形添加精美的注释,使得图形更加生动和具有吸引力。
 极客笔记
极客笔记