Matplotlib Annotate:轻松为图表添加注释和标记
Matplotlib是Python中最流行的数据可视化库之一,它提供了丰富的绘图功能。其中,annotate函数是一个强大的工具,用于在图表中添加注释和标记。本文将深入探讨Matplotlib的annotate函数,介绍其用法、参数和各种应用场景,帮助你更好地理解和使用这个功能,让你的数据可视化更加生动和富有信息量。
1. Matplotlib Annotate的基本概念
annotate函数是Matplotlib库中用于添加注释的核心功能。它允许用户在图表的任意位置添加文本说明、箭头或其他标记,以突出显示重要数据点或解释图表中的特定特征。
1.1 基本语法
annotate函数的基本语法如下:
import matplotlib.pyplot as plt

plt.figure(figsize=(8, 6))
plt.plot([1, 2, 3, 4], [1, 4, 2, 3])
plt.annotate('How2matplotlib.com', xy=(2, 4), xytext=(3, 4.5),
             arrowprops=dict(facecolor='black', shrink=0.05))
plt.title('Basic Annotate Example')
plt.show()
Output:
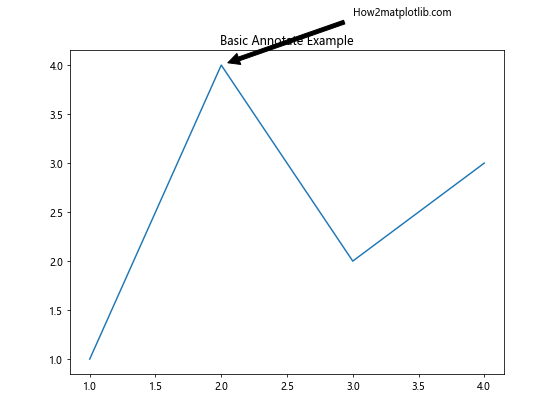
在这个例子中,我们创建了一个简单的折线图,并使用annotate函数添加了一个注释。xy参数指定了箭头的目标点,xytext参数指定了文本的位置,arrowprops参数定义了箭头的属性。
1.2 主要参数
annotate函数有许多参数,以下是一些常用的参数:
s:注释的文本内容xy:箭头指向的点的坐标xytext:文本放置的坐标xycoords:指定xy的坐标系textcoords:指定xytext的坐标系arrowprops:定义箭头的属性annotation_clip:是否应该剪切注释以适应图表边界
2. 坐标系统
理解坐标系统对于正确放置注释至关重要。Matplotlib提供了多种坐标系统选项。
2.1 数据坐标系
数据坐标系是最常用的坐标系,它使用与数据点相同的单位。
import matplotlib.pyplot as plt

plt.figure(figsize=(8, 6))
x = [1, 2, 3, 4, 5]
y = [2, 4, 7, 3, 5]
plt.plot(x, y)
plt.annotate('How2matplotlib.com Peak', xy=(3, 7), xytext=(4, 6),
             arrowprops=dict(facecolor='red', shrink=0.05))
plt.title('Annotation in Data Coordinates')
plt.show()
Output:
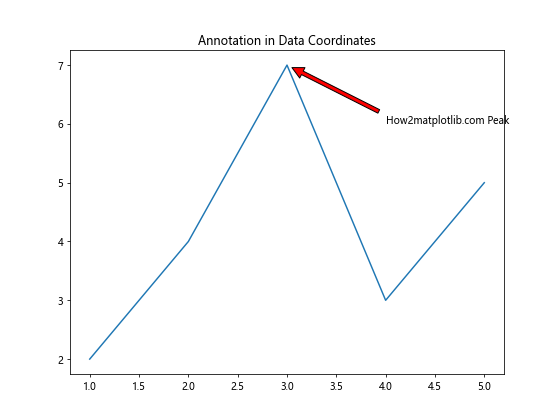
在这个例子中,注释使用数据坐标系,直接指向数据点(3, 7)。
2.2 轴坐标系
轴坐标系使用轴的比例,范围从0到1。
import matplotlib.pyplot as plt

plt.figure(figsize=(8, 6))
plt.plot([1, 2, 3, 4, 5], [2, 4, 7, 3, 5])
plt.annotate('How2matplotlib.com', xy=(0.6, 0.7), xytext=(0.8, 0.8),
             xycoords='axes fraction', textcoords='axes fraction',
             arrowprops=dict(facecolor='green', shrink=0.05))
plt.title('Annotation in Axes Coordinates')
plt.show()
Output:
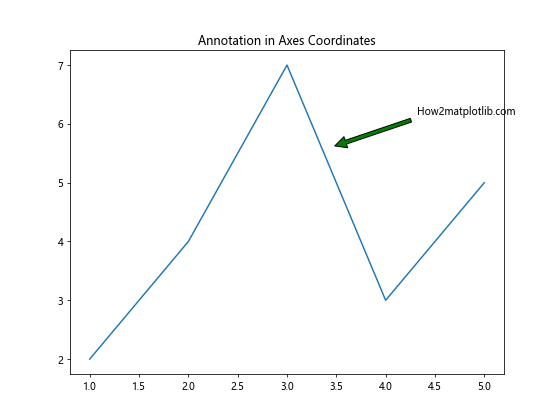
这个例子中,注释使用轴坐标系,(0.6, 0.7)表示在x轴60%和y轴70%的位置。
2.3 图形坐标系
图形坐标系使用整个图形的比例,也是从0到1。
import matplotlib.pyplot as plt

plt.figure(figsize=(8, 6))
plt.plot([1, 2, 3, 4, 5], [2, 4, 7, 3, 5])
plt.annotate('How2matplotlib.com', xy=(0.2, 0.8), xytext=(0.4, 0.9),
             xycoords='figure fraction', textcoords='figure fraction',
             arrowprops=dict(facecolor='blue', shrink=0.05))
plt.title('Annotation in Figure Coordinates')
plt.show()
Output:
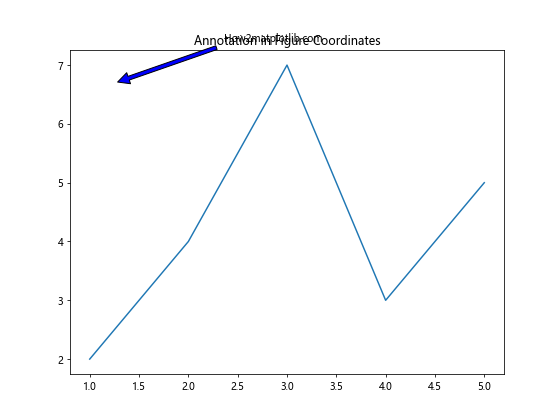
在这个例子中,注释使用图形坐标系,(0.2, 0.8)表示在整个图形宽度的20%和高度的80%的位置。
3. 箭头样式
annotate函数允许自定义箭头的样式,使注释更加醒目和美观。
3.1 基本箭头
最简单的箭头可以通过设置arrowprops参数来实现。
import matplotlib.pyplot as plt

plt.figure(figsize=(8, 6))
plt.plot([1, 2, 3, 4, 5], [2, 4, 7, 3, 5])
plt.annotate('How2matplotlib.com', xy=(3, 7), xytext=(4, 6),
             arrowprops=dict(facecolor='black', shrink=0.05))
plt.title('Basic Arrow Annotation')
plt.show()
Output:
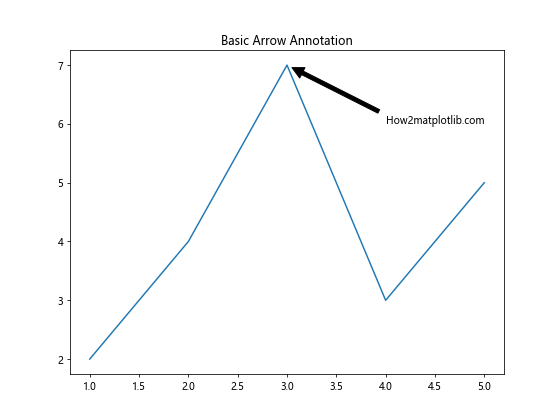
这个例子展示了一个基本的黑色箭头。
3.2 自定义箭头样式
你可以通过调整arrowprops参数来自定义箭头的样式。
import matplotlib.pyplot as plt

plt.figure(figsize=(8, 6))
plt.plot([1, 2, 3, 4, 5], [2, 4, 7, 3, 5])
plt.annotate('How2matplotlib.com', xy=(3, 7), xytext=(4, 6),
             arrowprops=dict(facecolor='red', shrink=0.05, width=4, headwidth=12, headlength=10))
plt.title('Custom Arrow Style')
plt.show()
Output:
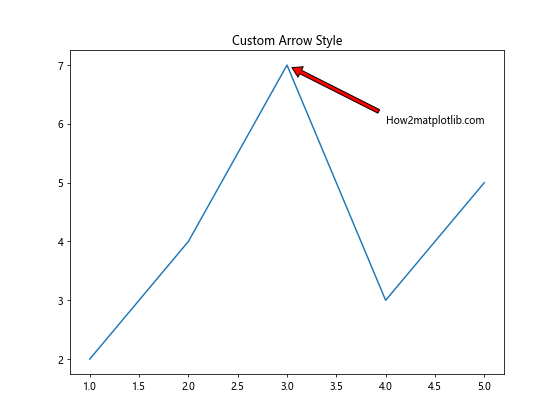
这个例子展示了如何创建一个红色、更粗、箭头更大的注释箭头。
3.3 曲线箭头
你还可以创建曲线箭头,这在某些情况下可能更美观或更清晰。
import matplotlib.pyplot as plt

plt.figure(figsize=(8, 6))
plt.plot([1, 2, 3, 4, 5], [2, 4, 7, 3, 5])
plt.annotate('How2matplotlib.com', xy=(3, 7), xytext=(4, 5),
             arrowprops=dict(facecolor='green', shrink=0.05, connectionstyle="arc3,rad=.2"))
plt.title('Curved Arrow Annotation')
plt.show()
Output:
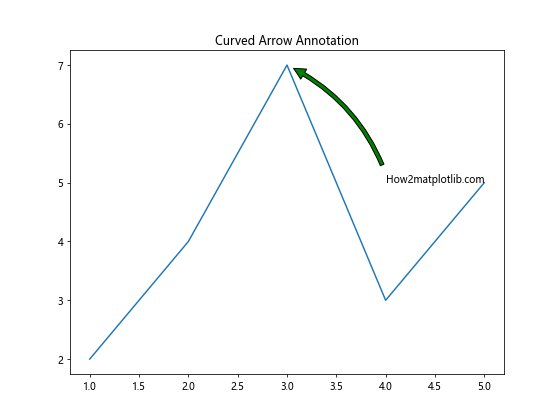
这个例子展示了如何创建一个弯曲的绿色箭头。
4. 文本样式
除了箭头,注释的文本部分也可以进行自定义,以增强可读性和美观性。
4.1 字体样式
你可以更改注释文本的字体、大小和颜色。
import matplotlib.pyplot as plt

plt.figure(figsize=(8, 6))
plt.plot([1, 2, 3, 4, 5], [2, 4, 7, 3, 5])
plt.annotate('How2matplotlib.com', xy=(3, 7), xytext=(4, 6),
             arrowprops=dict(facecolor='black', shrink=0.05),
             fontsize=16, fontweight='bold', color='red')
plt.title('Custom Text Style')
plt.show()
Output:
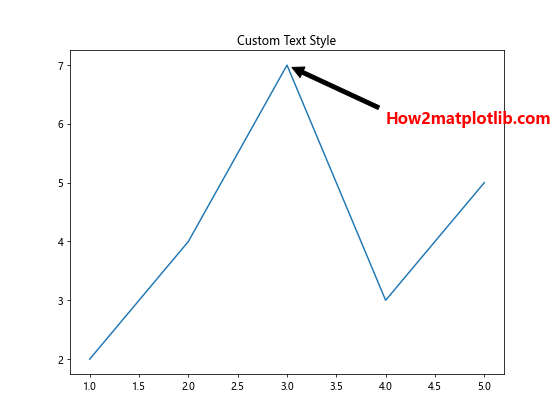
这个例子展示了如何创建一个粗体、大号、红色的注释文本。
4.2 文本框
你可以为注释文本添加一个背景框,使其更加突出。
import matplotlib.pyplot as plt

plt.figure(figsize=(8, 6))
plt.plot([1, 2, 3, 4, 5], [2, 4, 7, 3, 5])
plt.annotate('How2matplotlib.com', xy=(3, 7), xytext=(4, 6),
             arrowprops=dict(facecolor='black', shrink=0.05),
             bbox=dict(boxstyle="round", fc="0.8"))
plt.title('Annotation with Text Box')
plt.show()
Output:
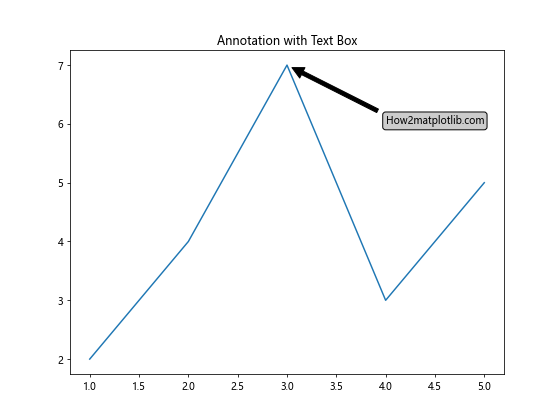
这个例子展示了如何为注释文本添加一个圆角的灰色背景框。
4.3 文本对齐
你可以调整文本的对齐方式,以更好地适应图表布局。
import matplotlib.pyplot as plt

plt.figure(figsize=(8, 6))
plt.plot([1, 2, 3, 4, 5], [2, 4, 7, 3, 5])
plt.annotate('How2matplotlib.com', xy=(3, 7), xytext=(4, 6),
             arrowprops=dict(facecolor='black', shrink=0.05),
             ha='right', va='top')
plt.title('Text Alignment in Annotation')
plt.show()
Output:
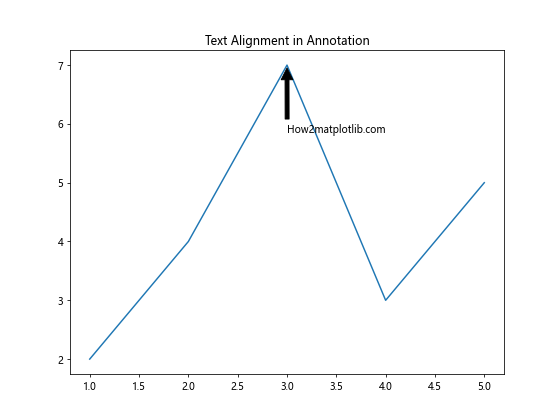
这个例子展示了如何将注释文本右对齐并顶部对齐。
5. 高级应用
annotate函数不仅可以用于简单的文本注释,还可以用于更复杂的应用场景。
5.1 多重注释
你可以在一个图表中添加多个注释,以突出显示多个重要特征。
import matplotlib.pyplot as plt

plt.figure(figsize=(10, 8))
x = [1, 2, 3, 4, 5]
y = [2, 4, 7, 3, 5]
plt.plot(x, y)

plt.annotate('How2matplotlib.com Peak', xy=(3, 7), xytext=(3.5, 8),
             arrowprops=dict(facecolor='red', shrink=0.05))
plt.annotate('How2matplotlib.com Dip', xy=(4, 3), xytext=(4.5, 2),
             arrowprops=dict(facecolor='blue', shrink=0.05))
plt.annotate('How2matplotlib.com Start', xy=(1, 2), xytext=(0.5, 1),
             arrowprops=dict(facecolor='green', shrink=0.05))

plt.title('Multiple Annotations')
plt.show()
Output:
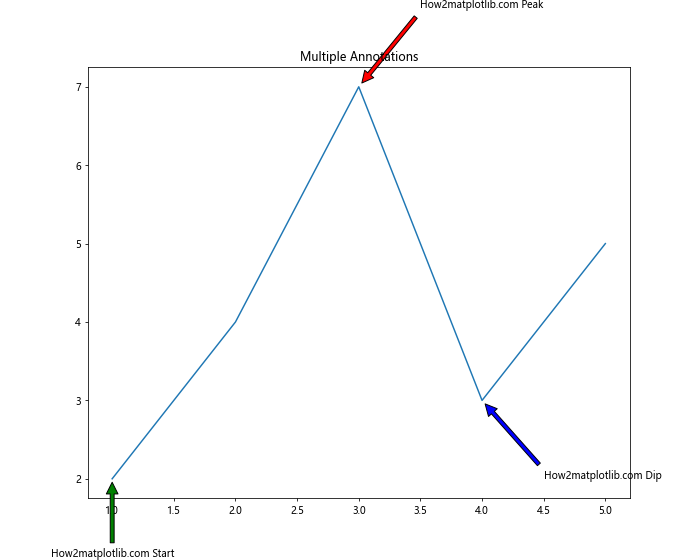
这个例子展示了如何在一个图表中添加多个注释,分别指出峰值、谷值和起始点。
5.2 动态注释
你可以结合Python的循环和条件语句,动态地添加注释。
import matplotlib.pyplot as plt
import numpy as np

plt.figure(figsize=(10, 8))
x = np.linspace(0, 10, 100)
y = np.sin(x)
plt.plot(x, y)

for i, (xi, yi) in enumerate(zip(x, y)):
    if i % 20 == 0:  # 每20个点添加一个注释
        plt.annotate(f'How2matplotlib.com Point {i}', xy=(xi, yi), xytext=(xi+0.5, yi+0.5),
                     arrowprops=dict(facecolor='black', shrink=0.05))

plt.title('Dynamic Annotations')
plt.show()
Output:
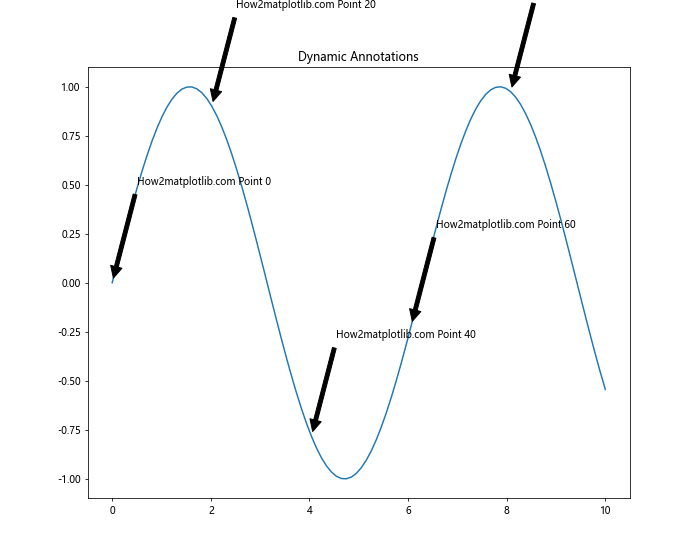
这个例子展示了如何动态地为正弦曲线上的某些点添加注释。
5.3 注释与其他元素的结合
你可以将注释与其他Matplotlib元素结合使用,创建更丰富的可视化效果。
import matplotlib.pyplot as plt
import numpy as np

plt.figure(figsize=(10, 8))
x = np.linspace(0, 10, 100)
y1 = np.sin(x)
y2 = np.cos(x)

plt.plot(x, y1, label='sin')
plt.plot(x, y2, label='cos')

plt.annotate('How2matplotlib.com Intersection', xy=(np.pi/2, 0), xytext=(np.pi/2+1, 0.5),
             arrowprops=dict(facecolor='red', shrink=0.05))

plt.axvline(x=np.pi/2, color='green', linestyle='--')
plt.legend()
plt.title('Combining Annotation with Other Elements')
plt.show()
Output:
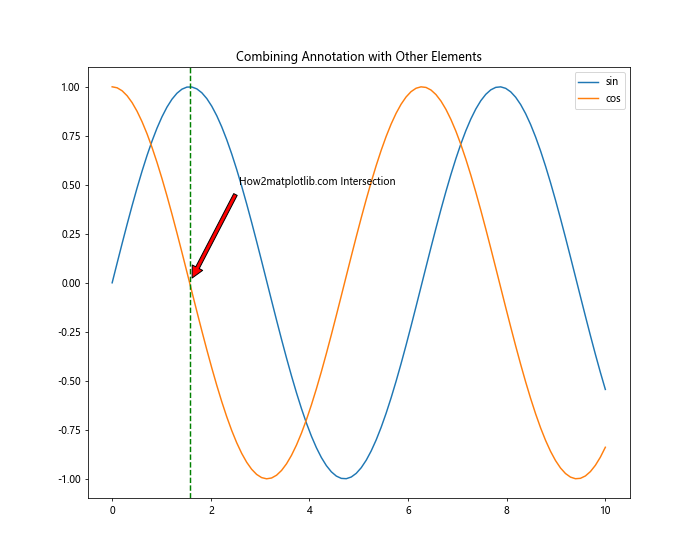
这个例子展示了如何将注释与垂直线和图例结合使用,以突出显示正弦和余弦函数的交点。
6. 注释的定位技巧
正确定位注释对于创建清晰、易读的图表至关重要。以下是一些定位注释的技巧。
6.1 避免重叠
当图表中有多个注释时,避免它们相互重叠是很重要的。
import matplotlib.pyplot as plt
import numpy as np

plt.figure(figsize=(10, 8))
x = np.linspace(0, 10, 100)
y = np.sin(x)
plt.plot(x, y)

offsets = [(1, 1), (-1, 1), (1, -1), (-1, -1)]
for i, (xi, yi) in enumerate(zip(x[::25], y[::25])):
    plt.annotate(f'How2matplotlib.com Point {i}', xy=(xi, yi),
                 xytext=(xi + offsets[i][0], yi + offsets[i][1]),
                 arrowprops=dict(facecolor='black', shrink=0.05))

plt.title('Avoiding Annotation Overlap')
plt.show()
Output:
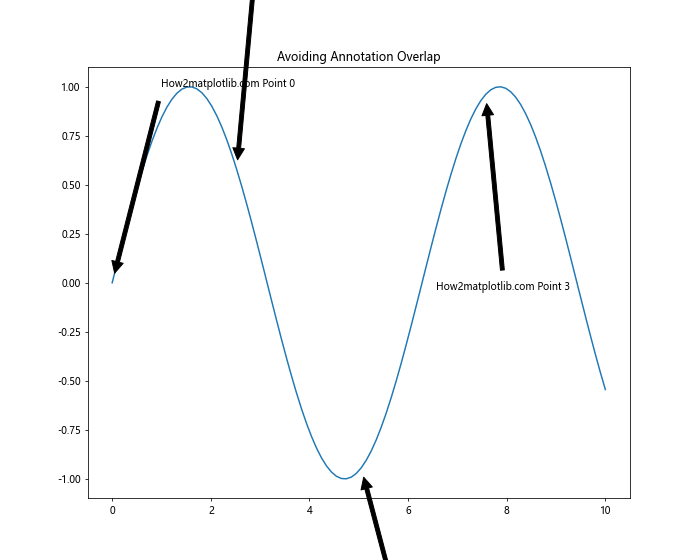
这个例子展示了如何通过使用不同的偏移来避免注释重叠。
6.2 自动定位
Matplotlib提供了一些工具来帮助自动定位注释,避免与数据点或其他图表元素重叠。
import matplotlib.pyplot as plt
from matplotlib.offsetbox import AnnotationBbox, TextArea```python
plt.figure(figsize=(10, 8))
x = [1, 2, 3, 4, 5]
y = [2, 4, 7, 3, 5]
plt.plot(x, y)

for i, (xi, yi) in enumerate(zip(x, y)):
    ab = AnnotationBbox(TextArea(f'How2matplotlib.com Point {i}'), (xi, yi),
                        xybox=(0, 30), xycoords='data',
                        boxcoords="offset points",
                        arrowprops=dict(arrowstyle="->"))
    plt.gca().add_artist(ab)

plt.title('Automatic Annotation Positioning')
plt.show()
这个例子使用AnnotationBbox来自动定位注释,避免与数据点重叠。
6.3 使用极坐标
对于某些类型的图表,如饼图或极坐标图,使用极坐标系来定位注释可能更合适。
import matplotlib.pyplot as plt
import numpy as np

plt.figure(figsize=(10, 10))
r = np.arange(0, 2, 0.01)
theta = 2 * np.pi * r
ax = plt.subplot(111, projection='polar')
ax.plot(theta, r)

angle = np.pi/4
radius = 1
plt.annotate('How2matplotlib.com', xy=(angle, radius),
             xytext=(angle+0.5, radius+0.2),
             arrowprops=dict(facecolor='red', shrink=0.05))

plt.title('Annotation in Polar Coordinates')
plt.show()
Output:
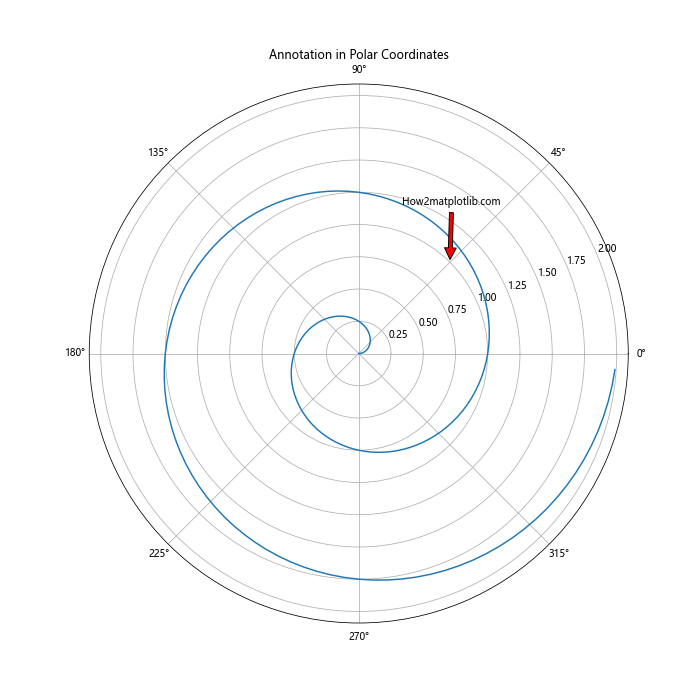
这个例子展示了如何在极坐标系中添加注释。
7. 注释的交互性
Matplotlib还支持创建交互式注释,这在某些应用场景下非常有用。
7.1 鼠标悬停注释
你可以创建只有当鼠标悬停在特定点上时才显示的注释。
import matplotlib.pyplot as plt
from matplotlib.offsetbox import AnnotationBbox, TextArea

fig, ax = plt.subplots(figsize=(10, 8))
x = [1, 2, 3, 4, 5]
y = [2, 4, 7, 3, 5]
ax.plot(x, y)

annot = ax.annotate("", xy=(0,0), xytext=(20,20),textcoords="offset points",
                    bbox=dict(boxstyle="round", fc="w"),
                    arrowprops=dict(arrowstyle="->"))
annot.set_visible(False)

def update_annot(ind):
    pos = sc.get_offsets()[ind["ind"][0]]
    annot.xy = pos
    text = f"How2matplotlib.com\n({pos[0]:.2f}, {pos[1]:.2f})"
    annot.set_text(text)

def hover(event):
    vis = annot.get_visible()
    if event.inaxes == ax:
        cont, ind = sc.contains(event)
        if cont:
            update_annot(ind)
            annot.set_visible(True)
            fig.canvas.draw_idle()
        else:
            if vis:
                annot.set_visible(False)
                fig.canvas.draw_idle()

sc = ax.scatter(x, y)
fig.canvas.mpl_connect("motion_notify_event", hover)

plt.title('Interactive Hover Annotation')
plt.show()
Output:
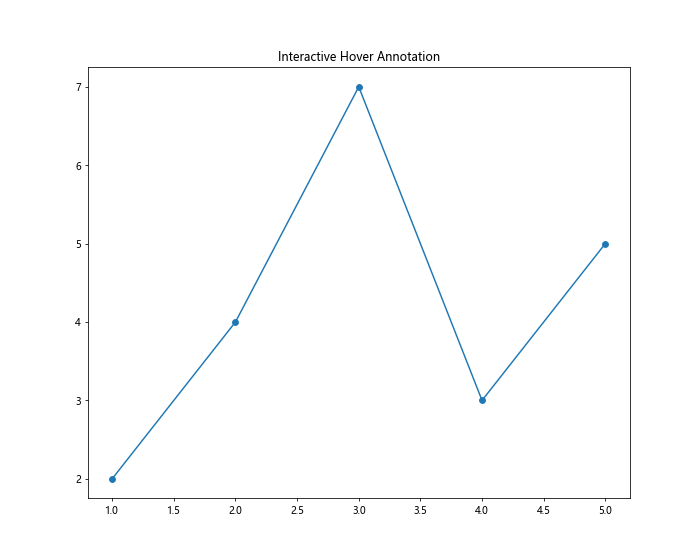
这个例子创建了一个交互式图表,当鼠标悬停在数据点上时,会显示该点的坐标信息。
7.2 可拖动注释
你还可以创建可以通过鼠标拖动的注释。
import matplotlib.pyplot as plt
from matplotlib.offsetbox import AnnotationBbox, TextArea
from matplotlib.patches import Circle

fig, ax = plt.subplots(figsize=(10, 8))
x = [1, 2, 3, 4, 5]
y = [2, 4, 7, 3, 5]
ax.plot(x, y)

annotation = ax.annotate('How2matplotlib.com\nDraggable', xy=(3, 5),
                         xytext=(4, 6),
                         bbox=dict(boxstyle="round", fc="w"),
                         arrowprops=dict(arrowstyle="->"))

annotation.draggable()

plt.title('Draggable Annotation')
plt.show()
Output:
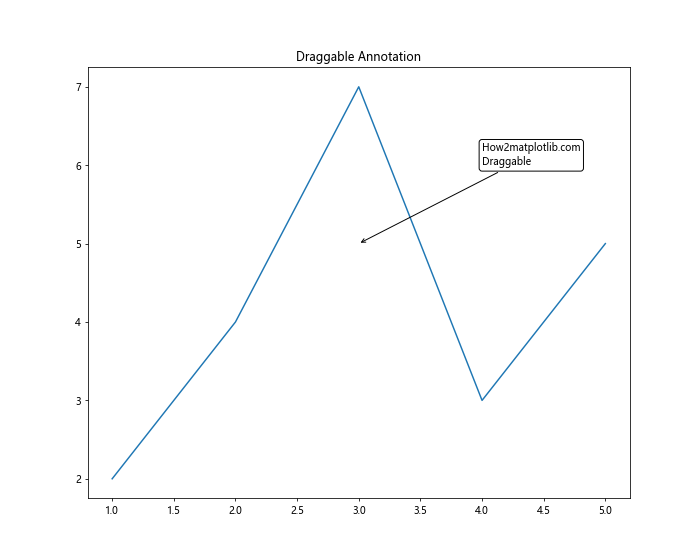
这个例子创建了一个可以通过鼠标拖动的注释。
8. 注释的样式化
除了基本的文本和箭头,你还可以使用更复杂的样式来增强注释的视觉效果。
8.1 使用HTML
Matplotlib支持在注释中使用HTML,这让你可以创建更丰富的文本样式。
import matplotlib.pyplot as plt

plt.figure(figsize=(10, 8))
plt.plot([1, 2, 3, 4, 5], [2, 4, 7, 3, 5])

plt.annotate('<b>How2matplotlib.com</b><br><i>Bold and Italic</i>',
             xy=(3, 7), xytext=(4, 6),
             arrowprops=dict(facecolor='black', shrink=0.05),
             bbox=dict(boxstyle="round", fc="w"),
             fontsize=12, ha='center', va='center')

plt.title('HTML-style Annotation')
plt.show()
Output:
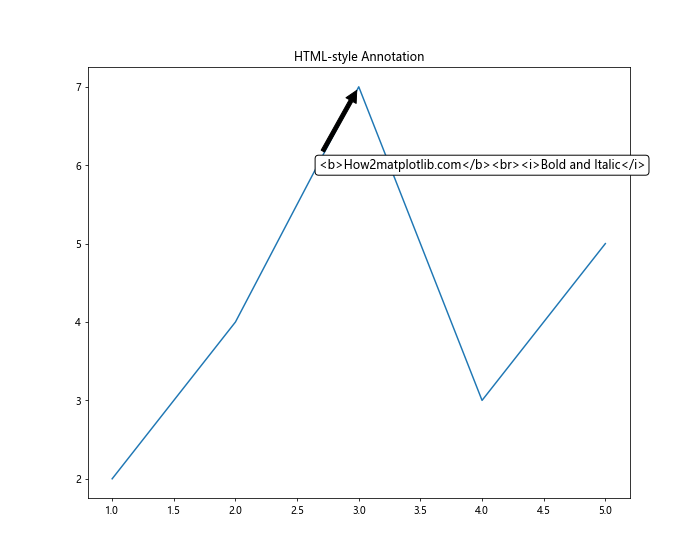
这个例子展示了如何在注释中使用HTML样式的文本。
8.2 使用数学表达式
Matplotlib还支持在注释中使用LaTeX风格的数学表达式。
import matplotlib.pyplot as plt

plt.figure(figsize=(10, 8))
plt.plot([1, 2, 3, 4, 5], [2, 4, 7, 3, 5])

plt.annotate(r'\frac{d}{dx}(x^2) = 2x',
             xy=(3, 7), xytext=(4, 6),
             arrowprops=dict(facecolor='black', shrink=0.05),
             bbox=dict(boxstyle="round", fc="w"),
             fontsize=16)

plt.title('Math Expression in Annotation')
plt.show()
Output:
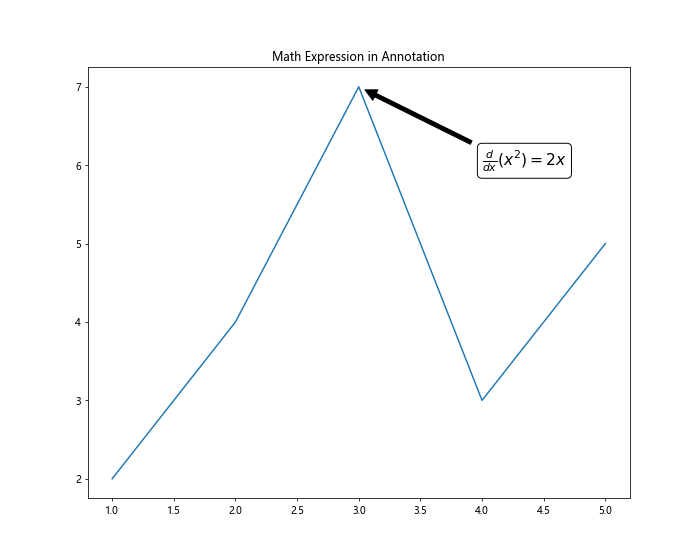
这个例子展示了如何在注释中使用数学表达式。
8.3 自定义形状
你可以使用自定义的形状作为注释的背景。
import matplotlib.pyplot as plt
from matplotlib.patches import Ellipse

plt.figure(figsize=(10, 8))
plt.plot([1, 2, 3, 4, 5], [2, 4, 7, 3, 5])

el = Ellipse((2, -1), 0.5, 0.5)
plt.annotate('How2matplotlib.com', xy=(3, 7), xytext=(4, 6),
             arrowprops=dict(arrowstyle="->"),
             bbox=dict(boxstyle="round", fc="none", ec="gray"),
             fontsize=12, ha='center', va='center')

plt.gca().add_patch(el)

plt.title('Custom Shape Annotation')
plt.show()
Output:
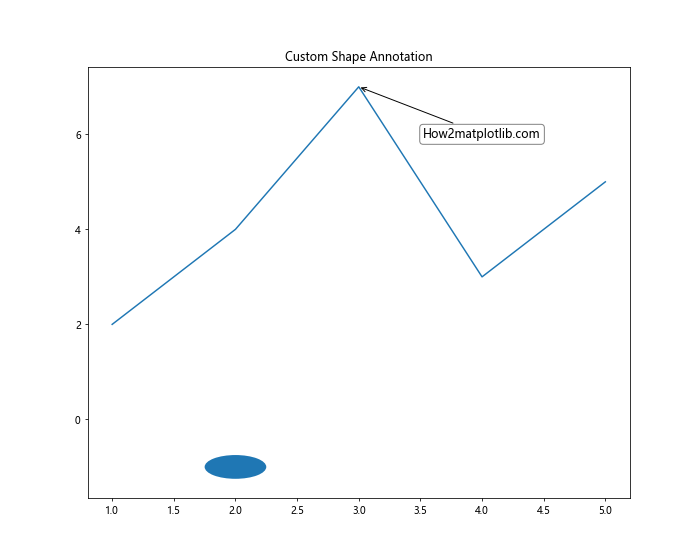
这个例子展示了如何使用自定义形状(椭圆)作为注释的背景。
9. 注释在不同类型图表中的应用
不同类型的图表可能需要不同的注释策略。让我们看看如何在各种常见的图表类型中应用注释。
9.1 散点图中的注释
在散点图中,注释通常用于标记特定的点或点群。
import matplotlib.pyplot as plt
import numpy as np

plt.figure(figsize=(10, 8))
x = np.random.rand(50)
y = np.random.rand(50)
colors = np.random.rand(50)
sizes = 1000 * np.random.rand(50)

plt.scatter(x, y, c=colors, s=sizes, alpha=0.5)

plt.annotate('How2matplotlib.com\nInteresting Point', xy=(0.5, 0.5), xytext=(0.7, 0.7),
             arrowprops=dict(facecolor='black', shrink=0.05),
             bbox=dict(boxstyle="round", fc="w"))

plt.title('Annotation in Scatter Plot')
plt.show()
Output:
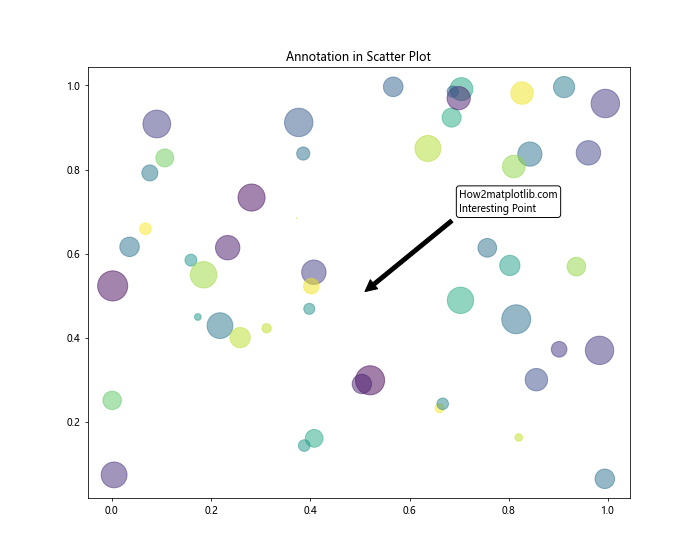
这个例子展示了如何在散点图中添加注释来突出显示一个特定的点。
9.2 柱状图中的注释
在柱状图中,注释可以用来标记特定的柱子或提供额外的信息。
import matplotlib.pyplot as plt
import numpy as np

plt.figure(figsize=(10, 8))
x = ['A', 'B', 'C', 'D', 'E']
y = np.random.randint(10, 50, 5)

bars = plt.bar(x, y)

for i, bar in enumerate(bars):
    height = bar.get_height()
    plt.annotate(f'How2matplotlib.com\nValue: {height}',
                 xy=(bar.get_x() + bar.get_width() / 2, height),
                 xytext=(0, 3),  # 3 points vertical offset
                 textcoords="offset points",
                 ha='center', va='bottom')

plt.title('Annotation in Bar Chart')
plt.show()
Output:
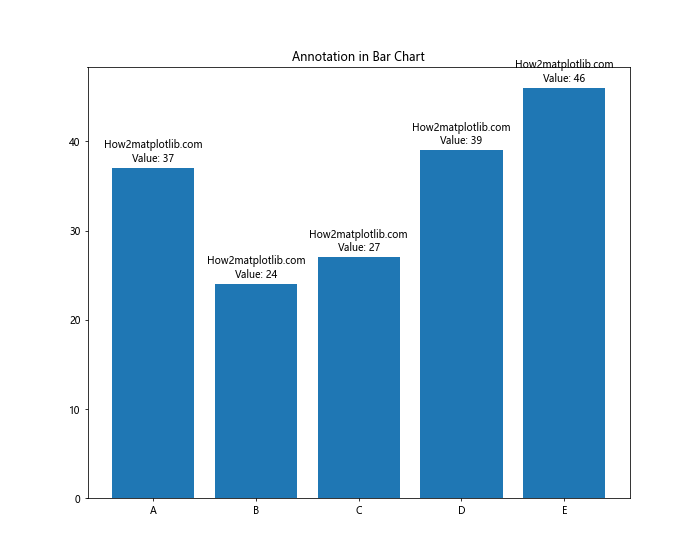
这个例子展示了如何在柱状图的每个柱子上方添加注释来显示具体的数值。
9.3 饼图中的注释
在饼图中,注释通常用于标记每个扇形的具体数值或百分比。
import matplotlib.pyplot as plt

plt.figure(figsize=(10, 8))
sizes = [15, 30, 45, 10]
labels = ['A', 'B', 'C', 'D']
explode = (0, 0.1, 0, 0)  # only "explode" the 2nd slice

plt.pie(sizes, explode=explode, labels=labels, autopct='%1.1f%%', startangle=90)

for i, (label, size) in enumerate(zip(labels, sizes)):
    angle = (i + 0.5) * 2 * np.pi / len(labels)
    x = 1.3 * np.cos(angle)
    y = 1.3 * np.sin(angle)
    plt.annotate(f'How2matplotlib.com\n{label}: {size}', xy=(x, y), ha='center')

plt.axis('equal')  # Equal aspect ratio ensures that pie is drawn as a circle
plt.title('Annotation in Pie Chart')
plt.show()
这个例子展示了如何在饼图中添加注释来显示每个扇形的具体数值。
10. 注释的最佳实践
在使用注释时,有一些最佳实践可以帮助你创建更清晰、更有效的可视化。
10.1 保持简洁
注释应该简洁明了,只包含必要的信息。过多的文字可能会使图表变得杂乱。
import matplotlib.pyplot as plt
import numpy as np

plt.figure(figsize=(10, 8))
x = np.linspace(0, 10, 100)
y = np.sin(x)
plt.plot(x, y)

plt.annotate('How2matplotlib.com\nPeak', xy=(np.pi/2, 1), xytext=(np.pi/2+1, 1.2),
             arrowprops=dict(facecolor='black', shrink=0.05))

plt.title('Concise Annotation')
plt.show()
Output:
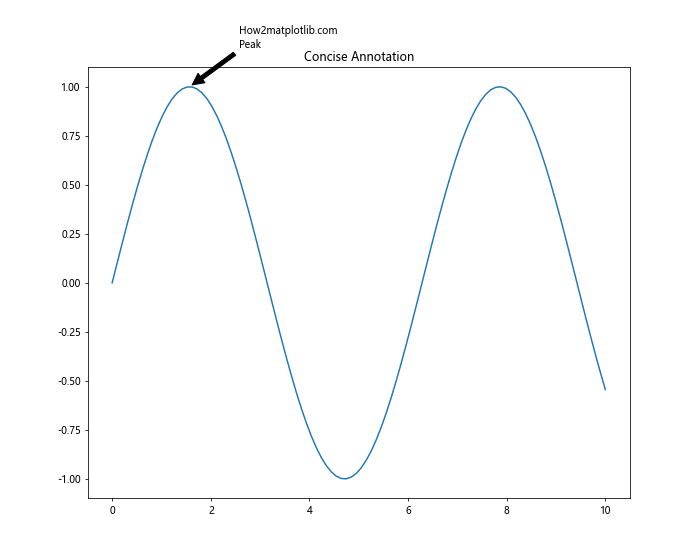
这个例子展示了一个简洁的注释,只标记了正弦函数的峰值。
10.2 使用一致的样式
在同一个图表或一系列相关的图表中,保持注释样式的一致性很重要。
import matplotlib.pyplot as plt
import numpy as np

plt.figure(figsize=(10, 8))
x = np.linspace(0, 10, 100)
y1 = np.sin(x)
y2 = np.cos(x)

plt.plot(x, y1, label='sin')
plt.plot(x, y2, label='cos')

annotation_style = dict(xytext=(15, 15), textcoords='offset points',
                        bbox=dict(boxstyle='round,pad=0.5', fc='yellow', alpha=0.5),
                        arrowprops=dict(arrowstyle='->', connectionstyle='arc3,rad=0'))

plt.annotate('How2matplotlib.com\nSin Peak', xy=(np.pi/2, 1), **annotation_style)
plt.annotate('How2matplotlib.com\nCos Peak', xy=(0, 1), **annotation_style)

plt.legend()
plt.title('Consistent Annotation Style')
plt.show()
Output:
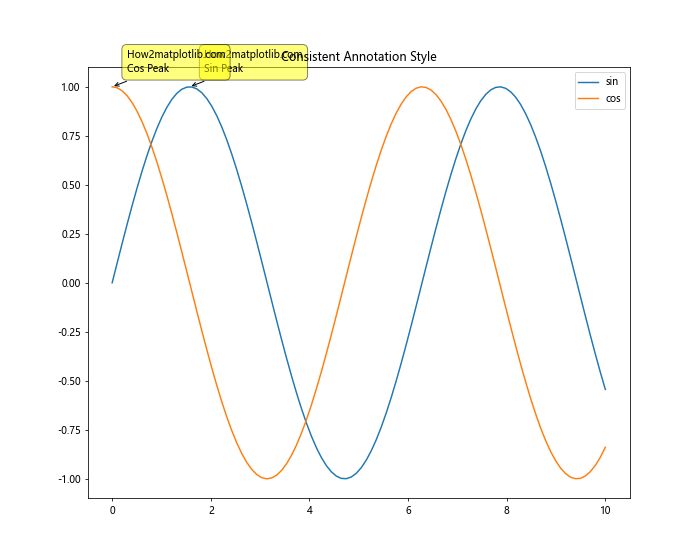
这个例子展示了如何在多个注释中保持一致的样式。
10.3 避免遮挡重要信息
注释不应该遮挡图表中的重要数据点或其他关键信息。
import matplotlib.pyplot as plt
import numpy as np

plt.figure(figsize=(10, 8))
x = np.linspace(0, 10, 100)
y = np.sin(x)
plt.plot(x, y)

plt.annotate('How2matplotlib.com\nPeak', xy=(np.pi/2, 1), xytext=(np.pi/2+2, 1.2),
             arrowprops=dict(facecolor='black', shrink=0.05))

plt.title('Annotation Avoiding Data')
plt.show()
Output:
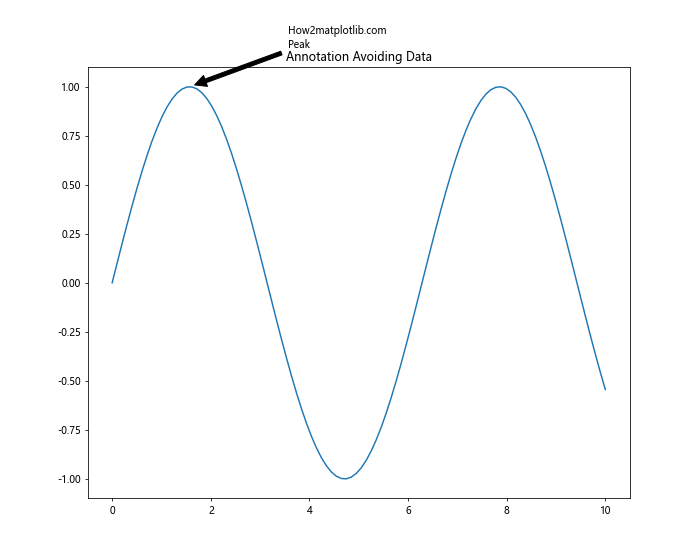
这个例子展示了如何将注释放置在不会遮挡重要数据点的位置。
结论
Matplotlib的annotate函数是一个强大而灵活的工具,可以大大增强你的数据可视化效果。通过本文的详细介绍和丰富的示例,你应该已经掌握了如何使用annotate函数来添加各种类型的注释,包括基本注释、自定义箭头、文本样式、交互式注释等。
记住,好的注释应该能够突出重要信息,提供额外的上下文,并增强图表的整体可读性。在实践中,要根据具体的数据和目标受众来选择适当的注释策略。同时,保持注释的简洁性和一致性也是非常重要的。
最后,不要忘记实践是掌握这些技巧的最好方法。尝试在你自己的数据可视化项目中应用这些技巧,并根据具体需求进行调整。随着经验的积累,你将能够更加熟练地使用annotate函数,创造出更加专业和富有洞察力的数据可视化作品。
11. 高级注释技巧
除了前面介绍的基本和中级技巧,还有一些高级技巧可以帮助你创建更复杂、更精美的注释。
11.1 使用自定义连接样式
Matplotlib提供了多种连接样式,可以用来创建更有趣的箭头。
import matplotlib.pyplot as plt
import numpy as np

plt.figure(figsize=(12, 8))
x = np.linspace(0, 10, 100)
y = np.sin(x)
plt.plot(x, y)

connection_styles = [
    'arc3,rad=0.2', 'arc3,rad=-0.2',
    'angle3,angleA=0,angleB=90', 'angle,angleA=-90,angleB=180,rad=0'
]

for i, style in enumerate(connection_styles):
    plt.annotate(f'How2matplotlib.com\nStyle: {style}',
                 xy=(np.pi/2, 1), xytext=(5+i, 0.5),
                 arrowprops=dict(arrowstyle='->', connectionstyle=style))

plt.title('Custom Connection Styles')
plt.show()
Output:
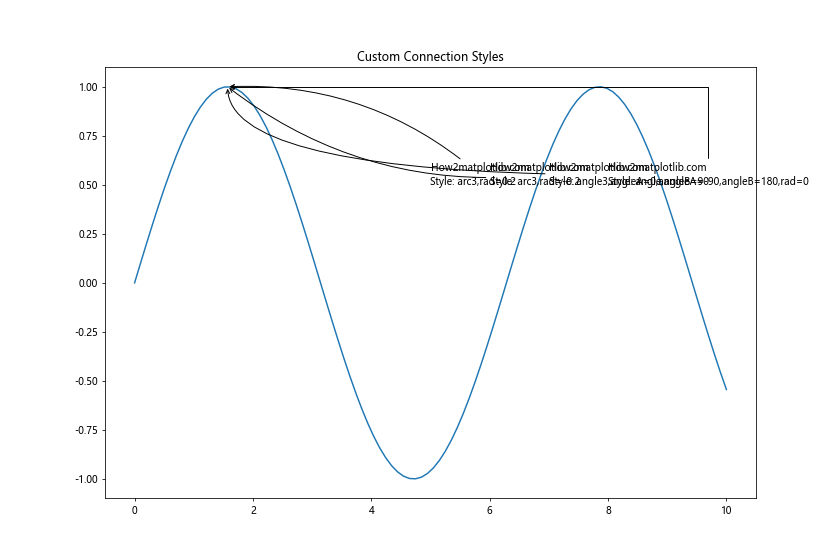
这个例子展示了如何使用不同的连接样式来创建各种形状的箭头。
11.2 注释组
有时,你可能想要将多个注释作为一个组来处理。这可以通过创建一个自定义的AnnotationBbox对象来实现。
import matplotlib.pyplot as plt
from matplotlib.offsetbox import AnnotationBbox, TextArea, VPacker

fig, ax = plt.subplots(figsize=(10, 8))
x = [1, 2, 3, 4, 5]
y = [2, 4, 7, 3, 5]
ax.plot(x, y)

text1 = TextArea("How2matplotlib.com", textprops=dict(color="r"))
text2 = TextArea("Peak Value", textprops=dict(color="b"))
texts = VPacker(children=[text1, text2], align="center", pad=5)

ab = AnnotationBbox(texts, (3, 7),
                    xybox=(4, 6),
                    xycoords='data',
                    boxcoords="data",
                    arrowprops=dict(arrowstyle="->"))

ax.add_artist(ab)

plt.title('Grouped Annotations')
plt.show()
Output:
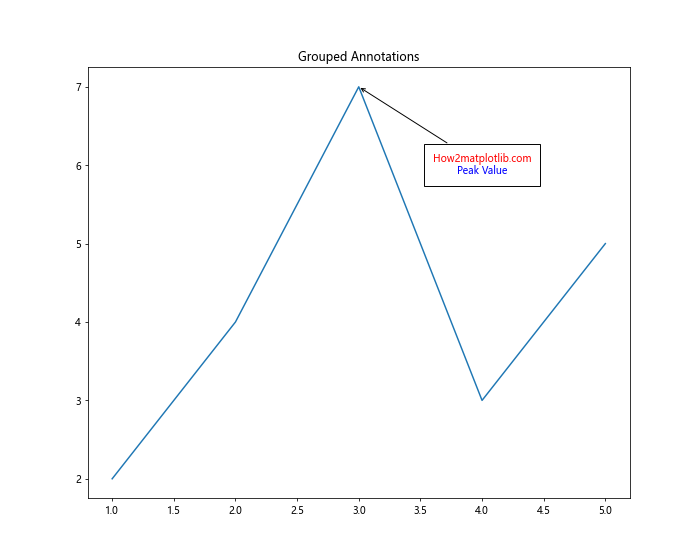
这个例子展示了如何创建一个包含多行文本的注释组。
11.3 动态注释位置
在某些情况下,你可能需要根据数据动态调整注释的位置。
import matplotlib.pyplot as plt
import numpy as np

plt.figure(figsize=(10, 8))
x = np.linspace(0, 10, 100)
y = np.sin(x)
plt.plot(x, y)

max_index = np.argmax(y)
max_x, max_y = x[max_index], y[max_index]

# 动态计算注释位置
if max_x < 5:
    xytext = (max_x + 2, max_y)
else:
    xytext = (max_x - 2, max_y)

plt.annotate(f'How2matplotlib.com\nMax: ({max_x:.2f}, {max_y:.2f})',
             xy=(max_x, max_y), xytext=xytext,
             arrowprops=dict(facecolor='black', shrink=0.05))

plt.title('Dynamic Annotation Positioning')
plt.show()
Output:
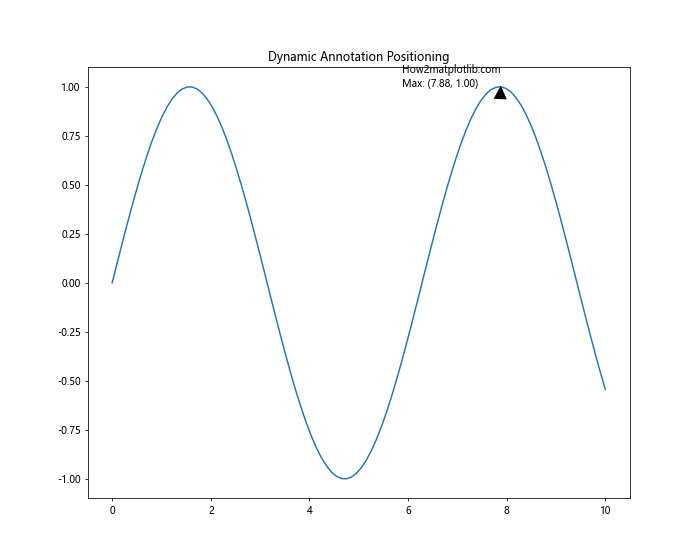
这个例子展示了如何根据最大值的位置动态调整注释的位置。
12. 注释在特殊图表中的应用
某些特殊类型的图表可能需要特殊的注释技巧。
12.1 在3D图中添加注释
在3D图中添加注释需要特别注意z轴。
import matplotlib.pyplot as plt
from mpl_toolkits.mplot3d import Axes3D
import numpy as np

fig = plt.figure(figsize=(10, 8))
ax = fig.add_subplot(111, projection='3d')

x = np.linspace(-5, 5, 100)
y = np.linspace(-5, 5, 100)
X, Y = np.meshgrid(x, y)
Z = np.sin(np.sqrt(X**2 + Y**2))

surf = ax.plot_surface(X, Y, Z)

ax.text(0, 0, 1, "How2matplotlib.com\nPeak", fontsize=12)

plt.title('3D Plot with Annotation')
plt.show()
Output:
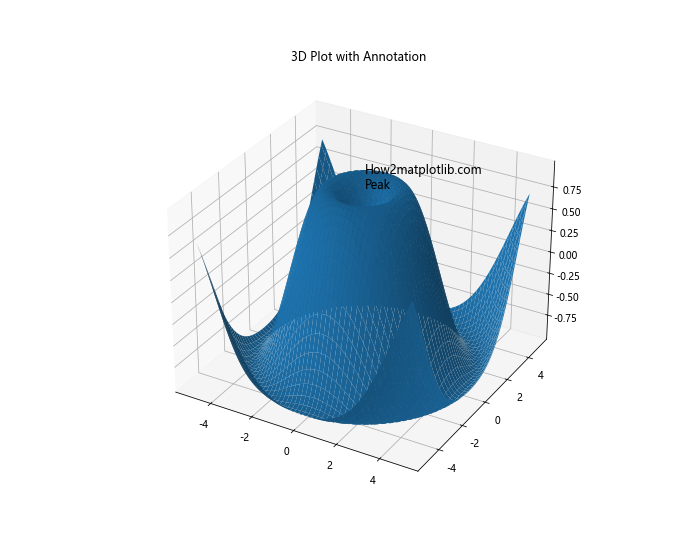
这个例子展示了如何在3D图中添加文本注释。
12.2 在热图中添加注释
在热图中,你可能想要为每个单元格添加数值标注。
import matplotlib.pyplot as plt
import numpy as np

plt.figure(figsize=(10, 8))
data = np.random.rand(5, 5)
im = plt.imshow(data, cmap='YlOrRd')

for i in range(5):
    for j in range(5):
        text = plt.text(j, i, f'{data[i, j]:.2f}',
                        ha="center", va="center", color="black")

plt.colorbar(im)
plt.title('Heatmap with Annotations')
plt.show()
Output:
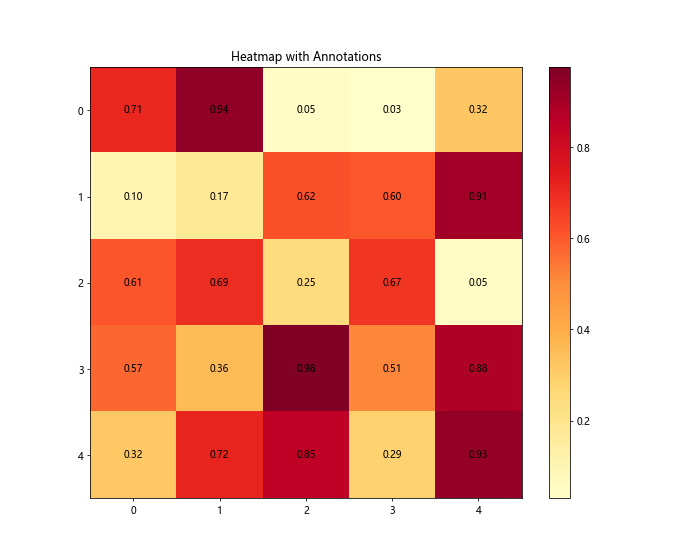
这个例子展示了如何在热图的每个单元格中添加数值注释。
13. 注释的性能考虑
当处理大量数据或需要添加大量注释时,性能可能会成为一个问题。以下是一些提高性能的技巧:
13.1 使用blitting
对于动画或交互式图表,使用blitting可以显著提高性能。
import matplotlib.pyplot as plt
import numpy as np

fig, ax = plt.subplots(figsize=(10, 8))

x = np.linspace(0, 10, 100)
y = np.sin(x)
line, = ax.plot(x, y)

annotation = ax.annotate('How2matplotlib.com', xy=(0, 0), xytext=(0, 1))

def update(frame):
    annotation.set_position((frame, np.sin(frame)))
    annotation.xy = (frame, np.sin(frame))
    return annotation,

from matplotlib.animation import FuncAnimation
ani = FuncAnimation(fig, update, frames=np.linspace(0, 10, 100),
                    blit=True, interval=50)

plt.title('Animated Annotation with Blitting')
plt.show()
Output:
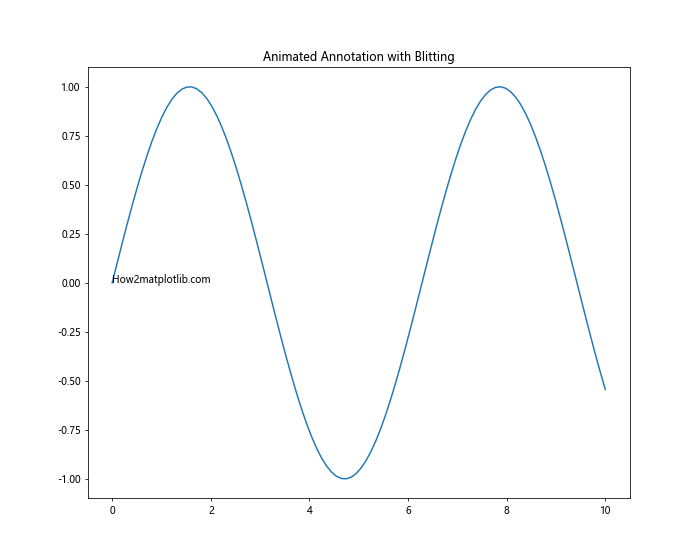
这个例子展示了如何使用blitting来创建一个高效的动画注释。
13.2 减少注释数量
对于大数据集,可以考虑只为关键点添加注释,而不是为每个数据点都添加注释。
import matplotlib.pyplot as plt
import numpy as np

plt.figure(figsize=(10, 8))
x = np.linspace(0, 10, 1000)
y = np.sin(x) + np.random.normal(0, 0.1, 1000)

plt.plot(x, y)

# 只为局部最大值添加注释
peaks, _ = find_peaks(y, distance=100)
for peak in peaks:
    plt.annotate(f'How2matplotlib.com\nPeak', xy=(x[peak], y[peak]),
                 xytext=(0, 20), textcoords='offset points',
                 arrowprops=dict(arrowstyle="->"))

plt.title('Selective Annotation for Large Datasets')
plt.show()
这个例子展示了如何只为数据中的峰值添加注释,而不是为每个点都添加注释。
结语
通过本文的详细介绍,我们深入探讨了Matplotlib中annotate函数的各种用法和技巧。从基本的文本注释到复杂的交互式注释,从2D图表到3D图表,我们涵盖了广泛的应用场景。
记住,注释的目的是增强数据可视化的信息传递效果。好的注释应该是清晰、准确、恰到好处的,既不应该遮挡重要的数据点,也不应该使图表变得杂乱。在实际应用中,要根据具体的数据特征和目标受众来选择适当的注释策略。
随着你在实践中不断尝试和运用这些技巧,你将能够创造出更加专业、更具洞察力的数据可视化作品。希望本文能够帮助你更好地掌握Matplotlib的annotate函数,为你的数据可视化之旅添砖加瓦。
 极客笔记
极客笔记