Matplotlib 中的注释旋转:如何使用 annotate 和 rotate 实现灵活的文本标注
Matplotlib 是 Python 中最流行的数据可视化库之一,它提供了丰富的功能来创建各种类型的图表和图形。在数据可视化中,添加注释是一种重要的技术,可以帮助我们突出显示重要信息或解释图表中的特定元素。Matplotlib 的 annotate 函数是一个强大的工具,可以用来添加文本注释,而 rotate 参数则允许我们旋转这些注释,以适应不同的布局需求。本文将深入探讨如何在 Matplotlib 中使用 annotate 和 rotate 来创建灵活的文本标注。
1. Matplotlib annotate 函数简介
annotate 函数是 Matplotlib 中用于添加注释的主要工具。它允许我们在图表上的任何位置添加文本,并可以选择性地包含指向特定数据点的箭头。
基本用法
让我们从一个简单的例子开始:
import matplotlib.pyplot as plt
import numpy as np

fig, ax = plt.subplots()
x = np.linspace(0, 10, 100)
y = np.sin(x)
ax.plot(x, y)

ax.annotate('Peak', xy=(np.pi/2, 1), xytext=(3, 1.5),
            arrowprops=dict(facecolor='black', shrink=0.05))

ax.set_title('How to use annotate in Matplotlib - how2matplotlib.com')
plt.show()
Output:
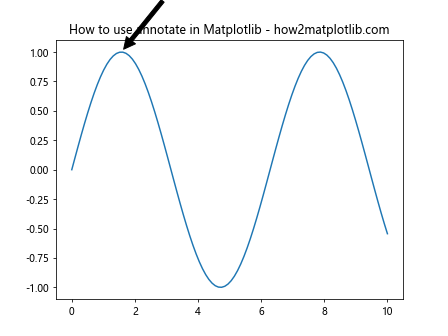
在这个例子中,我们绘制了一个正弦波,并在其峰值处添加了一个注释。annotate 函数的主要参数包括:
- 文本内容:’Peak’
xy:箭头指向的坐标点xytext:文本的位置arrowprops:箭头的属性
2. 旋转注释文本
有时,我们可能需要旋转注释文本以适应图表布局或强调某些方向。这可以通过 rotation 参数来实现。
使用固定角度旋转
import matplotlib.pyplot as plt
import numpy as np

fig, ax = plt.subplots()
x = np.linspace(0, 10, 100)
y = np.cos(x)
ax.plot(x, y)

ax.annotate('Rotated Text', xy=(5, 0), xytext=(6, 0.5),
            rotation=45,
            arrowprops=dict(facecolor='red', shrink=0.05))

ax.set_title('Rotated annotation - how2matplotlib.com')
plt.show()
Output:
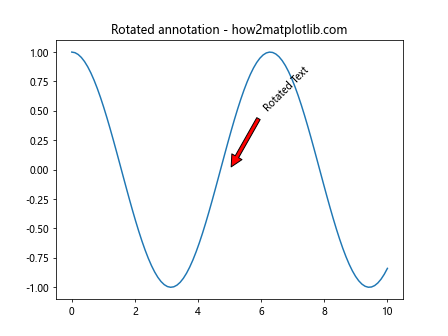
在这个例子中,我们将注释文本旋转了 45 度。rotation 参数接受一个角度值,单位为度。
动态调整旋转角度
有时,我们可能想要根据数据的斜率来动态调整注释的旋转角度:
import matplotlib.pyplot as plt
import numpy as np

fig, ax = plt.subplots()
x = np.linspace(0, 10, 100)
y = x**2
ax.plot(x, y)

slope = 2 * 5  # 在 x=5 处的斜率
angle = np.degrees(np.arctan(slope))

ax.annotate('Dynamic Rotation', xy=(5, 25), xytext=(3, 40),
            rotation=angle,
            arrowprops=dict(facecolor='green', shrink=0.05))

ax.set_title('Dynamic rotation based on slope - how2matplotlib.com')
plt.show()
Output:
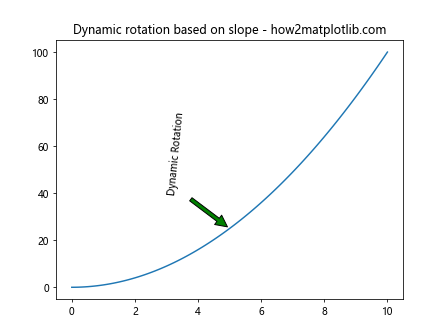
这个例子展示了如何根据函数在特定点的斜率来旋转注释文本。
3. 高级注释技巧
使用 bbox 美化注释
我们可以使用 bbox 参数来为注释添加背景框,使其更加醒目:
import matplotlib.pyplot as plt
import numpy as np

fig, ax = plt.subplots()
x = np.linspace(0, 10, 100)
y = np.exp(-x/10) * np.cos(x)
ax.plot(x, y)

ax.annotate('Fancy Box', xy=(2, 0.5), xytext=(4, 0.8),
            rotation=30,
            bbox=dict(boxstyle="round,pad=0.3", fc="yellow", ec="b", lw=2),
            arrowprops=dict(arrowstyle="->"))

ax.set_title('Annotation with fancy box - how2matplotlib.com')
plt.show()
Output:
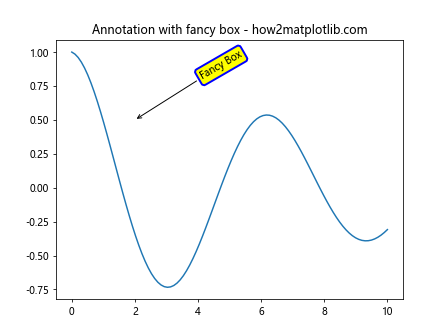
这个例子展示了如何使用 bbox 参数来创建一个带有圆角、黄色填充和蓝色边框的注释框。
多行注释
对于较长的注释,我们可能需要使用多行文本:
import matplotlib.pyplot as plt
import numpy as np

fig, ax = plt.subplots()
x = np.linspace(0, 10, 100)
y = np.sin(x) * np.exp(-x/10)
ax.plot(x, y)

ax.annotate('Multi-line\nAnnotation\nExample', xy=(5, 0.3), xytext=(7, 0.4),
            rotation=15,
            ha='center', va='center',
            bbox=dict(boxstyle="round", fc="w", ec="0.5", alpha=0.9),
            arrowprops=dict(arrowstyle="->", connectionstyle="angle,angleA=0,angleB=90,rad=10"))

ax.set_title('Multi-line annotation - how2matplotlib.com')
plt.show()
Output:
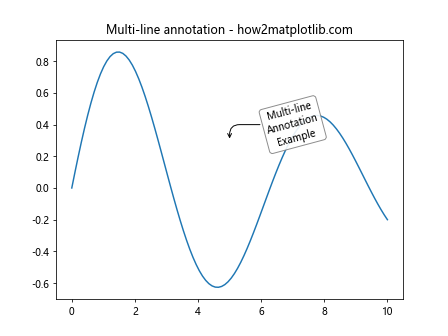
这个例子展示了如何创建多行注释,并使用 \n 来分隔行。
4. 注释的定位和对齐
使用相对坐标
有时,我们可能想要使用相对于坐标轴的位置来放置注释:
import matplotlib.pyplot as plt
import numpy as np

fig, ax = plt.subplots()
x = np.linspace(0, 10, 100)
y = np.sin(x)
ax.plot(x, y)

ax.annotate('Relative Position', xy=(0.5, 0.5), xytext=(0.7, 0.7),
            xycoords='axes fraction', textcoords='axes fraction',
            rotation=30,
            arrowprops=dict(arrowstyle="->"))

ax.set_title('Annotation with relative coordinates - how2matplotlib.com')
plt.show()
Output:
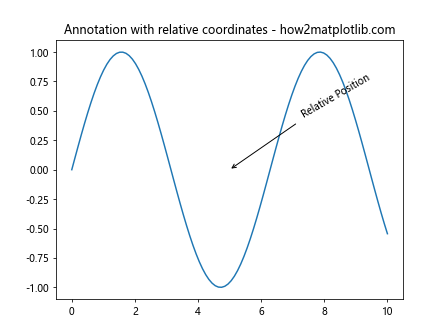
在这个例子中,我们使用 xycoords 和 textcoords 参数来指定坐标系统为 ‘axes fraction’,这意味着坐标值是相对于整个坐标轴的比例。
对齐注释文本
我们可以使用 ha (horizontal alignment) 和 va (vertical alignment) 参数来精确控制注释文本的对齐方式:
import matplotlib.pyplot as plt
import numpy as np

fig, ax = plt.subplots()
x = np.linspace(0, 10, 100)
y = np.cos(x)
ax.plot(x, y)

ax.annotate('Right Aligned', xy=(5, 0), xytext=(5, 0.5),
            ha='right', va='bottom',
            rotation=45,
            arrowprops=dict(arrowstyle="->"))

ax.set_title('Text alignment in annotation - how2matplotlib.com')
plt.show()
Output:
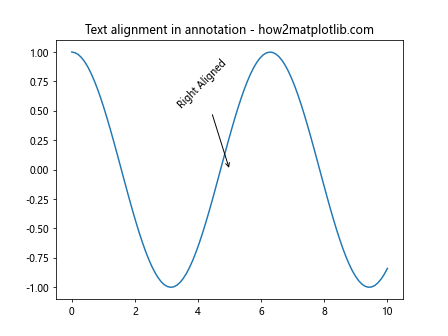
这个例子展示了如何将注释文本右对齐并底部对齐。
5. 注释样式的定制
自定义字体样式
我们可以使用 fontproperties 参数来自定义注释文本的字体样式:
import matplotlib.pyplot as plt
import numpy as np
from matplotlib.font_manager import FontProperties

fig, ax = plt.subplots()
x = np.linspace(0, 10, 100)
y = np.sin(x) * np.cos(x)
ax.plot(x, y)

font = FontProperties()
font.set_family('serif')
font.set_name('Times New Roman')
font.set_style('italic')
font.set_weight('bold')
font.set_size(14)

ax.annotate('Custom Font', xy=(5, 0.3), xytext=(7, 0.5),
            fontproperties=font,
            rotation=20,
            arrowprops=dict(arrowstyle="->"))

ax.set_title('Annotation with custom font - how2matplotlib.com')
plt.show()
Output:
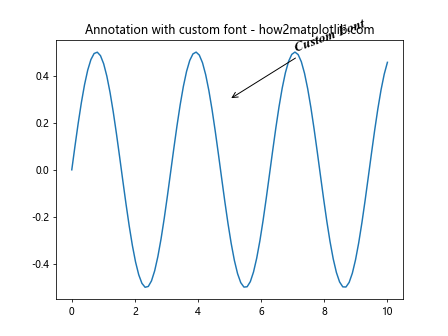
这个例子展示了如何使用 FontProperties 对象来自定义注释文本的字体样式。
使用 LaTeX 渲染数学公式
Matplotlib 支持使用 LaTeX 来渲染数学公式,这在科学图表中特别有用:
import matplotlib.pyplot as plt
import numpy as np

fig, ax = plt.subplots()
x = np.linspace(0, 10, 100)
y = np.sin(x)
ax.plot(x, y)

ax.annotate(r'\sin(x) = \frac{e^{ix} - e^{-ix}}{2i}',
            xy=(np.pi, 0), xytext=(5, 0.5),
            rotation=15,
            bbox=dict(boxstyle="round", fc="w", ec="0.5", alpha=0.9),
            arrowprops=dict(arrowstyle="->"))

ax.set_title('LaTeX annotation - how2matplotlib.com')
plt.show()
Output:
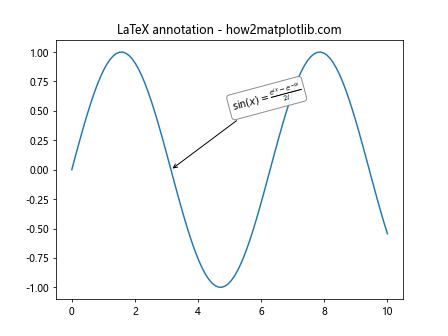
在这个例子中,我们使用 LaTeX 语法来渲染一个复杂的数学公式作为注释。
6. 动态注释
根据数据动态生成注释
有时,我们可能需要根据数据动态生成多个注释:
import matplotlib.pyplot as plt
import numpy as np

fig, ax = plt.subplots()
x = np.linspace(0, 10, 100)
y = np.sin(x)
ax.plot(x, y)

peaks = x[np.where((y[1:-1] > y[:-2]) & (y[1:-1] > y[2:]))[0] + 1]

for i, peak in enumerate(peaks):
    ax.annotate(f'Peak {i+1}', xy=(peak, np.sin(peak)),
                xytext=(peak+0.5, np.sin(peak)+0.3),
                rotation=45,
                arrowprops=dict(arrowstyle="->"))

ax.set_title('Dynamic annotations for peaks - how2matplotlib.com')
plt.show()
Output:
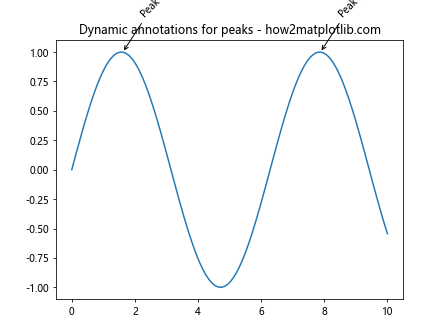
这个例子展示了如何自动检测峰值并为每个峰值添加动态注释。
交互式注释
使用 Matplotlib 的事件处理系统,我们可以创建交互式注释:
import matplotlib.pyplot as plt
import numpy as np

fig, ax = plt.subplots()
x = np.linspace(0, 10, 100)
y = np.sin(x)
line, = ax.plot(x, y)

annotation = ax.annotate('', xy=(0, 0), xytext=(20, 20), textcoords="offset points",
                         bbox=dict(boxstyle="round", fc="w"),
                         arrowprops=dict(arrowstyle="->"))
annotation.set_visible(False)

def update_annotation(event):
    if event.inaxes == ax:
        x, y = event.xdata, event.ydata
        annotation.xy = (x, y)
        annotation.set_text(f'x={x:.2f}, y={y:.2f}')
        annotation.set_visible(True)
        fig.canvas.draw_idle()
    else:
        annotation.set_visible(False)
        fig.canvas.draw_idle()

fig.canvas.mpl_connect('motion_notify_event', update_annotation)

ax.set_title('Interactive annotation - how2matplotlib.com')
plt.show()
Output:
这个例子创建了一个交互式注释,它会随着鼠标在图表上的移动而更新位置和内容。
7. 注释的动画效果
我们可以使用 Matplotlib 的动画功能来创建动态的注释效果:
import matplotlib.pyplot as plt
import numpy as np
from matplotlib.animation import FuncAnimation

fig, ax = plt.subplots()
x = np.linspace(0, 10, 100)
y = np.sin(x)
line, = ax.plot(x, y)

annotation = ax.annotate('Moving Annotation', xy=(0, 0), xytext=(0, 1.1),
                         arrowprops=dict(arrowstyle="->"),
                         bbox=dict(boxstyle="round", fc="w"),
                         ha='center')

def update(frame):
    t = frame / 50 * 2 * np.pi
    x = 5 + 3 * np.cos(t)
    y = np.sin(x)
    annotation.xy = (x, y)
    annotation.set_position((x, y + 0.5))
    annotation.set_text(f'x={x:.2f}, y={y:.2f}')
    return annotation,

ani = FuncAnimation(fig, update, frames=100, interval=50, blit=True)

ax.set_title('Animated annotation - how2matplotlib.com')
plt.show()
Output:
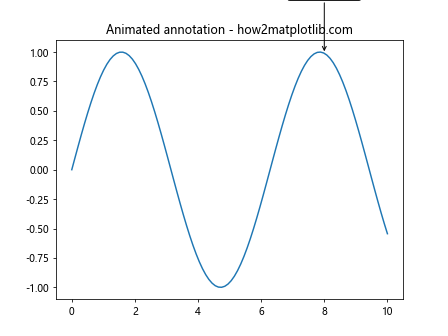
这个例子创建了一个动画,其中注释沿着正弦曲线移动。
8. 多图注释
当我们有多个子图时,我们可能需要在不同的子图之间添加注释:
import matplotlib.pyplot as plt
import numpy as np

fig, (ax1, ax2) = plt.subplots(1, 2, figsize=(12, 5))

x = np.linspace(0, 10, 100)
ax1.plot(x, np.sin(x))
ax2.plot(x, np.cos(x))

ax1.annotate('Sine Wave', xy=(np.pi/2, 1), xytext=(4, 0.5),
             arrowprops=dict(arrowstyle="->"),
             rotation=30)

ax2.annotate('Cosine Wave', xy=(0, 1), xytext=(2, 0.5),
             arrowprops=dict(arrowstyle="->"),
             rotation=-30)

fig.suptitlefig.suptitle('Multiple subplot annotations - how2matplotlib.com')
plt.show()
这个例子展示了如何在具有多个子图的图形中添加注释。每个子图都有自己的注释,并且注释的旋转角度不同。
9. 注释的层次和叠加
在复杂的图表中,我们可能需要添加多层注释或处理注释的叠加问题:
import matplotlib.pyplot as plt
import numpy as np

fig, ax = plt.subplots()
x = np.linspace(0, 10, 100)
y1 = np.sin(x)
y2 = np.cos(x)
ax.plot(x, y1, label='sin(x)')
ax.plot(x, y2, label='cos(x)')

ax.annotate('Intersection', xy=(np.pi/4, np.sin(np.pi/4)),
            xytext=(1, 0.8), rotation=15,
            arrowprops=dict(arrowstyle="->", connectionstyle="arc3,rad=.2"))

ax.annotate('Peak', xy=(np.pi/2, 1),
            xytext=(np.pi/2, 1.2), rotation=0,
            ha='center', va='bottom',
            bbox=dict(boxstyle="round,pad=0.3", fc="yellow", ec="b", lw=2),
            arrowprops=dict(arrowstyle="->"))

ax.legend()
ax.set_title('Layered annotations - how2matplotlib.com')
plt.show()
Output:
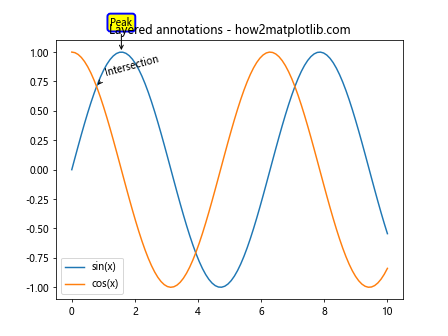
这个例子展示了如何在同一图表中添加多个注释,并处理它们的层次关系。我们使用不同的样式和位置来确保注释不会相互遮挡。
10. 注释的自动调整
在某些情况下,我们可能希望注释的位置能够自动调整以避免与其他元素重叠:
import matplotlib.pyplot as plt
import numpy as np
from adjustText import adjust_text

fig, ax = plt.subplots()
x = np.linspace(0, 10, 20)
y = np.sin(x)
ax.scatter(x, y)

texts = []
for i, (xi, yi) in enumerate(zip(x, y)):
    texts.append(ax.text(xi, yi, f'P{i}', ha='center', va='center'))

adjust_text(texts, x, y, arrowprops=dict(arrowstyle='->', color='red'))

ax.set_title('Auto-adjusted annotations - how2matplotlib.com')
plt.show()
这个例子使用了 adjustText 库来自动调整文本注释的位置,以避免重叠。注意,你可能需要先安装 adjustText 库(pip install adjustText)。
11. 3D 图形中的注释
Matplotlib 也支持在 3D 图形中添加注释,尽管这需要一些额外的考虑:
import matplotlib.pyplot as plt
import numpy as np

fig = plt.figure()
ax = fig.add_subplot(111, projection='3d')

x = np.linspace(-5, 5, 100)
y = np.linspace(-5, 5, 100)
X, Y = np.meshgrid(x, y)
Z = np.sin(np.sqrt(X**2 + Y**2))

surf = ax.plot_surface(X, Y, Z, cmap='viridis')

ax.text(0, 0, 1, "Peak", fontsize=12, bbox=dict(facecolor='white', alpha=0.7))
ax.text(4, 4, 0, "Valley", fontsize=12, bbox=dict(facecolor='white', alpha=0.7))

ax.set_title('3D annotations - how2matplotlib.com')
plt.show()
Output:
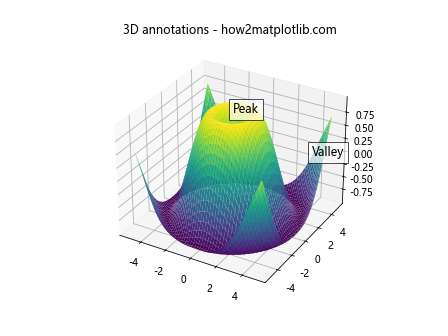
在 3D 图形中,我们使用 text 方法而不是 annotate,因为 annotate 在 3D 轴中的行为可能不如预期。
12. 注释的样式一致性
在创建复杂的图表时,保持注释样式的一致性是很重要的。我们可以定义一个函数来统一注释样式:
import matplotlib.pyplot as plt
import numpy as np

def custom_annotate(ax, text, xy, xytext, rotation=0):
    return ax.annotate(text, xy=xy, xytext=xytext,
                       rotation=rotation,
                       bbox=dict(boxstyle="round,pad=0.3", fc="yellow", ec="b", lw=2),
                       arrowprops=dict(arrowstyle="->", connectionstyle="arc3,rad=0.2"))

fig, ax = plt.subplots()
x = np.linspace(0, 10, 100)
y = np.sin(x) * np.exp(-x/10)
ax.plot(x, y)

custom_annotate(ax, 'Peak', xy=(1.6, 0.6), xytext=(3, 0.8), rotation=15)
custom_annotate(ax, 'Decay', xy=(5, 0.1), xytext=(6, 0.3), rotation=-15)

ax.set_title('Consistent annotation style - how2matplotlib.com')
plt.show()
Output:
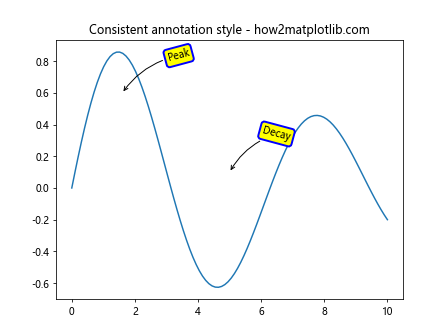
这个例子定义了一个自定义函数 custom_annotate,它封装了一致的注释样式,使得在整个图表中保持统一的外观变得容易。
13. 注释中的特殊效果
Matplotlib 允许我们在注释中添加一些特殊效果,比如阴影或渐变:
import matplotlib.pyplot as plt
import numpy as np
from matplotlib.patheffects import withStroke

fig, ax = plt.subplots()
x = np.linspace(0, 10, 100)
y = np.sin(x)
ax.plot(x, y)

text = ax.annotate('Shadow Effect', xy=(np.pi, 1), xytext=(4, 1.2),
                   arrowprops=dict(arrowstyle="->"),
                   bbox=dict(boxstyle="round", fc="w", ec="0.5", alpha=0.8),
                   fontsize=16, color='white',
                   path_effects=[withStroke(linewidth=3, foreground="black")])

ax.set_title('Annotation with special effects - how2matplotlib.com')
plt.show()
Output:
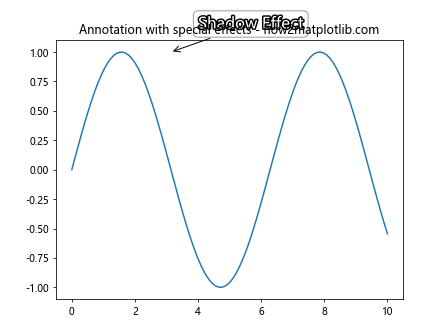
这个例子展示了如何给注释文本添加阴影效果,使其在图表上更加醒目。
14. 注释的动态更新
在某些情况下,我们可能需要根据用户交互或数据变化动态更新注释的内容:
import matplotlib.pyplot as plt
import numpy as np

fig, ax = plt.subplots()
x = np.linspace(0, 10, 100)
y = np.sin(x)
line, = ax.plot(x, y)

annotation = ax.annotate('', xy=(0, 0), xytext=(3, 1),
                         arrowprops=dict(arrowstyle="->"))

def update_annotation(event):
    if event.inaxes == ax:
        x = event.xdata
        y = np.sin(x)
        annotation.xy = (x, y)
        annotation.set_text(f'sin({x:.2f}) = {y:.2f}')
        fig.canvas.draw_idle()

fig.canvas.mpl_connect('motion_notify_event', update_annotation)

ax.set_title('Dynamic annotation update - how2matplotlib.com')
plt.show()
Output:
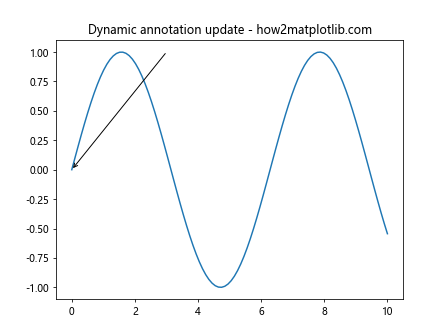
这个例子创建了一个动态更新的注释,它会根据鼠标在图表上的位置实时计算和显示正弦函数的值。
15. 注释的导出和保存
当我们创建了包含注释的图表后,可能需要将其保存为图像文件。以下是如何确保注释在保存的图像中正确显示:
import matplotlib.pyplot as plt
import numpy as np

fig, ax = plt.subplots(figsize=(10, 6), dpi=300)
x = np.linspace(0, 10, 100)
y = np.sin(x)
ax.plot(x, y)

ax.annotate('Important Point', xy=(np.pi, 0), xytext=(4, 0.5),
            arrowprops=dict(arrowstyle="->"),
            bbox=dict(boxstyle="round", fc="w", ec="0.5", alpha=0.8),
            rotation=15)

ax.set_title('Saving annotations - how2matplotlib.com')

plt.tight_layout()
plt.savefig('annotated_plot.png', dpi=300, bbox_inches='tight')
plt.show()
Output:
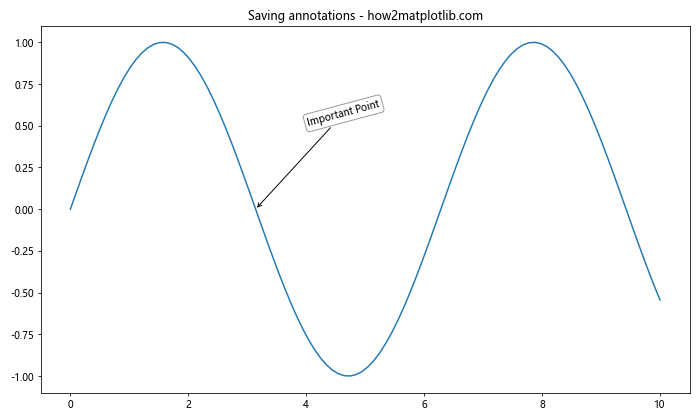
这个例子展示了如何使用 savefig 函数保存包含注释的图表。使用 bbox_inches='tight' 参数可以确保所有元素(包括注释)都被完整地包含在保存的图像中。
结论
Matplotlib 的 annotate 函数和 rotate 参数为数据可视化提供了强大而灵活的文本标注工具。通过本文介绍的各种技巧和示例,你应该能够在自己的数据可视化项目中创建出富有表现力和信息量的注释。从基本的文本标注到复杂的交互式注释,从 2D 图表到 3D 可视化,Matplotlib 都提供了相应的解决方案。
记住,好的注释应该能够增强图表的可读性和信息传递能力,而不是分散读者的注意力。因此,在使用这些技巧时,始终要考虑注释的目的和整体设计的和谐性。通过实践和经验,你将能够掌握在 Matplotlib 中创建优秀注释的艺术,使你的数据可视化作品更加专业和有说服力。
 极客笔记
极客笔记