Matplotlib 锚定艺术家
参考:matplotlib anchored artists
Matplotlib 是一个用于创建数据可视化的强大工具,它提供了各种功能和选项来定制图表和图形。在本文中,我们将重点介绍 Matplotlib 中的锚定艺术家(anchored artists),这些艺术家可以帮助我们在图表中添加注释、图例和其他定位艺术家。
AnchoredText
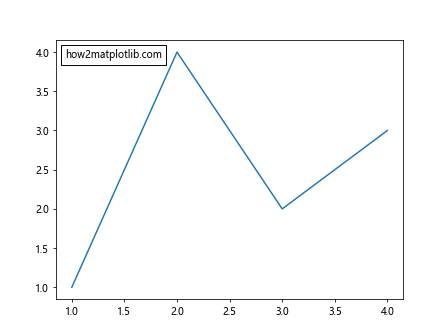
AnchoredText 是一个用于在图表中添加文本注释的艺术家。下面是一个简单的示例代码,演示如何在图表中添加一个锚定的文本注释:
import matplotlib.pyplot as plt
from matplotlib.offsetbox import AnchoredText

fig, ax = plt.subplots()
ax.plot([1, 2, 3, 4], [1, 4, 2, 3])

at = AnchoredText("how2matplotlib.com", loc='upper left')
ax.add_artist(at)

plt.show()
Output:

在这个示例中,我们创建了一个简单的折线图,并使用 AnchoredText 在图表的左上角添加了一个文本注释。
AnchoredSizeBar
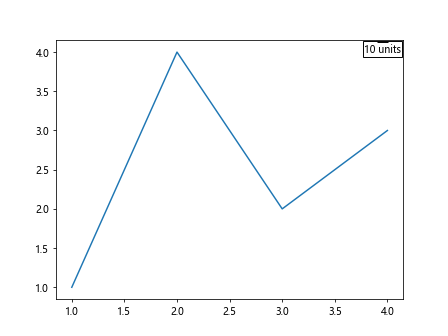
AnchoredSizeBar 是一个用于在图表中添加尺寸标尺的艺术家。下面是一个示例代码,演示如何在图表中添加一个锚定的尺寸标尺:
import matplotlib.pyplot as plt
from mpl_toolkits.axes_grid1.anchored_artists import AnchoredSizeBar

fig, ax = plt.subplots()
ax.plot([1, 2, 3, 4], [1, 4, 2, 3])

asb = AnchoredSizeBar(ax.transData, 0.1, "10 units", loc='upper right')
ax.add_artist(asb)

plt.show()
Output:

在这个示例中,我们创建了一个简单的折线图,并使用 AnchoredSizeBar 在图表的右上角添加了一个尺寸标尺。
AnchoredDirectionArrows
AnchoredDirectionArrows 是一个用于在图表中添加方向箭头的艺术家。下面是一个示例代码,演示如何在图表中添加一个锚定的方向箭头:
import matplotlib.pyplot as plt
from mpl_toolkits.axes_grid1.anchored_artists import AnchoredDirectionArrows

fig, ax = plt.subplots()
ax.plot([1, 2, 3, 4], [1, 4, 2, 3])

ada = AnchoredDirectionArrows(ax.transData, "N", loc='upper right')
ax.add_artist(ada)

plt.show()
在这个示例中,我们创建了一个简单的折线图,并使用 AnchoredDirectionArrows 在图表的右上角添加了一个方向箭头。
AnchoredEllipse
AnchoredEllipse 是一个用于在图表中添加椭圆形状的艺术家。下面是一个示例代码,演示如何在图表中添加一个锚定的椭圆形状:
import matplotlib.pyplot as plt
from mpl_toolkits.axes_grid1.anchored_artists import AnchoredEllipse

fig, ax = plt.subplots()
ax.plot([1, 2, 3, 4], [1, 4, 2, 3])

ae = AnchoredEllipse(ax.transData, width=2, height=1, angle=45, loc='lower left')
ax.add_artist(ae)

plt.show()
在这个示例中,我们创建了一个简单的折线图,并使用 AnchoredEllipse 在图表的左下角添加了一个椭圆形状。
AnchoredOffsetbox
AnchoredOffsetbox 是一个用于在图表中添加偏移框的艺术家。下面是一个示例代码,演示如何在图表中添加一个锚定的偏移框:
import matplotlib.pyplot as plt
from matplotlib.offsetbox import AnchoredOffsetbox, AuxTransformBox

fig, ax = plt.subplots()
ax.plot([1, 2, 3, 4], [1, 4, 2, 3])

atb = AnchoredOffsetbox(loc='upper right')
atb.drawing_area.add_artist(AuxTransformBox(ax.transData))
ax.add_artist(atb)

plt.show()
在这个示例中,我们创建了一个简单的折线图,并使用 AnchoredOffsetbox 在图表的右上角添加了一个偏移框。
AnchoredArtists
AnchoredArtists 是一个用于在图表中添加其他锚定艺术家的容器。下面是一个示例代码,演示如何在图表中添加一个锚定的艺术家容器:
import matplotlib.pyplot as plt
from mpl_toolkits.axes_grid1.anchored_artists import AnchoredArtists

fig, ax = plt.subplots()
ax.plot([1, 2, 3, 4], [1, 4, 2, 3])

aa = AnchoredArtists(ax.transData, loc='upper right')
ax.add_artist(aa)

plt.show()
在这个示例中,我们创建了一个简单的折线图,并使用 AnchoredArtists 在图表的右上角添加了一个艺术家容器。
AnchoredGrid
AnchoredGrid 是一个用于在图表中添加网格线的艺术家。下面是一个示例代码,演示如何在图表中添加一个锚定的网格线:
import matplotlib.pyplot as plt
from mpl_toolkits.axes_grid1.anchored_artists import AnchoredGrid

fig, ax = plt.subplots()
ax.plot([1, 2, 3, 4], [1, 4, 2, 3])

ag = AnchoredGrid(1, 1, 1, 1, loc='upper right')
ax.add_artist(ag)

plt.show()
在这个示例中,我们创建了一个简单的折线图,并使用 AnchoredGrid 在图表的右上角添加了一个网格线。
AnchoredOffsetbox
AnchoredOffsetbox 是一个用于在图表中添加偏移框的艺术家。下面是一个示例代码,演示如何在图表中添加一个锚定的偏移框:
import matplotlib.pyplot as plt
from matplotlib.offsetbox import AnchoredOffsetbox, AuxTransformBox

fig, ax = plt.subplots()
ax.plot([1, 2, 3, 4], [1, 4, 2, 3])

atb = AnchoredOffsetbox(loc='upper right')
atb.drawing_area.add_artist(AuxTransformBox(ax.transData))
ax.add_artist(atb)

plt.show()
在这个示例中,我们创建了一个简单的折线图,并使用 AnchoredOffsetbox 在图表的右上角添加了一个偏移框。
AnchoredSizeBar
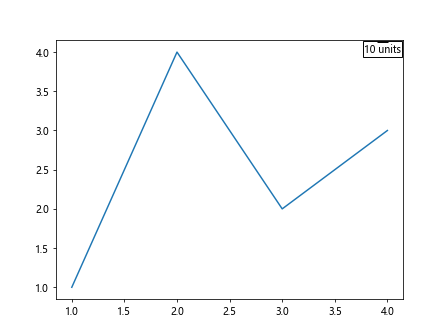
AnchoredSizeBar 是一个用于在图表中添加尺寸标尺的艺术家。下面是一个示例代码,演示如何在图表中添加一个锚定的尺寸标尺:
import matplotlib.pyplot as plt
from mpl_toolkits.axes_grid1.anchored_artists import AnchoredSizeBar

fig, ax = plt.subplots()
ax.plot([1, 2, 3, 4], [1, 4, 2, 3])

asb = AnchoredSizeBar(ax.transData, 0.1, "10 units", loc='upper right')
ax.add_artist(asb)

plt.show()
Output:

在这个示例中,我们创建了一个简单的折线图,并使用 AnchoredSizeBar 在图表的右上角添加了一个尺寸标尺。
AnchoredText
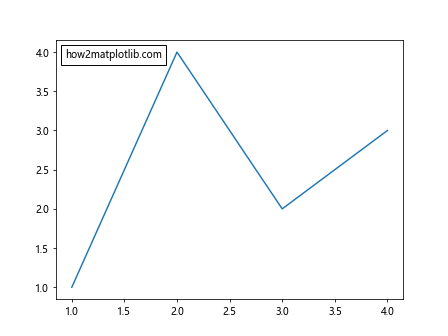
AnchoredText 是一个用于在图表中添加文本注释的艺术家。下面是一个简单的示例代码,演示如何在图表中添加一个锚定的文本注释:
import matplotlib.pyplot as plt
from matplotlib.offsetbox import AnchoredText

fig, ax = plt.subplots()
ax.plot([1, 2, 3, 4], [1, 4, 2, 3])

at = AnchoredText("how2matplotlib.com", loc='upper left')
ax.add_artist(at)

plt.show()
Output:

在这个示例中,我们创建了一个简单的折线图,并使用 AnchoredText 在图表的左上角添加了一个文本注释。
总结
在本文中,我们介绍了 Matplotlib 中的锚定艺术家,包括 AnchoredText、AnchoredSizeBar、AnchoredDirectionArrows、AnchoredEllipse、AnchoredOffsetbox、AnchoredArtists、AnchoredGrid 等。这些艺术家为我们提供了丰富的选项,可以帮助我们在图表中添加各种注释、标尺、方向箭头等元素,从而使图表更加丰富和具有信息量。通过灵活运用这些锚定艺术家,我们可以定制出各种各样的图表,满足不同的需求和场景。
 极客笔记
极客笔记