Matplotlib为图表添加标题
参考:matplotlib add title to figure
Matplotlib是Python中一个非常流行的绘图库,用于创建各种类型的图表和图形。在绘制图表时,有时我们需要向图表添加标题以帮助观众更好地理解图表的含义。本文将介绍如何在Matplotlib中为图表添加标题。
1. 在绘图时添加标题
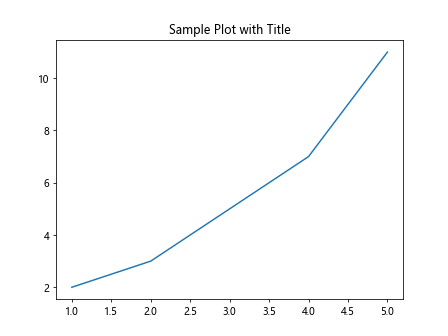
在Matplotlib中,我们可以使用plt.title()函数来为图表添加标题。该函数接受一个字符串作为标题内容,并显示在图表的上方中心位置。
import matplotlib.pyplot as plt

x = [1, 2, 3, 4, 5]
y = [2, 3, 5, 7, 11]

plt.plot(x, y)
plt.title('Sample Plot with Title')
plt.show()
Output:
2. 自定义标题样式
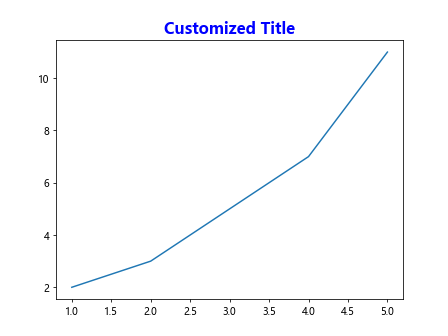
除了简单的文本标题外,我们还可以通过fontdict参数自定义标题的样式,如字体颜色、大小、粗细等。
import matplotlib.pyplot as plt

x = [1, 2, 3, 4, 5]
y = [2, 3, 5, 7, 11]

plt.plot(x, y)
plt.title('Customized Title', fontdict={'fontsize': 16, 'fontweight': 'bold', 'color': 'blue'})
plt.show()
Output:
3. 嵌入特殊字符
有时候,我们需要在标题中嵌入特殊的字符,比如希腊字母或数学符号。Matplotlib支持使用LaTeX语法来实现这一功能。
import matplotlib.pyplot as plt

x = [1, 2, 3, 4, 5]
y = [2, 3, 5, 7, 11]

plt.plot(x, y)
plt.title('It is \pi', fontdict={'fontsize': 16})
plt.show()
4. 多行标题
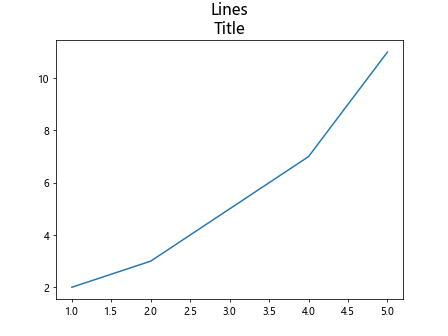
如果标题内容比较长,可以使用\n来换行,实现多行标题的效果。
import matplotlib.pyplot as plt

x = [1, 2, 3, 4, 5]
y = [2, 3, 5, 7, 11]

plt.plot(x, y)
plt.title('Multiple\nLines\nTitle', fontdict={'fontsize': 16})
plt.show()
Output:
5. 为子图添加标题
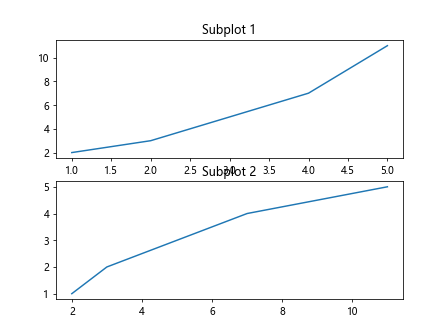
在绘制多个子图时,我们也可以为每个子图分别添加标题。这可以通过在对应的plt对象上使用set_title()方法来实现。
import matplotlib.pyplot as plt

x = [1, 2, 3, 4, 5]
y = [2, 3, 5, 7, 11]

fig, axs = plt.subplots(2)
axs[0].plot(x, y)
axs[0].set_title('Subplot 1')
axs[1].plot(y, x)
axs[1].set_title('Subplot 2')
plt.show()
Output:
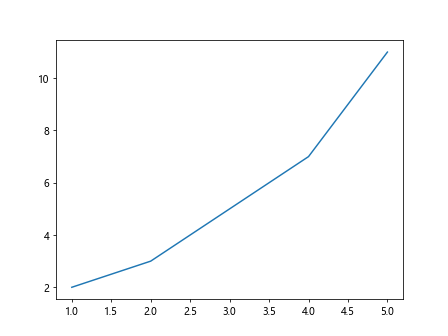
6. 在图表外添加标题
除了在图表内部添加标题外,有时我们也希望将标题放在整个图表的外部,以便更清晰地区分不同图表。
import matplotlib.pyplot as plt

x = [1, 2, 3, 4, 5]
y = [2, 3, 5, 7, 11]

plt.plot(x, y)
plt.suptitle('Title Outside Figure', fontsize=16, y=1.05)
plt.show()
Output:
7. 在图表中心添加标题
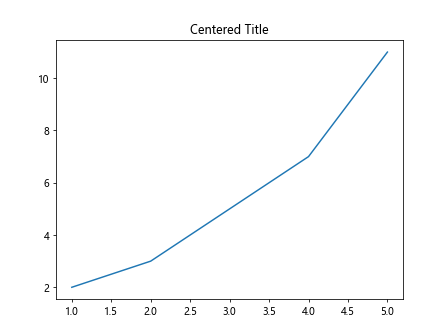
有时候,我们希望标题不仅在图表的上方,还希望将其居中显示。可以使用loc参数来指定标题的位置。
import matplotlib.pyplot as plt

x = [1, 2, 3, 4, 5]
y = [2, 3, 5, 7, 11]

plt.plot(x, y)
plt.title('Centered Title', loc='center')
plt.show()
Output:
8. 超长标题处理
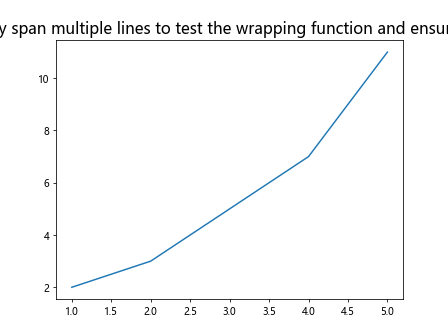
如果标题内容非常长,超出图表范围,Matplotlib会自动调整标题的位置和大小,以确保标题内容完整显示。
import matplotlib.pyplot as plt

x = [1, 2, 3, 4, 5]
y = [2, 3, 5, 7, 11]

plt.plot(x, y)
plt.title('This is an extremely long title that may span multiple lines to test the wrapping function and ensure that all content is displayed correctly.', fontsize=16)
plt.show()
Output:
9. 标题对齐方式
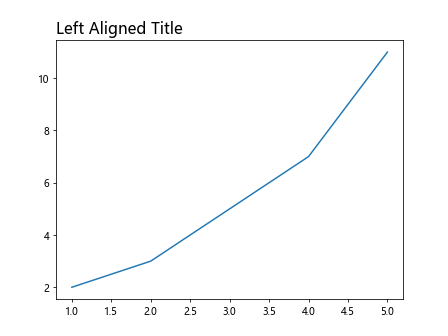
除了居中显示外,我们还可以将标题左对齐或右对齐。这可以通过ha参数来实现。
import matplotlib.pyplot as plt

x = [1, 2, 3, 4, 5]
y = [2, 3, 5, 7, 11]

plt.plot(x, y)
plt.title('Left Aligned Title', loc='left', fontsize=16)
plt.show()
Output:
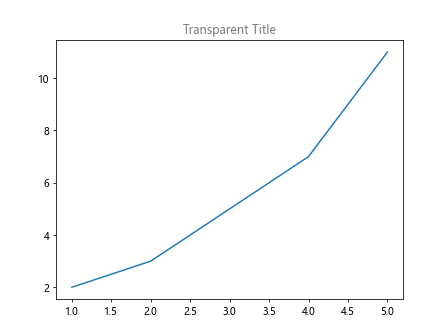
10. 透明度设置
有时候我们需要为标题添加透明度,可以通过alpha参数来设置标题的透明度。
import matplotlib.pyplot as plt

x = [1, 2, 3, 4, 5]
y = [2, 3, 5, 7, 11]

plt.plot(x, y)
plt.title('Transparent Title', alpha=0.5)
plt.show()
Output:
结论
在本文中,我们介绍了如何在Matplotlib中为图表添加标题,包括简单的文本标题、自定义样式、特殊字符、多行标题、子图标题等功能。通过合理使用标题,可以提高图表的可读性和可视化效果,帮助观众更好地理解数据和信息。
 极客笔记
极客笔记