Matplotlib 使用 3D scatter 绘制图表
在数据可视化领域,Matplotlib 是一个经典的 Python 库,其中的 3D scatter 功能可以帮助我们展示三维数据的关系。在本文中,我们将详细介绍如何在 Matplotlib 中使用 3D scatter 绘制图表,并提供多个示例代码来帮助您更好地理解和运用这一功能。
1. 导入必要的库
在开始之前,我们首先需要导入 Matplotlib 和相关扩展库。
import numpy as np
import matplotlib.pyplot as plt
from mpl_toolkits.mplot3d import Axes3D
2. 创建 3D scatter 图表
示例 1:基本的 3D scatter 图表
以下是一个最基本的 3D scatter 图表示例,展示了一个简单的三维数据点集合。
import numpy as np
import matplotlib.pyplot as plt
from mpl_toolkits.mplot3d import Axes3D

# 生成随机数据
n = 100
x = np.random.rand(n)
y = np.random.rand(n)
z = np.random.rand(n)

# 绘制 3D scatter 图表
fig = plt.figure()
ax = fig.add_subplot(111, projection='3d')
ax.scatter(x, y, z)

plt.show()
Output:
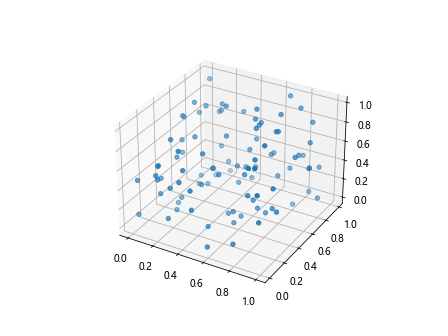
运行以上代码,您将看到一个基本的 3D scatter 图表,其中展示了随机的三维数据点。
示例 2:自定义 Marker 样式和颜色
您可以通过设置 marker 参数来自定义数据点的样式,通过设置 c 参数来自定义数据点的颜色。
import numpy as np
import matplotlib.pyplot as plt
from mpl_toolkits.mplot3d import Axes3D

# 生成随机数据
n = 100
x = np.random.rand(n)
y = np.random.rand(n)
z = np.random.rand(n)

# 自定义 Marker 样式和颜色
fig = plt.figure()
ax = fig.add_subplot(111, projection='3d')
ax.scatter(x, y, z, marker='^', c='r')

plt.show()
Output:
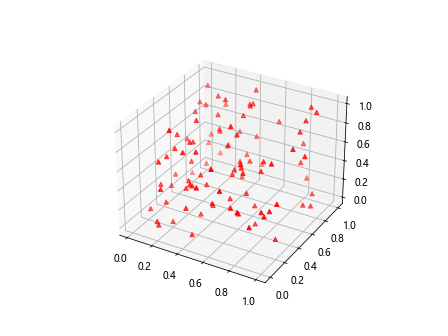
在这个示例中,我们将数据点的样式设置为三角形(^),颜色设置为红色(r)。
3. 自定义坐标轴
示例 3:改变坐标轴范围
您可以通过设置 set_xlim、set_ylim 和 set_zlim 方法来改变坐标轴的范围。
import numpy as np
import matplotlib.pyplot as plt
from mpl_toolkits.mplot3d import Axes3D

# 生成随机数据
n = 100
x = np.random.rand(n)
y = np.random.rand(n)
z = np.random.rand(n)

fig = plt.figure()
ax = fig.add_subplot(111, projection='3d')
ax.scatter(x, y, z)

# 改变坐标轴范围
ax.set_xlim(0, 1)
ax.set_ylim(0, 1)
ax.set_zlim(0, 1)

plt.show()
Output:
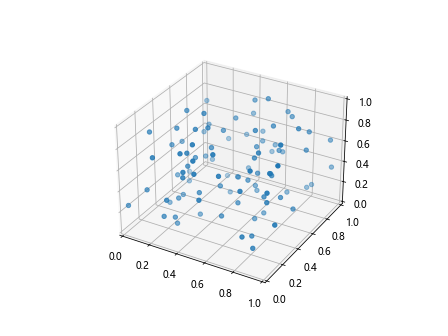
在这个示例中,我们将 x、y 和 z 坐标轴的范围都设置为 0 到 1。
示例 4:设置坐标轴标签
您可以通过设置 set_xlabel、set_ylabel 和 set_zlabel 方法来添加坐标轴标签。
import numpy as np
import matplotlib.pyplot as plt
from mpl_toolkits.mplot3d import Axes3D

# 生成随机数据
n = 100
x = np.random.rand(n)
y = np.random.rand(n)
z = np.random.rand(n)

fig = plt.figure()
ax = fig.add_subplot(111, projection='3d')
ax.scatter(x, y, z)

# 设置坐标轴标签
ax.set_xlabel('X Label')
ax.set_ylabel('Y Label')
ax.set_zlabel('Z Label')

plt.show()
Output:
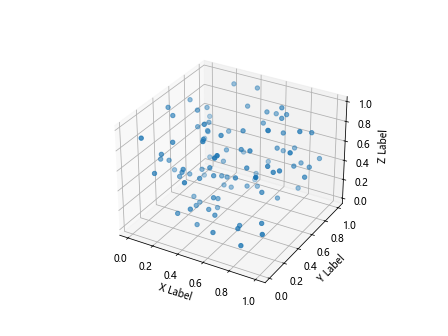
在这个示例中,我们添加了 x、y 和 z 坐标轴的标签。
4. 添加图例和标题
示例 5:添加标题
您可以通过 set_title 方法来添加图表的标题。
import numpy as np
import matplotlib.pyplot as plt
from mpl_toolkits.mplot3d import Axes3D

# 生成随机数据
n = 100
x = np.random.rand(n)
y = np.random.rand(n)
z = np.random.rand(n)

fig = plt.figure()
ax = fig.add_subplot(111, projection='3d')
ax.scatter(x, y, z)

# 添加标题
ax.set_title('3D Scatter Plot')

plt.show()
Output:
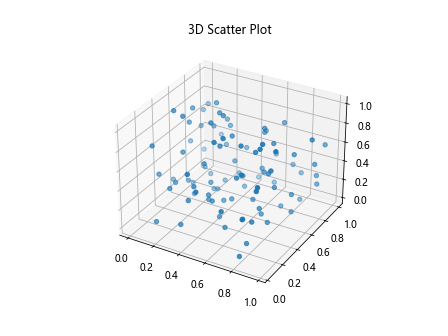
在这个示例中,我们为 3D scatter 图表添加了标题。
示例 6:添加图例
要添加图例,您可以使用 legend 方法,并将标签添加到 scatter 方法中。
import numpy as np
import matplotlib.pyplot as plt
from mpl_toolkits.mplot3d import Axes3D

# 生成随机数据
n = 100
x = np.random.rand(n)
y = np.random.rand(n)
z = np.random.rand(n)

fig = plt.figure()
ax = fig.add_subplot(111, projection='3d')
ax.scatter(x, y, z, label='Data points')

# 添加图例
ax.legend()

plt.show()
Output:
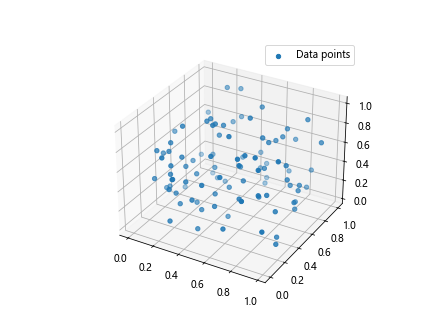
在这个示例中,我们为 3D scatter 图表添加了一个名为 Data points 的图例。
5. 其他常用设置
示例 7:设置数据点大小
您可以通过设置 s 参数来调整数据点的大小。
import numpy as np
import matplotlib.pyplot as plt
from mpl_toolkits.mplot3d import Axes3D

# 生成随机数据
n = 100
x = np.random.rand(n)
y = np.random.rand(n)
z = np.random.rand(n)

fig = plt.figure()
ax = fig.add_subplot(111, projection='3d')
ax.scatter(x, y, z, s=50)

plt.show()
Output:
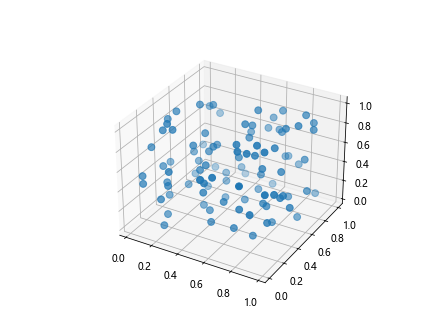
在这个示例中,我们将数据点的大小设置为 50。
示例 8:更改视角
您可以通过设置 view_init 方法来更改 3D 图表的视角。
import numpy as np
import matplotlib.pyplot as plt
from mpl_toolkits.mplot3d import Axes3D

# 生成随机数据
n = 100
x = np.random.rand(n)
y = np.random.rand(n)
z = np.random.rand(n)

fig = plt.figure()
ax = fig.add_subplot(111, projection='3d')
ax.scatter(x, y, z)

# 更改视角
ax.view_init(elev=30, azim=45)

plt.show()
Output:
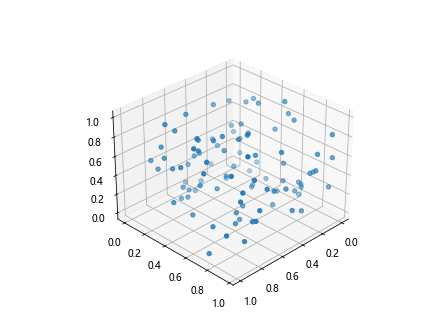
在这个示例中,我们将视角设定为仰角为 30 度,方位角为 45 度。
示例 9:隐藏坐标轴
如果您希望隐藏坐标轴,可以使用 axis 方法。
import numpy as np
import matplotlib.pyplot as plt
from mpl_toolkits.mplot3d import Axes3D

# 生成随机数据
n = 100
x = np.random.rand(n)
y = np.random.rand(n)
z = np.random.rand(n)

fig = plt.figure()
ax = fig.add_subplot(111, projection='3d')
ax.scatter(x, y, z)

# 隐藏坐标轴
ax.axis('off')

plt.show()
Output:

在这个示例中,我们隐藏了坐标轴。
示例 10:添加网格线
要添加网格线,可以使用 grid 方法。
import numpy as np
import matplotlib.pyplot as plt
from mpl_toolkits.mplot3d import Axes3D

# 生成随机数据
n = 100
x = np.random.rand(n)
y = np.random.rand(n)
z = np.random.rand(n)

fig = plt.figure()
ax = fig.add_subplot(111, projection='3d')
ax.scatter(x, y, z)

# 添加网格线
ax.grid(True)

plt.show()
Output:
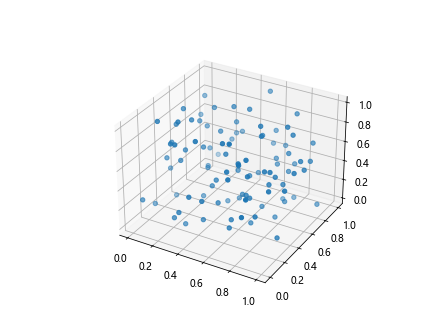
在这个示例中,我们为图表添加了网格线。
6. 多个数据集对比
示例 11:绘制多个数据集
您可以绘制多个数据集并进行对比展示。
import numpy as np
import matplotlib.pyplot as plt
from mpl_toolkits.mplot3d import Axes3D

# 生成随机数据
n = 100
x = np.random.rand(n)
y = np.random.rand(n)
z = np.random.rand(n)

# 生成第二组随机数据
x2 = np.random.rand(n)
y2 = np.random.rand(n)
z2 = np.random.rand(n)

fig = plt.figure()
ax = fig.add_subplot(111, projection='3d')
ax.scatter(x, y, z, label='Data points 1')
ax.scatter(x2, y2, z2, label='Data points 2')

ax.legend()

plt.show()
Output:
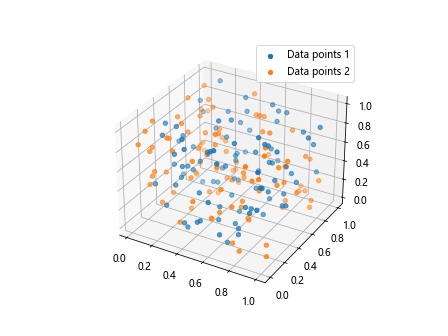
在这个示例中,我们绘制了两组随机数据,并在图表中添加了图例进行对比。
示例 12:自定义标记大小和颜色
您可以为不同的数据点集合设置不同的标记大小和颜色。
import numpy as np
import matplotlib.pyplot as plt
from mpl_toolkits.mplot3d import Axes3D

# 生成随机数据
n = 100
x = np.random.rand(n)
y = np.random.rand(n)
z = np.random.rand(n)

# 生成第二组随机数据
x2 = np.random.rand(n)
y2 = np.random.rand(n)
z2 = np.random.rand(n)

fig = plt.figure()
ax = fig.add_subplot(111, projection='3d')
ax.scatter(x, y, z, s=50, c='r', label='Data points 1')
ax.scatter(x2, y2, z2, s=100, c='g', label='Data points 2')

ax.legend()

plt.show()
Output:
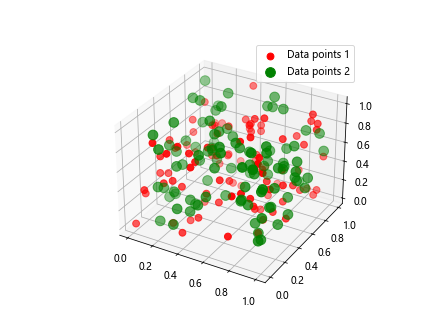
在这个示例中,我们为两组数据点集合分别设置了不同的标记大小和颜色。
7. 结合线图
示例 13:绘制 3D scatter 和线图
您可以在同一张图表上绘制 3D scatter 和线图,以展示更加复杂的数据关系。
import numpy as np
import matplotlib.pyplot as plt
from mpl_toolkits.mplot3d import Axes3D

# 生成一条曲线数据
t = np.linspace(0, 2*np.pi, 100)
x_curve = np.sin(t)
y_curve = np.cos(t)
z_curve = t

fig = plt.figure()
ax = fig.add_subplot(111, projection='3d')

# 绘制 3D scatter
ax.scatter(x, y, z, label='Data points')

# 绘制曲线
ax.plot(x_curve, y_curve, z_curve, color='r', label='Curve')

ax.legend()

plt.show()
在这个示例中,我们同时绘制了一个 3D scatter 图表和一个曲线图,展示了不同类型的数据在同一张图表上的展示。
示例 14:绘制连线
您可以在 3D scatter 图表中绘制数据点之间的连线。
import numpy as np
import matplotlib.pyplot as plt
from mpl_toolkits.mplot3d import Axes3D

# 生成随机数据
n = 100
x = np.random.rand(n)
y = np.random.rand(n)
z = np.random.rand(n)

fig = plt.figure()
ax = fig.add_subplot(111, projection='3d')
ax.scatter(x, y, z)

# 绘制连线
for i in range(n):
    ax.plot([x[i], 0], [y[i], 0], [z[i], 0], color='r')

plt.show()
Output:
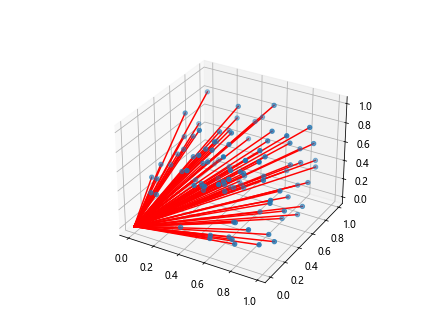
在这个示例中,我们绘制了数据点与原点之间的连线。
8. 使用真实数据集
示例 15:使用真实数据集绘制 3D scatter
除了生成随机数据,您也可以使用真实数据集来绘制 3D scatter 图表。
import numpy as np
import matplotlib.pyplot as plt
from mpl_toolkits.mplot3d import Axes3D
# 使用 Iris 数据集
from sklearn.datasets import load_iris

iris = load_iris()
X = iris.data
y = iris.target

fig = plt.figure()
ax = fig.add_subplot(111, projection='3d')
ax.scatter(X[:, 0], X[:, 1], X[:, 2], c=y)

plt.show()
在这个示例中,我们使用 Iris 数据集中的前三个特征来绘制 3D scatter 图表,并根据不同类别给数据点上色。
 极客笔记
极客笔记