Matplotlib折线图
在数据可视化中,折线图(line plot)是一种常用的图表类型,用于展示数据随时间或其他变量的变化趋势。Python中的Matplotlib库是一个强大的绘图工具,可以用来创建各种类型的图表,包括折线图。本文将详细介绍如何使用Matplotlib创建折线图,并提供多个示例代码来演示不同情况下的折线图绘制。
1. 绘制基本折线图
首先,让我们从绘制一个简单的基本折线图开始。我们准备了一个包含10个随机数的数据集,用于展示折线的变化趋势。
import matplotlib.pyplot as plt
import numpy as np

x = np.arange(10)
y = np.random.randint(1, 10, 10)

plt.plot(x, y)
plt.title('Basic Line Plot')
plt.xlabel('X-axis')
plt.ylabel('Y-axis')
plt.show()
Output:
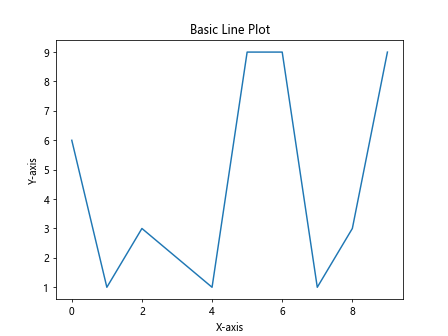
这是一个简单的折线图,显示了随机数据集中y值的变化趋势。
2. 自定义折线图样式
Matplotlib提供了丰富的方法来自定义折线图的样式,包括线型、颜色、标记等。接下来,我们将演示如何自定义折线图的样式。
import matplotlib.pyplot as plt
import numpy as np

x = np.linspace(0, 10, 100)
y = np.sin(x)

plt.plot(x, y, linestyle='--', color='red', marker='o', markersize=5)
plt.title('Custom Line Plot')
plt.xlabel('X-axis')
plt.ylabel('Y-axis')
plt.show()
Output:
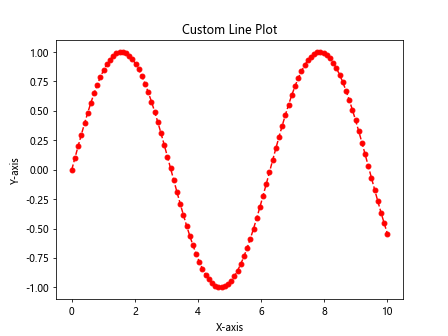
上述代码中,我们使用了不同的参数来定义折线的样式,包括虚线、红色、圆形标记等。
通过自定义折线图的样式,我们可以更直观地展现数据的特点。
3. 多条折线图
除了单条折线图外,Matplotlib还支持同时绘制多条折线图。我们可以在同一个图表中展示多组数据的变化趋势。
import matplotlib.pyplot as plt
import numpy as np

x = np.arange(10)
y1 = np.random.randint(1, 10, 10)
y2 = np.random.randint(1, 10, 10)

plt.plot(x, y1, label='Line 1')
plt.plot(x, y2, label='Line 2')
plt.title('Multiple Line Plot')
plt.xlabel('X-axis')
plt.ylabel('Y-axis')
plt.legend()
plt.show()
Output:
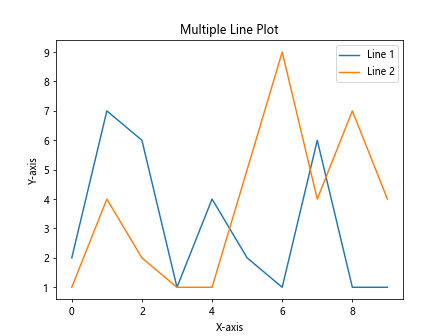
在这个图表中,我们同时展示了两组数据的变化情况,并使用图例区分不同的折线。
4. 添加注释和标签
为了更好地说明数据的变化趋势,我们可以在折线图中添加注释和标签。这有助于观众更清晰地理解图表所表达的信息。
import matplotlib.pyplot as plt
import numpy as np

x = np.linspace(0, 10, 100)
y = np.sin(x)

plt.plot(x, y)
plt.title('Line Plot with Annotation and Label')
plt.xlabel('X-axis')
plt.ylabel('Y-axis')
plt.annotate('Peak', xy=(np.pi/2, 1), xytext=(np.pi/2+1, 1.5),
             arrowprops=dict(facecolor='black'))
plt.text(3, 0, 'Sine Curve', fontsize=12, style='italic')
plt.show()
Output:
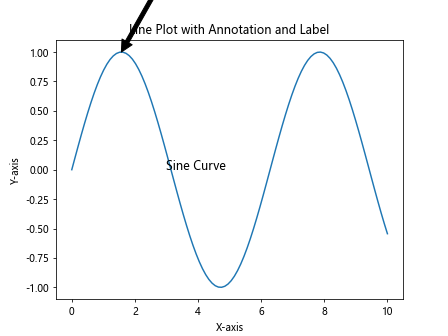
在这个图表中,我们使用了注释和标签来说明数据的特点,使得图表更加易于理解。
5. 3D折线图
除了在二维平面上绘制折线图外,Matplotlib还支持在三维空间中绘制折线图。下面我们演示如何创建一个简单的3D折线图。
import matplotlib.pyplot as plt
import numpy as np
from mpl_toolkits.mplot3d import Axes3D

fig = plt.figure()
ax = fig.add_subplot(111, projection='3d')

x = np.linspace(-5, 5, 100)
y = np.sin(x)
z = np.cos(x)

ax.plot(x, y, z)
plt.title('3D Line Plot')
ax.set_xlabel('X-axis')
ax.set_ylabel('Y-axis')
ax.set_zlabel('Z-axis')
plt.show()
Output:
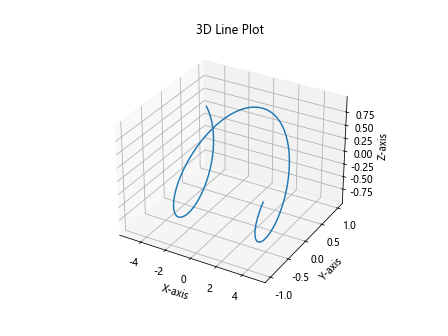
通过在三维空间中绘制折线图,我们可以更直观地展示数据在不同维度上的变化趋势。
6. 动态折线图
有时候,我们需要实时展示数据的变化情况。Matplotlib也提供了实时更新图表的功能,可以用来创建动态折线图。
import matplotlib.pyplot as plt
import numpy as np

plt.ion()

x = np.arange(10)
y = np.random.randint(1, 10, 10)

for i in range(10):
    y[i] = np.random.randint(1, 10)
    plt.plot(x[:i+1], y[:i+1], color='blue')
    plt.title('Dynamic Line Plot')
    plt.xlabel('X-axis')
    plt.ylabel('Y-axis')
    plt.draw()
    plt.pause(1)

plt.ioff()
plt.show()
Output:
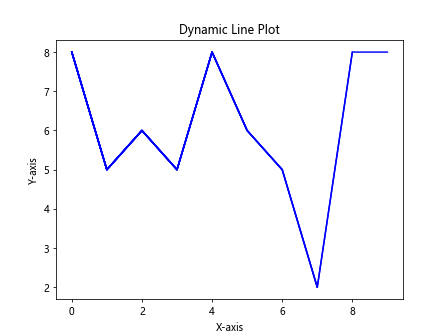
运行上述代码,可以看到一个动态折线图,每秒更新一次数据
动态折线图可以帮助我们实时监测数据的变化情况,对于一些需要即时反馈的场景非常有用。
7. 折线图与散点图结合
除了纯折线图外,有时候也需要在同一个图表中展示折线图和散点图。下面演示如何将折线图和散点图结合在一起。
import matplotlib.pyplot as plt
import numpy as np

x = np.linspace(0, 10, 100)
y = np.sin(x)

plt.plot(x, y, label='Line Plot', color='blue')
plt.scatter(x[::10], y[::10], label='Scatter Plot', color='red', marker='o')
plt.title('Line and Scatter Plot')
plt.xlabel('X-axis')
plt.ylabel('Y-axis')
plt.legend()
plt.show()
Output:
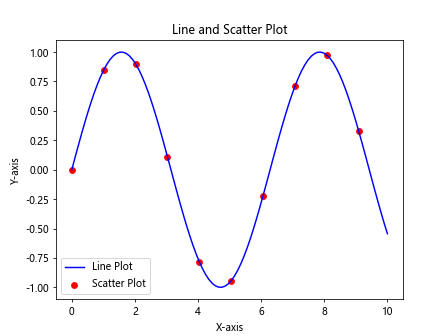
在这个图表中,我们同时展示了折线图和散点图,帮助观众更全面地理解数据的变化趋势。
8. 指定折线图范围
有时候,我们需要将折线图的显示范围限制在特定的区间内,以便更清晰地观察数据细节。Matplotlib提供了设置坐标轴范围的方法,可以帮助我们实现这一需求。
import matplotlib.pyplot as plt
import numpy as np

x = np.linspace(0, 10, 100)
y = np.sin(x)

plt.plot(x, y)
plt.title('Line Plot with Specified Range')
plt.xlabel('X-axis')
plt.ylabel('Y-axis')
plt.xlim(2, 8)
plt.ylim(-1, 1)
plt.show()
Output:
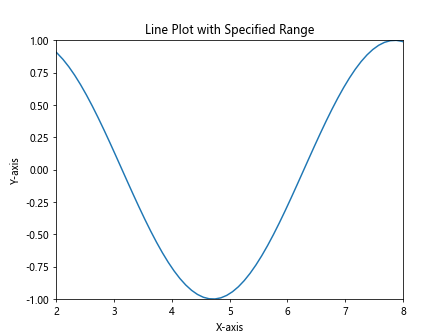
通过指定折线图的范围,我们可以更准确地观察数据在指定区间内的变化情况。
9. 不同风格的折线图
除了基本的线性折线图外,Matplotlib还支持绘制其他类型的折线图,比如阶梯线图、面积图等。下面我们演示不同风格的折线图。
阶梯线图
import matplotlib.pyplot as plt
import numpy as np

x = np.linspace(0, 10, 100)
y = np.sin(x)

plt.step(x, y, label='Step Line', linestyle='-.', color='green')
plt.title('Step Line Plot')
plt.xlabel('X-axis')
plt.ylabel('Y-axis')
plt.legend()
plt.show()
Output:
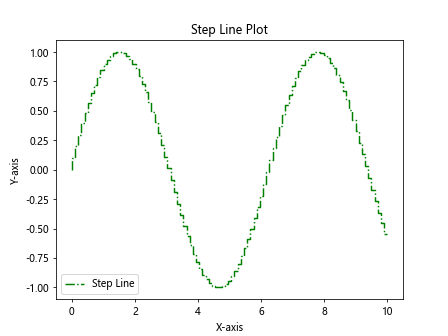
通过设置linestyle='-',我们实现了阶梯线图的效果。
面积图
import matplotlib.pyplot as plt
import numpy as np

x = np.linspace(0, 10, 100)
y = np.sin(x)

plt.fill_between(x, y, color='skyblue', alpha=0.5)
plt.plot(x, y, label='Area Plot', color='blue')
plt.title('Area Plot')
plt.xlabel('X-axis')
plt.ylabel('Y-axis')
plt.legend()
plt.show()
Output:
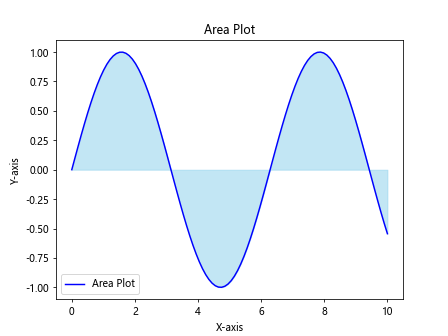
通过使用fill_between方法,我们实现了面积图的效果,直观地展示了数据的分布情况。
10. 多子图折线图
有时候,我们需要在同一个图表中展示多个子图,比较不同数据集之间的关系。Matplotlib支持创建多个子图,下面演示如何绘制多个子图的折线图。
import matplotlib.pyplot as plt
import numpy as np

x = np.linspace(0, 10, 100)
y1 = np.sin(x)
y2 = np.cos(x)

plt.subplot(2, 1, 1)
plt.plot(x, y1, label='Sin Line', color='blue')
plt.title('Subplot 1')
plt.xlabel('X-axis')
plt.ylabel('Y-axis')
plt.legend()

plt.subplot(2, 1, 2)
plt.plot(x, y2, label='Cos Line', color='red')
plt.title('Subplot 2')
plt.xlabel('X-axis')
plt.ylabel('Y-axis')
plt.legend()

plt.tight_layout()
plt.show()
Output:
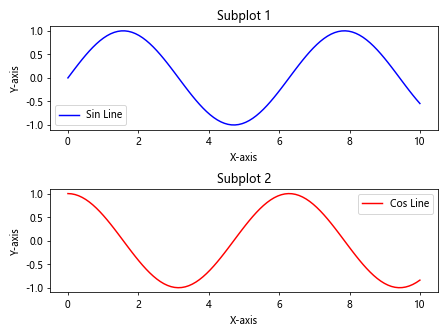
通过创建多个子图,我们可以方便地比较不同数据之间的关系,更清晰地了解数据的特点。
 极客笔记
极客笔记