Matplotlib 图例位置设置
在使用 Matplotlib 绘制图表的过程中,图例(legend)是一个非常重要的组件,它能够帮助我们更好地理解图表中的各个数据系列。在 Matplotlib 中,我们可以通过设置不同的位置参数来控制图例的位置。本文将详细介绍如何设置 Matplotlib 图例的位置,并提供大量示例代码供读者参考。
默认位置设置
首先,让我们先来看一下 Matplotlib 中图例的默认位置。在 Matplotlib 中,图例的位置默认是放在右上角,当图表中只有一个图例时,它会自动放在右上角。让我们来看一个简单的示例代码:
import matplotlib.pyplot as plt

x = [1, 2, 3, 4, 5]
y = [2, 3, 5, 7, 11]

plt.plot(x, y, label='Prime Numbers')
plt.legend()

plt.show()
Output:
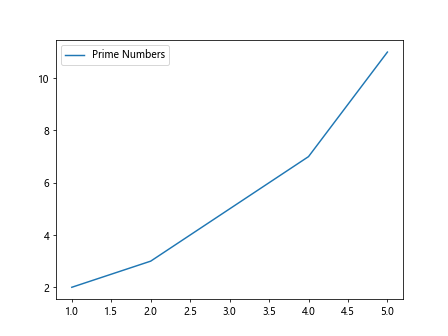
运行上面的代码,可以看到图例自动显示在了右上角。
手动调整位置
如果我们想手动调整图例的位置,可以使用 loc 参数来指定位置。loc 参数有很多可选值,比如 ‘upper right’、’upper left’、’lower right’、’lower left’、’center’ 等等。让我们来看一个示例代码:
import matplotlib.pyplot as plt

x = [1, 2, 3, 4, 5]
y = [2, 3, 5, 7, 11]

plt.plot(x, y, label='Prime Numbers')
plt.legend(loc='lower right')

plt.show()
Output:
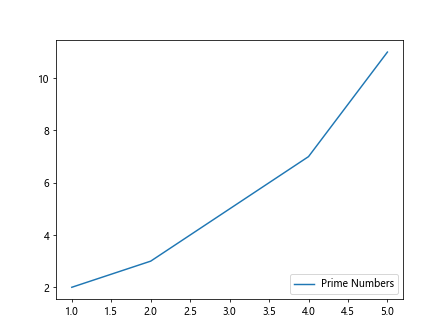
运行上面的代码,可以看到图例被调整到了右下角。下面我们来看一些其他可选值的示例。
可选值示例
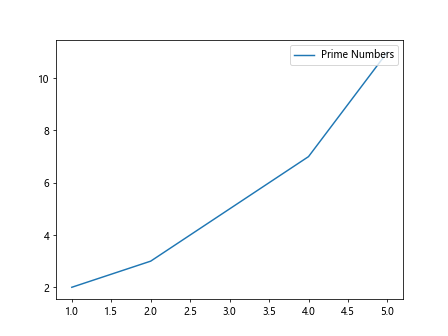
‘upper right’
import matplotlib.pyplot as plt

x = [1, 2, 3, 4, 5]
y = [2, 3, 5, 7, 11]

plt.plot(x, y, label='Prime Numbers')
plt.legend(loc='upper right')

plt.show()
Output:
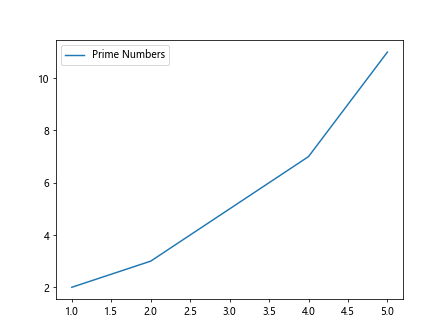
‘upper left’
import matplotlib.pyplot as plt

x = [1, 2, 3, 4, 5]
y = [2, 3, 5, 7, 11]

plt.plot(x, y, label='Prime Numbers')
plt.legend(loc='upper left')

plt.show()
Output:
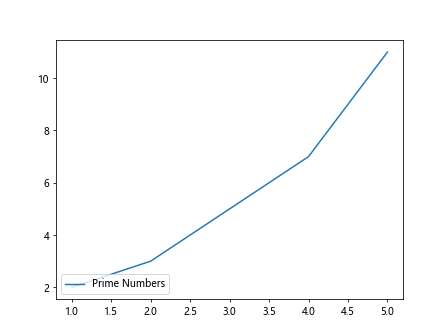
‘lower left’
import matplotlib.pyplot as plt

x = [1, 2, 3, 4, 5]
y = [2, 3, 5, 7, 11]

plt.plot(x, y, label='Prime Numbers')
plt.legend(loc='lower left')

plt.show()
Output:
‘center’
import matplotlib.pyplot as plt

x = [1, 2, 3, 4, 5]
y = [2, 3, 5, 7, 11]

plt.plot(x, y, label='Prime Numbers')
plt.legend(loc='center')

plt.show()
Output:
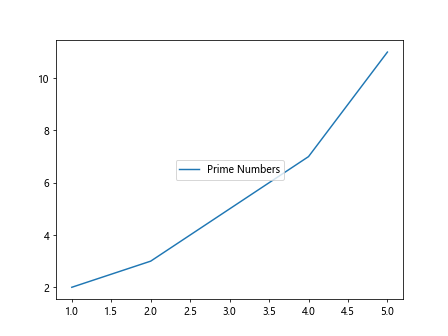
除了上面提到的几种位置之外,loc 参数还支持数字参数,以及 ‘best’、’center left’、’center right’ 等位置。读者可以根据需要选择合适的位置设置图例。
固定位置
有时候,我们希望图例的位置能够固定在某个具体的位置,不受数据点的位置影响。这时可以使用 bbox_to_anchor 参数来固定位置。例如,我们可以将图例固定在图表的右上角,不受数据点的干扰。示例代码如下:
import matplotlib.pyplot as plt

x = [1, 2, 3, 4, 5]
y = [2, 3, 5, 7, 11]

plt.plot(x, y, label='Prime Numbers')
plt.legend(bbox_to_anchor=(1, 1))

plt.show()
Output:
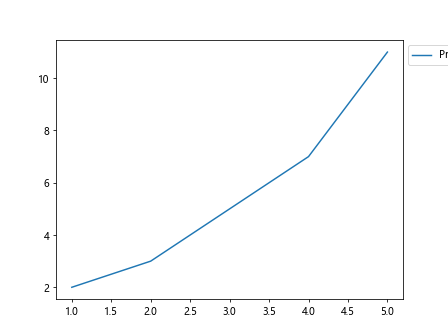
通过设置 (1, 1),我们将图例固定在了图表的右上角。
扩展边距
有时候,图例可能会覆盖到数据点或者坐标轴,这时可以通过设置 borderaxespad 参数来扩展边距,让图例不会覆盖其他元素。示例代码如下:
import matplotlib.pyplot as plt

x = [1, 2, 3, 4, 5]
y = [2, 3, 5, 7, 11]

plt.plot(x, y, label='Prime Numbers')
plt.legend(borderaxespad=2)

plt.show()
Output:
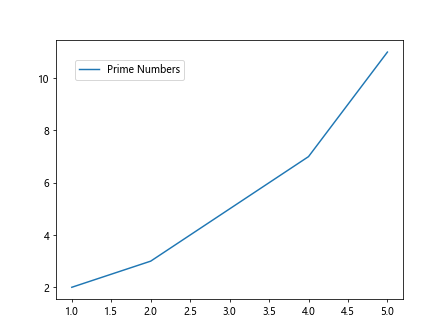
通过设置 borderaxespad=2,我们增加了图例与坐标轴之间的间距。
调整图例大小
有时候,我们希望调整图例的大小,让文字更清晰可见。这时可以通过设置 fontsize 参数来调整图例文字的大小。示例代码如下:
import matplotlib.pyplot as plt

x = [1, 2, 3, 4, 5]
y = [2, 3, 5, 7, 11]

plt.plot(x, y, label='Prime Numbers')
plt.legend(fontsize=12)

plt.show()
Output:
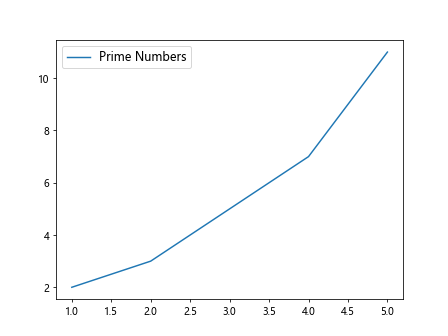
通过设置 fontsize=12,我们调整了图例文字的大小为12。
改变图例标题位置
有时候,我们需要在图例中加入一个标题,让读者更容易理解图例所代表的含义。在 Matplotlib 中,我们可以通过 title 参数来添加标题,并通过 title_loc 参数来设置标题的位置。示例代码如下:
import matplotlib.pyplot as plt

x = [1, 2, 3, 4, 5]
y = [2, 3, 5, 7, 11]

plt.plot(x, y, label='Prime Numbers')
plt.legend(title='Legend Title', title_loc='center')

plt.show()
通过设置 title_loc='center',我们将图例标题放在了图例的中心位置。
 极客笔记
极客笔记