如何在叠加箱线图和散点图时去除重复的图例
参考:How to Remove the Duplicate Legend When Overlaying Boxplot and Stripplot
在数据可视化中,叠加箱线图(Boxplot)和散点图(Stripplot)是一种常见的做法,可以同时展示数据的分布和离散点。然而,在使用Matplotlib绘制这种组合图时,经常会遇到图例重复的问题。本文将详细介绍如何解决这个问题,并提供多个实用的示例代码,帮助你轻松掌握这一技巧。
1. 理解问题的根源
在开始解决问题之前,我们需要理解为什么会出现重复的图例。当我们使用Matplotlib绘制叠加的箱线图和散点图时,每个图层都会默认生成自己的图例。这导致了最终图表中出现重复的图例项。
以下是一个简单的示例,展示了这个问题:
import matplotlib.pyplot as plt
import seaborn as sns
import numpy as np

# 生成示例数据
np.random.seed(0)
data = np.random.randn(100, 3)
df = pd.DataFrame(data, columns=['A', 'B', 'C'])

# 创建图表
plt.figure(figsize=(10, 6))
sns.boxplot(data=df)
sns.stripplot(data=df)

plt.title("How2matplotlib.com: Boxplot and Stripplot with Duplicate Legend")
plt.show()
在这个例子中,我们可以看到图例中出现了重复的项,这不仅影响了图表的美观性,也可能给读者造成困惑。
2. 使用共享图例
解决重复图例问题的一种方法是使用共享图例。我们可以在绘制第一个图层时创建图例,然后在绘制第二个图层时不再添加图例。
import matplotlib.pyplot as plt
import seaborn as sns
import numpy as np
import pandas as pd

# 生成示例数据
np.random.seed(0)
data = np.random.randn(100, 3)
df = pd.DataFrame(data, columns=['A', 'B', 'C'])

# 创建图表
plt.figure(figsize=(10, 6))
sns.boxplot(data=df, legend=False)
sns.stripplot(data=df)

plt.title("How2matplotlib.com: Shared Legend for Boxplot and Stripplot")
plt.show()
Output:
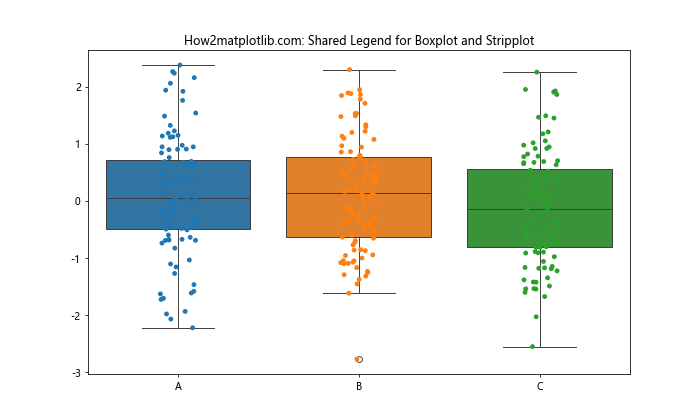
在这个例子中,我们在绘制箱线图时设置legend=False,这样就只会显示散点图的图例,避免了重复。
3. 手动创建图例
另一种更灵活的方法是手动创建图例。这种方法允许我们完全控制图例的内容和样式。
import matplotlib.pyplot as plt
import seaborn as sns
import numpy as np
import pandas as pd

# 生成示例数据
np.random.seed(0)
data = np.random.randn(100, 3)
df = pd.DataFrame(data, columns=['A', 'B', 'C'])

# 创建图表
fig, ax = plt.subplots(figsize=(10, 6))
sns.boxplot(data=df, ax=ax, legend=False)
sns.stripplot(data=df, ax=ax, legend=False)

# 手动创建图例
handles, labels = ax.get_legend_handles_labels()
ax.legend(handles[:3], labels[:3], title="How2matplotlib.com")

plt.title("How2matplotlib.com: Manual Legend for Boxplot and Stripplot")
plt.show()
Output:
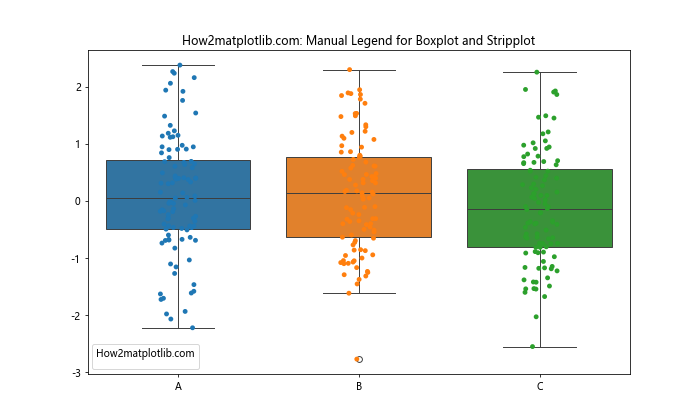
这个例子展示了如何获取图表的句柄和标签,然后手动创建一个包含所需信息的图例。
4. 使用自定义图例
有时,我们可能希望为箱线图和散点图创建不同的图例项。在这种情况下,我们可以使用自定义图例。
import matplotlib.pyplot as plt
import seaborn as sns
import numpy as np
import pandas as pd

# 生成示例数据
np.random.seed(0)
data = np.random.randn(100, 3)
df = pd.DataFrame(data, columns=['A', 'B', 'C'])

# 创建图表
fig, ax = plt.subplots(figsize=(10, 6))
sns.boxplot(data=df, ax=ax, legend=False)
sns.stripplot(data=df, ax=ax, legend=False)

# 创建自定义图例
box_patch = plt.Rectangle((0, 0), 1, 1, fill=False, edgecolor='blue')
strip_line = plt.Line2D([0], [0], marker='o', color='w', markerfacecolor='orange', markersize=10)
ax.legend([box_patch, strip_line], ['Boxplot', 'Stripplot'], title="How2matplotlib.com")

plt.title("How2matplotlib.com: Custom Legend for Boxplot and Stripplot")
plt.show()
Output:
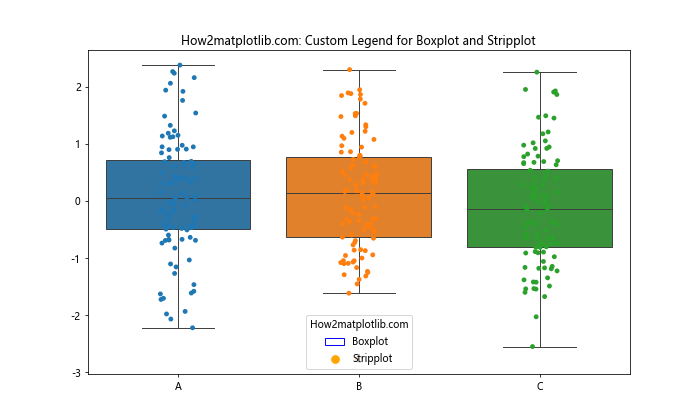
这个例子展示了如何为箱线图和散点图创建自定义的图例项,使图例更加清晰和有意义。
5. 使用图例的loc参数
图例的位置也可能影响图表的整体效果。Matplotlib提供了多种预定义的位置,我们可以通过loc参数来指定。
import matplotlib.pyplot as plt
import seaborn as sns
import numpy as np
import pandas as pd

# 生成示例数据
np.random.seed(0)
data = np.random.randn(100, 3)
df = pd.DataFrame(data, columns=['A', 'B', 'C'])

# 创建图表
fig, ax = plt.subplots(figsize=(10, 6))
sns.boxplot(data=df, ax=ax, legend=False)
sns.stripplot(data=df, ax=ax, legend=False)

# 获取句柄和标签
handles, labels = ax.get_legend_handles_labels()

# 创建图例并指定位置
ax.legend(handles[:3], labels[:3], title="How2matplotlib.com", loc='upper right')

plt.title("How2matplotlib.com: Legend Placement for Boxplot and Stripplot")
plt.show()
Output:
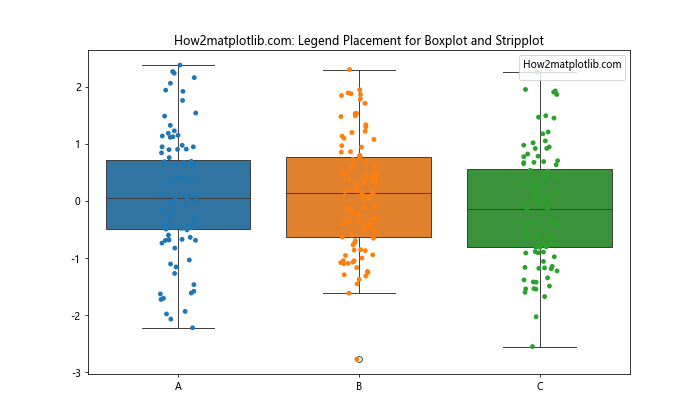
这个例子展示了如何将图例放置在图表的右上角。你可以尝试不同的loc值,如’upper left’、’lower right’等,找到最适合你的图表的位置。
6. 使用bbox_to_anchor参数精确定位图例
对于需要更精确控制图例位置的情况,我们可以使用bbox_to_anchor参数。
import matplotlib.pyplot as plt
import seaborn as sns
import numpy as np
import pandas as pd

# 生成示例数据
np.random.seed(0)
data = np.random.randn(100, 3)
df = pd.DataFrame(data, columns=['A', 'B', 'C'])

# 创建图表
fig, ax = plt.subplots(figsize=(10, 6))
sns.boxplot(data=df, ax=ax, legend=False)
sns.stripplot(data=df, ax=ax, legend=False)

# 获取句柄和标签
handles, labels = ax.get_legend_handles_labels()

# 创建图例并精确定位
ax.legend(handles[:3], labels[:3], title="How2matplotlib.com",
          bbox_to_anchor=(1.05, 1), loc='upper left')

plt.title("How2matplotlib.com: Precise Legend Placement")
plt.tight_layout()
plt.show()
Output:
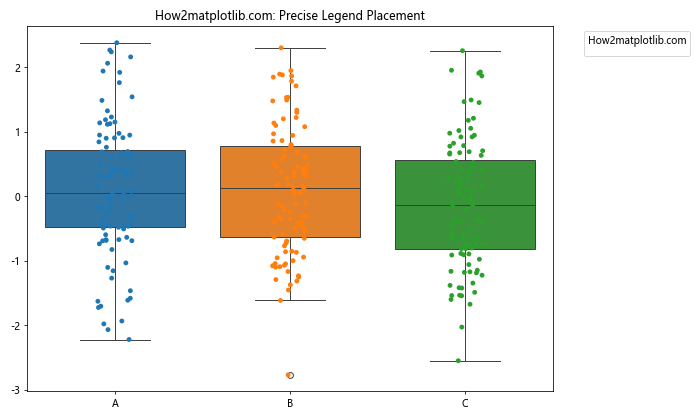
这个例子展示了如何将图例放置在图表的右侧。bbox_to_anchor参数允许你使用相对坐标来精确定位图例。
7. 调整图例的样式
除了位置,我们还可以调整图例的样式,使其更好地融入整体设计。
import matplotlib.pyplot as plt
import seaborn as sns
import numpy as np
import pandas as pd

# 生成示例数据
np.random.seed(0)
data = np.random.randn(100, 3)
df = pd.DataFrame(data, columns=['A', 'B', 'C'])

# 创建图表
fig, ax = plt.subplots(figsize=(10, 6))
sns.boxplot(data=df, ax=ax, legend=False)
sns.stripplot(data=df, ax=ax, legend=False)

# 获取句柄和标签
handles, labels = ax.get_legend_handles_labels()

# 创建样式化的图例
legend = ax.legend(handles[:3], labels[:3], title="How2matplotlib.com",
                   fancybox=True, shadow=True, ncol=3)

plt.title("How2matplotlib.com: Styled Legend for Boxplot and Stripplot")
plt.show()
Output:
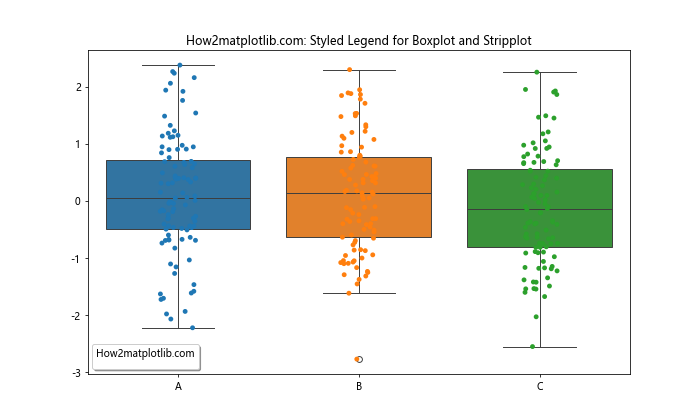
这个例子展示了如何创建一个带有阴影和圆角的图例,并将其排列成三列。
8. 使用zorder参数控制图层顺序
有时,图例可能会与数据点重叠。我们可以使用zorder参数来控制图层的顺序。
import matplotlib.pyplot as plt
import seaborn as sns
import numpy as np
import pandas as pd

# 生成示例数据
np.random.seed(0)
data = np.random.randn(100, 3)
df = pd.DataFrame(data, columns=['A', 'B', 'C'])

# 创建图表
fig, ax = plt.subplots(figsize=(10, 6))
sns.boxplot(data=df, ax=ax, legend=False, zorder=1)
sns.stripplot(data=df, ax=ax, legend=False, zorder=2)

# 获取句柄和标签
handles, labels = ax.get_legend_handles_labels()

# 创建图例并设置zorder
legend = ax.legend(handles[:3], labels[:3], title="How2matplotlib.com", zorder=3)

plt.title("How2matplotlib.com: Controlling Layer Order with zorder")
plt.show()
在这个例子中,我们使用zorder参数确保图例显示在所有数据点之上。
9. 为不同的数据系列使用不同的图例样式
如果你的数据集包含多个系列,你可能希望为每个系列使用不同的图例样式。
import matplotlib.pyplot as plt
import seaborn as sns
import numpy as np
import pandas as pd

# 生成示例数据
np.random.seed(0)
data = np.random.randn(100, 2)
df = pd.DataFrame(data, columns=['Group A', 'Group B'])
df['Category'] = np.random.choice(['Cat1', 'Cat2'], size=100)

# 创建图表
fig, ax = plt.subplots(figsize=(12, 6))
sns.boxplot(x='Category', y='Group A', data=df, ax=ax, color='lightblue', legend=False)
sns.stripplot(x='Category', y='Group A', data=df, ax=ax, color='blue', legend=False)
sns.boxplot(x='Category', y='Group B', data=df, ax=ax, color='lightgreen', legend=False)
sns.stripplot(x='Category', y='Group B', data=df, ax=ax, color='green', legend=False)

# 创建自定义图例
box_patch_a = plt.Rectangle((0, 0), 1, 1, fill=True, edgecolor='blue', facecolor='lightblue')
strip_line_a = plt.Line2D([0], [0], marker='o', color='w', markerfacecolor='blue', markersize=10)
box_patch_b = plt.Rectangle((0, 0), 1, 1, fill=True, edgecolor='green', facecolor='lightgreen')
strip_line_b = plt.Line2D([0], [0], marker='o', color='w', markerfacecolor='green', markersize=10)

ax.legend([box_patch_a, strip_line_a, box_patch_b, strip_line_b],
          ['Group A Box', 'Group A Points', 'Group B Box', 'Group B Points'],
          title="How2matplotlib.com")

plt.title("How2matplotlib.com: Different Legend Styles for Multiple Series")
plt.show()
Output:
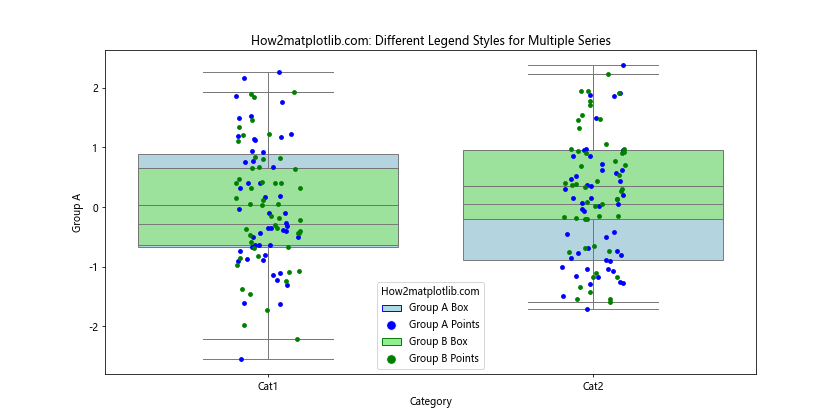
这个例子展示了如何为两个不同的数据系列创建不同样式的图例项。
10. 使用图例来突出显示特定数据点
有时,你可能想要使用图例来突出显示某些特定的数据点。
import matplotlib.pyplot as plt
import seaborn as sns
import numpy as np
import pandas as pd

# 生成示例数据
np.random.seed(0)
data = np.random.randn(100, 1)
df = pd.DataFrame(data, columns=['Value'])
df['Category'] = np.random.choice(['A', 'B', 'C'], size=100)

# 创建图表
fig, ax = plt.subplots(figsize=(10, 6))
sns.boxplot(x='Category', y='Value', data=df, ax=ax, legend=False)
sns.stripplot(x='Category', y='Value', data=df, ax=ax, legend=False)

# 突出显示特定点
highlight_points = df[df['Value'] > 2]
ax.scatter(highlight_points['Category'].map({'A': 0, 'B': 1, 'C': 2}),
           highlight_points['Value'],
           color='red', s=100, zorder=3, label='Outliers')

# 添加图例
ax.legend(title="How2matplotlib.com")

plt.title("How2matplotlib.com: Highlighting Specific Points in Legend")
plt.show()
Output:

这个例子展示了如何使用图例来突出显示异常值。
11. 使用多列图例
对于包含多个项目的图例,使用多列布局可以节省空间并提高可读性。
import matplotlib.pyplot as plt
import seaborn as sns
import numpy as np
import pandas as pd

# 生成示例数据
np.random.seed(0)
data = np.random.randn(100, 5)
df = pd.DataFrame(data, columns=['A', 'B', 'C', 'D', 'E'])

# 创建图表
fig, ax = plt.subplots(figsize=(12, 6))
sns.boxplot(data=df, ax=ax, legend=False)
sns.stripplot(data=df, ax=ax, legend=False)

# 获取句柄和标签
handles, labels = ax.get_legend_handles_labels()

# 创建多列图例
ax.legend(handles[:5], labels[:5], title="How2matplotlib.com", ncol=3)

plt.title("How2matplotlib.com: Multi-column Legend for Boxplot and Stripplot")
plt.show()
Output:
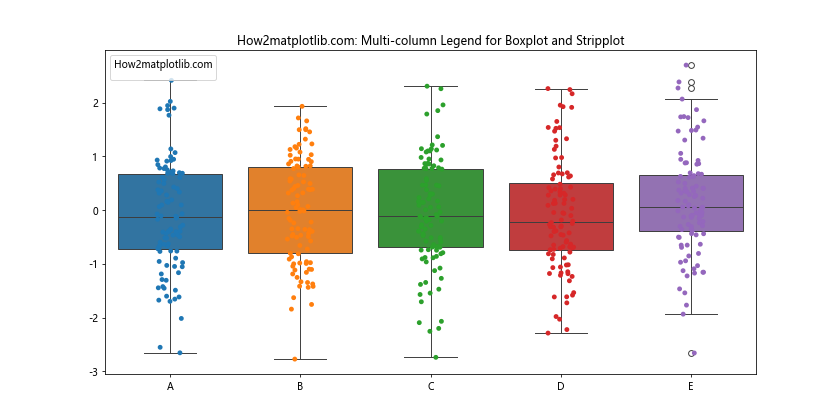
这个例子展示了如何创建一个三列的图例,适用于有多个数据系列的情况。
12. 使用图例分组
对于复杂的图表,我们可能需要将图例项分组以提高可读性。
import matplotlib.pyplot as plt
import seaborn as sns
import numpy as np
import pandas as pd

# 生成示例数据
np.random.seed(0)
data = np.random.randn(100, 4)
df = pd.DataFrame(data, columns=['A1', 'A2', 'B1', 'B2'])

# 创建图表
fig, ax = plt.subplots(figsize=(12, 6))
sns.boxplot(data=df, ax=ax, legend=False)
sns.stripplot(data=df, ax=ax, legend=False)

# 创建分组图例
box_patch = plt.Rectangle((0, 0), 1, 1, fill=False, edgecolor='blue')
strip_line = plt.Line2D([0], [0], marker='o', color='w', markerfacecolor='orange', markersize=10)

legend1 = ax.legend([box_patch, strip_line], ['Boxplot', 'Stripplot'],
                    title="Plot Types", loc='upper left', bbox_to_anchor=(1.05, 1))
ax.add_artist(legend1)

handles, labels = ax.get_legend_handles_labels()
ax.legend(handles[:4], labels[:4], title="Data Series",
          loc='upper left', bbox_to_anchor=(1.05, 0.5))

plt.title("How2matplotlib.com: Grouped Legend for Boxplot and Stripplot")
plt.tight_layout()
plt.show()
Output:
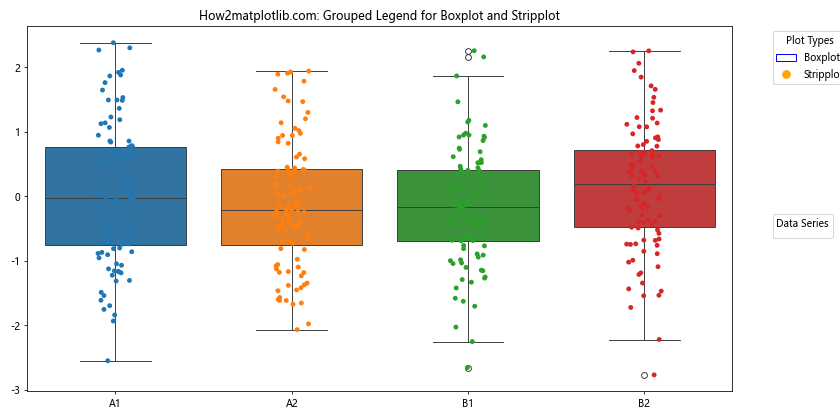
这个例子展示了如何创建两个分组的图例,一个用于图表类型,另一个用于数据系列。
13. 使用自定义标记
有时,默认的图例标记可能不够直观。我们可以使用自定义标记来改善图例的可读性。
import matplotlib.pyplot as plt
import seaborn as sns
import numpy as np
import pandas as pd

# 生成示例数据
np.random.seed(0)
data = np.random.randn(100, 3)
df = pd.DataFrame(data, columns=['A', 'B', 'C'])

# 创建图表
fig, ax = plt.subplots(figsize=(10, 6))
sns.boxplot(data=df, ax=ax, legend=False)
sns.stripplot(data=df, ax=ax, legend=False)

# 创建自定义标记
box_marker = plt.Rectangle((0, 0), 1, 1, fill=False, edgecolor='blue')
strip_marker = plt.scatter([], [], s=50, c='orange', alpha=0.5)

# 添加图例
ax.legend([box_marker, strip_marker], ['Boxplot', 'Stripplot'],
          title="How2matplotlib.com", loc='upper right')

plt.title("How2matplotlib.com: Custom Markers in Legend")
plt.show()
Output:
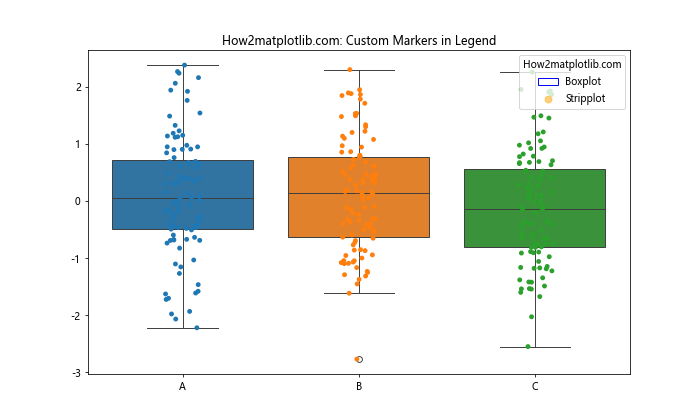
这个例子展示了如何为箱线图和散点图创建更直观的自定义标记。
14. 使用透明度
当图表元素重叠时,使用透明度可以帮助区分不同的数据系列。
import matplotlib.pyplot as plt
import seaborn as sns
import numpy as np
import pandas as pd

# 生成示例数据
np.random.seed(0)
data = np.random.randn(100, 3)
df = pd.DataFrame(data, columns=['A', 'B', 'C'])

# 创建图表
fig, ax = plt.subplots(figsize=(10, 6))
sns.boxplot(data=df, ax=ax, legend=False, alpha=0.5)
sns.stripplot(data=df, ax=ax, legend=False, alpha=0.5)

# 获取句柄和标签
handles, labels = ax.get_legend_handles_labels()

# 创建图例
legend = ax.legend(handles[:3], labels[:3], title="How2matplotlib.com")

# 设置图例中标记的透明度
for handle in legend.legendHandles:
    handle.set_alpha(0.5)

plt.title("How2matplotlib.com: Using Transparency in Legend")
plt.show()
这个例子展示了如何在图表和图例中使用透明度,使重叠的元素更容易区分。
15. 使用颜色映射
对于包含多个数据系列的图表,使用颜色映射可以创建更有吸引力和信息量的图例。
import matplotlib.pyplot as plt
import seaborn as sns
import numpy as np
import pandas as pd

# 生成示例数据
np.random.seed(0)
data = np.random.randn(100, 5)
df = pd.DataFrame(data, columns=['A', 'B', 'C', 'D', 'E'])

# 创建颜色映射
cmap = plt.get_cmap('viridis')
colors = cmap(np.linspace(0, 1, 5))

# 创建图表
fig, ax = plt.subplots(figsize=(12, 6))
for i, col in enumerate(df.columns):
    sns.boxplot(x=df[col], ax=ax, color=colors[i], width=0.5, positions=[i], legend=False)
    sns.stripplot(x=df[col], ax=ax, color=colors[i], alpha=0.5, jitter=True, size=5, positions=[i], legend=False)

# 设置x轴标签
ax.set_xticks(range(5))
ax.set_xticklabels(df.columns)

# 创建图例
legend_elements = [plt.Rectangle((0,0),1,1, facecolor=colors[i], edgecolor='none', alpha=0.5) for i in range(5)]
ax.legend(legend_elements, df.columns, title="How2matplotlib.com", loc='upper right')

plt.title("How2matplotlib.com: Color Mapped Legend for Boxplot and Stripplot")
plt.show()
这个例子展示了如何使用颜色映射来为每个数据系列分配不同的颜色,并在图例中反映这些颜色。
结论
在本文中,我们探讨了多种方法来解决在叠加箱线图和散点图时出现的重复图例问题。我们学习了如何使用共享图例、手动创建图例、自定义图例样式、控制图例位置等技巧。这些方法不仅可以解决重复图例的问题,还能帮助我们创建更加清晰、信息丰富的数据可视化。
通过掌握这些技巧,你可以创建出既美观又专业的图表,更好地传达数据中的信息。记住,图例不仅仅是标识数据系列的工具,它还可以用来突出重要信息、分组相关数据,甚至通过巧妙的设计来增强图表的整体美感。
在实际应用中,选择哪种方法取决于你的具体需求和数据的特性。不要害怕尝试不同的方法,通过实践和调整,你会发现最适合你的数据和受众的表现方式。
最后,请记住,好的数据可视化不仅仅是技术的展示,更是一种有效沟通的艺术。通过精心设计的图表和图例,你可以让复杂的数据变得易于理解,帮助你的观众更快、更准确地把握关键信息。
 极客笔记
极客笔记