Matplotlib中如何绘制虚线:全面指南与实用技巧
参考:How to plot a dashed line in matplotlib
Matplotlib是Python中最流行的数据可视化库之一,它提供了丰富的绘图功能,其中包括绘制各种类型的线条。在数据可视化中,虚线是一种常用的线型,可以用来区分不同的数据系列、表示预测或趋势线,或者simply为图表添加视觉变化。本文将详细介绍如何在Matplotlib中绘制虚线,包括基本方法、自定义样式、以及在不同类型的图表中应用虚线。
1. 基本虚线绘制
在Matplotlib中,绘制虚线的最简单方法是使用plot()函数,并指定linestyle参数为'--'。这是最常用的方法,适用于大多数基本的绘图需求。
import matplotlib.pyplot as plt
import numpy as np

x = np.linspace(0, 10, 100)
y = np.sin(x)

plt.figure(figsize=(8, 6))
plt.plot(x, y, linestyle='--', label='Sine Wave')
plt.title('How to plot a dashed line in matplotlib - how2matplotlib.com')
plt.xlabel('X-axis')
plt.ylabel('Y-axis')
plt.legend()
plt.grid(True)
plt.show()
Output:
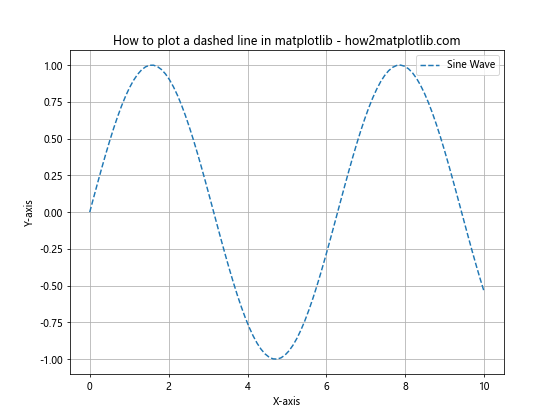
在这个例子中,我们创建了一个简单的正弦波图,使用linestyle='--'参数来绘制虚线。figsize=(8, 6)设置图形大小,label参数用于图例,title、xlabel和ylabel分别设置标题和轴标签,legend()显示图例,grid(True)添加网格线。
2. 自定义虚线样式
Matplotlib提供了多种方式来自定义虚线的样式,包括改变虚线的间隔、长度和颜色等。
2.1 使用字符串简写
除了'--',Matplotlib还支持其他字符串简写来表示不同的虚线样式:
import matplotlib.pyplot as plt
import numpy as np

x = np.linspace(0, 10, 100)
y1 = np.sin(x)
y2 = np.cos(x)
y3 = np.tan(x)

plt.figure(figsize=(10, 6))
plt.plot(x, y1, linestyle='--', label='Dashed')
plt.plot(x, y2, linestyle=':', label='Dotted')
plt.plot(x, y3, linestyle='-.', label='Dash-dot')
plt.title('Different line styles - how2matplotlib.com')
plt.xlabel('X-axis')
plt.ylabel('Y-axis')
plt.legend()
plt.ylim(-2, 2)  # 限制y轴范围以便更好地显示
plt.grid(True)
plt.show()
Output:
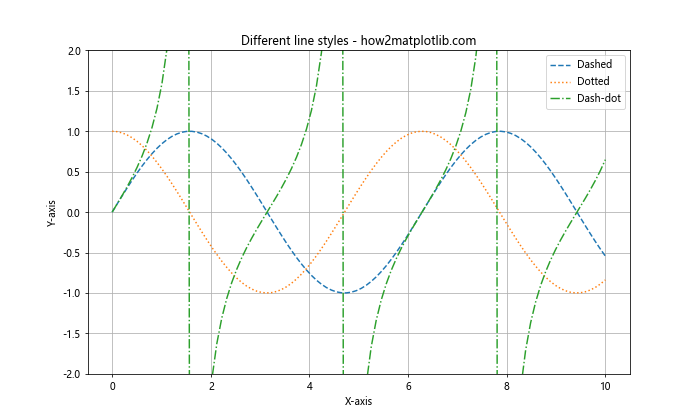
这个例子展示了三种不同的虚线样式:虚线('--')、点线(':')和点划线('-.')。
2.2 使用元组定义自定义样式
对于更精细的控制,可以使用元组来定义虚线的样式:
import matplotlib.pyplot as plt
import numpy as np

x = np.linspace(0, 10, 100)
y = np.sin(x)

plt.figure(figsize=(10, 6))
plt.plot(x, y, linestyle=(0, (5, 5)), label='(5, 5) dashes')
plt.plot(x, y + 0.5, linestyle=(0, (5, 1)), label='(5, 1) dashes')
plt.plot(x, y - 0.5, linestyle=(0, (1, 1)), label='(1, 1) dots')
plt.title('Custom dash styles - how2matplotlib.com')
plt.xlabel('X-axis')
plt.ylabel('Y-axis')
plt.legend()
plt.grid(True)
plt.show()
Output:
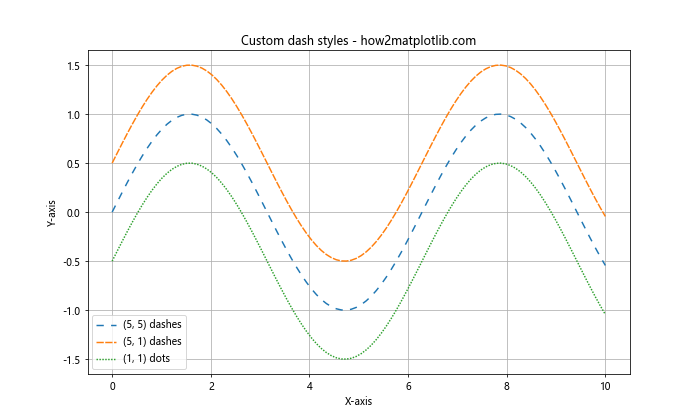
在这个例子中,(0, (5, 5))表示线段长5个点,间隔5个点;(0, (5, 1))表示线段长5个点,间隔1个点;(0, (1, 1))实际上创建了一个点线。
3. 在不同类型的图表中应用虚线
虚线不仅可以用于基本的线图,还可以应用于其他类型的图表,如散点图、条形图等。
3.1 散点图中的虚线
在散点图中,虚线通常用于表示趋势线或拟合线:
import matplotlib.pyplot as plt
import numpy as np

np.random.seed(42)
x = np.linspace(0, 10, 50)
y = 2 * x + 1 + np.random.normal(0, 1, 50)

plt.figure(figsize=(8, 6))
plt.scatter(x, y, label='Data points')
plt.plot(x, 2*x + 1, linestyle='--', color='red', label='Trend line')
plt.title('Scatter plot with dashed trend line - how2matplotlib.com')
plt.xlabel('X-axis')
plt.ylabel('Y-axis')
plt.legend()
plt.grid(True)
plt.show()
Output:
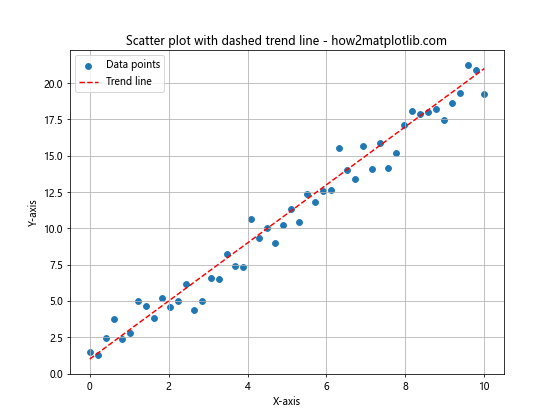
这个例子展示了如何在散点图中添加一条虚线趋势线。散点使用scatter()函数绘制,而趋势线使用plot()函数with linestyle='--'参数绘制。
3.2 条形图中的虚线
虽然条形图通常不使用虚线,但我们可以用虚线来标记特定的阈值或平均值:
import matplotlib.pyplot as plt
import numpy as np

categories = ['A', 'B', 'C', 'D', 'E']
values = np.random.randint(10, 100, 5)
average = np.mean(values)

plt.figure(figsize=(8, 6))
plt.bar(categories, values)
plt.axhline(y=average, linestyle='--', color='red', label='Average')
plt.title('Bar chart with dashed average line - how2matplotlib.com')
plt.xlabel('Categories')
plt.ylabel('Values')
plt.legend()
plt.grid(True, axis='y')
plt.show()
Output:
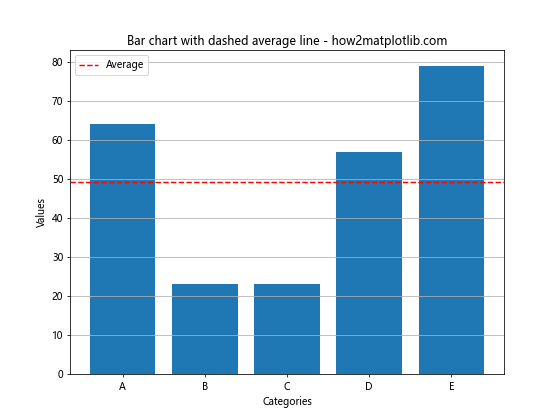
在这个例子中,我们使用axhline()函数绘制了一条表示平均值的水平虚线。
4. 多线图中的虚线应用
在多线图中,使用不同的线型(包括虚线)可以帮助区分不同的数据系列:
import matplotlib.pyplot as plt
import numpy as np

x = np.linspace(0, 10, 100)
y1 = np.sin(x)
y2 = np.cos(x)
y3 = np.tan(x)

plt.figure(figsize=(10, 6))
plt.plot(x, y1, label='sin(x)')
plt.plot(x, y2, linestyle='--', label='cos(x)')
plt.plot(x, y3, linestyle=':', label='tan(x)')
plt.title('Multiple lines with different styles - how2matplotlib.com')
plt.xlabel('X-axis')
plt.ylabel('Y-axis')
plt.legend()
plt.ylim(-2, 2)
plt.grid(True)
plt.show()
Output:
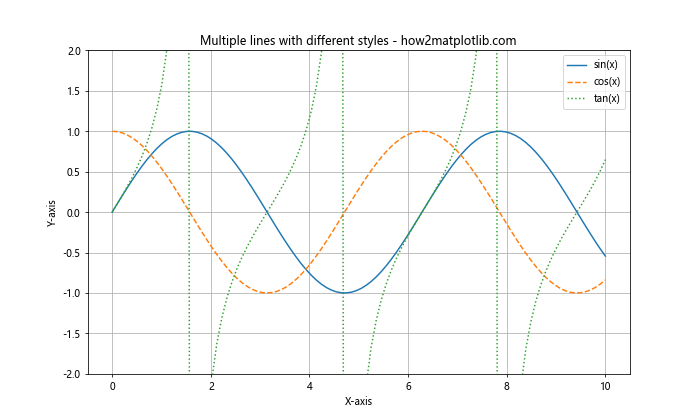
这个例子展示了如何在同一图表中使用不同的线型,包括实线、虚线和点线,以区分不同的三角函数。
5. 虚线与颜色和标记的组合
虚线可以与颜色和标记结合使用,以创建更丰富的视觉效果:
import matplotlib.pyplot as plt
import numpy as np

x = np.linspace(0, 10, 20)
y1 = np.sin(x)
y2 = np.cos(x)

plt.figure(figsize=(10, 6))
plt.plot(x, y1, linestyle='--', color='blue', marker='o', label='sin(x)')
plt.plot(x, y2, linestyle=':', color='red', marker='s', label='cos(x)')
plt.title('Dashed lines with colors and markers - how2matplotlib.com')
plt.xlabel('X-axis')
plt.ylabel('Y-axis')
plt.legend()
plt.grid(True)
plt.show()
Output:
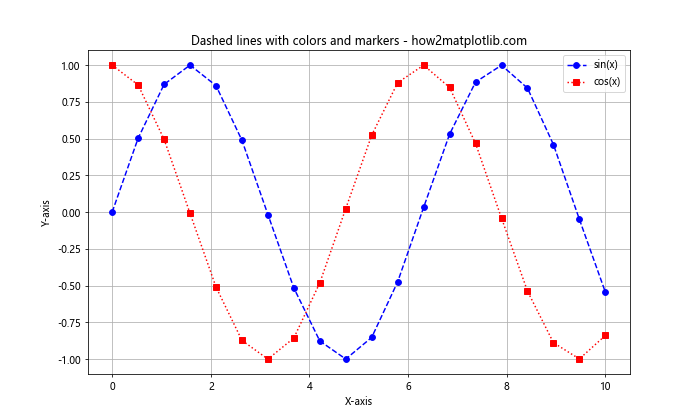
在这个例子中,我们为每条线设置了不同的虚线样式、颜色和标记。marker参数用于添加数据点标记。
6. 在子图中使用虚线
当创建包含多个子图的复杂图表时,可以在不同的子图中使用虚线:
import matplotlib.pyplot as plt
import numpy as np

x = np.linspace(0, 10, 100)
y1 = np.sin(x)
y2 = np.cos(x)

fig, (ax1, ax2) = plt.subplots(2, 1, figsize=(10, 8))

ax1.plot(x, y1, linestyle='--', label='sin(x)')
ax1.set_title('Subplot 1: sin(x) - how2matplotlib.com')
ax1.set_xlabel('X-axis')
ax1.set_ylabel('Y-axis')
ax1.legend()
ax1.grid(True)

ax2.plot(x, y2, linestyle=':', label='cos(x)')
ax2.set_title('Subplot 2: cos(x) - how2matplotlib.com')
ax2.set_xlabel('X-axis')
ax2.set_ylabel('Y-axis')
ax2.legend()
ax2.grid(True)

plt.tight_layout()
plt.show()
Output:
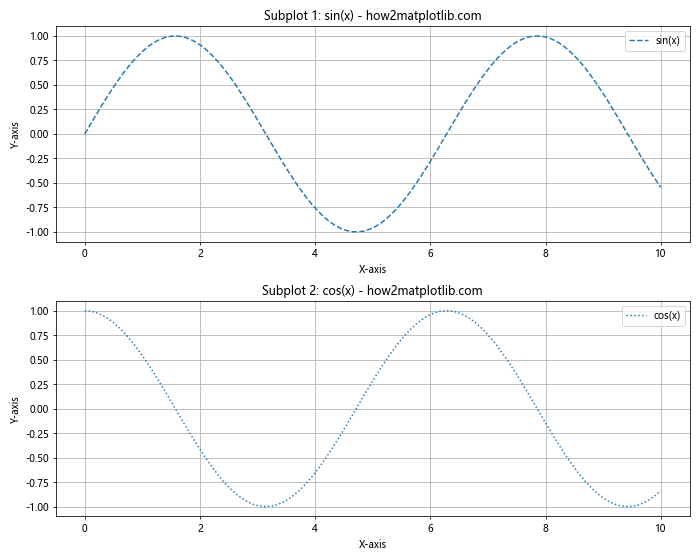
这个例子创建了两个子图,每个子图都使用不同的虚线样式。tight_layout()函数用于自动调整子图之间的间距。
7. 使用虚线绘制垂直和水平线
虚线不仅可以用于数据曲线,还可以用于绘制垂直和水平参考线:
import matplotlib.pyplot as plt
import numpy as np

x = np.linspace(0, 10, 100)
y = np.sin(x)

plt.figure(figsize=(10, 6))
plt.plot(x, y)
plt.axvline(x=5, linestyle='--', color='red', label='Vertical line')
plt.axhline(y=0, linestyle=':', color='green', label='Horizontal line')
plt.title('Vertical and horizontal dashed lines - how2matplotlib.com')
plt.xlabel('X-axis')
plt.ylabel('Y-axis')
plt.legend()
plt.grid(True)
plt.show()
Output:
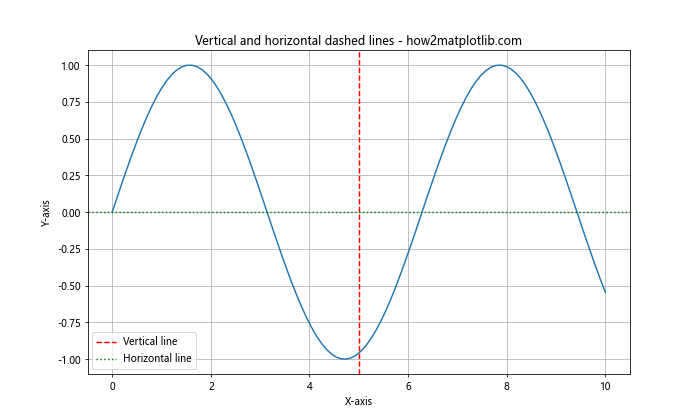
在这个例子中,axvline()用于绘制垂直虚线,axhline()用于绘制水平虚线。这些线可以用来标记重要的x或y值。
8. 在填充区域中使用虚线边界
当使用fill_between()函数填充区域时,可以使用虚线作为填充区域的边界:
import matplotlib.pyplot as plt
import numpy as np

x = np.linspace(0, 10, 100)
y1 = np.sin(x)
y2 = np.cos(x)

plt.figure(figsize=(10, 6))
plt.plot(x, y1, label='sin(x)')
plt.plot(x, y2, label='cos(x)')
plt.fill_between(x, y1, y2, alpha=0.3, linestyle='--', edgecolor='red')
plt.title('Filled area with dashed boundary - how2matplotlib.com')
plt.xlabel('X-axis')
plt.ylabel('Y-axis')
plt.legend()
plt.grid(True)
plt.show()
Output:
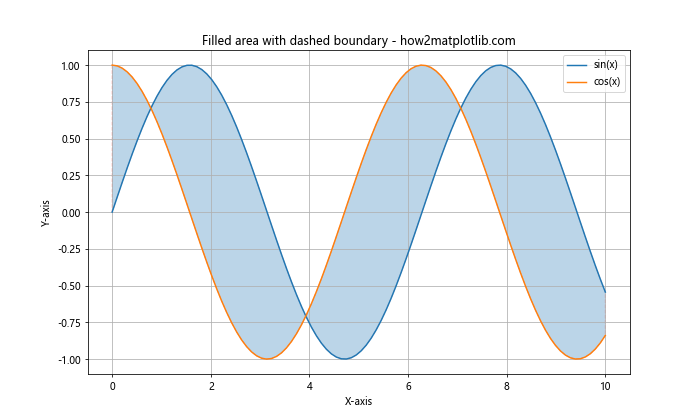
这个例子展示了如何在两条曲线之间填充区域,并使用虚线作为填充区域的边界。alpha参数用于设置填充区域的透明度。
9. 在极坐标图中使用虚线
虚线也可以应用于极坐标图:
import matplotlib.pyplot as plt
import numpy as np

theta = np.linspace(0, 2*np.pi, 100)
r = np.sin(4*theta)

plt.figure(figsize=(8, 8))
ax = plt.subplot(111, projection='polar')
ax.plot(theta, r, linestyle='--')
ax.set_title('Polar plot with dashed line - how2matplotlib.com')
plt.show()
Output:
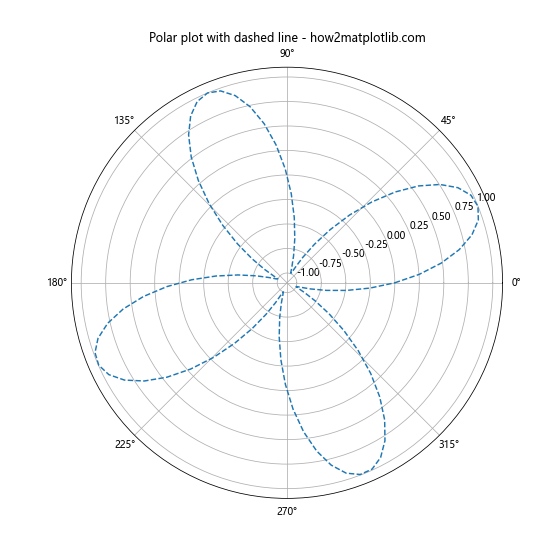
这个例子展示了如何在极坐标系中绘制虚线。projection='polar'参数用于创建极坐标图。
10. 使用虚线绘制误差线
在绘制带有误差线的图表时,可以使用虚线来表示误差范围:
import matplotlib.pyplot as plt
import numpy as np

x = np.linspace(0, 10, 50)
y = np.sin(x)
error = 0.1 + 0.2 * np.random.random(len(x))

plt.figure(figsize=(10, 6))
plt.errorbar(x, y, yerr=error, fmt='o', linestyle='--', capsize=5)
plt.title('Error bars with dashed lines - how2matplotlib.com')
plt.xlabel('X-axis')
plt.ylabel('Y-axis')
plt.grid(True)
plt.show()
Output:
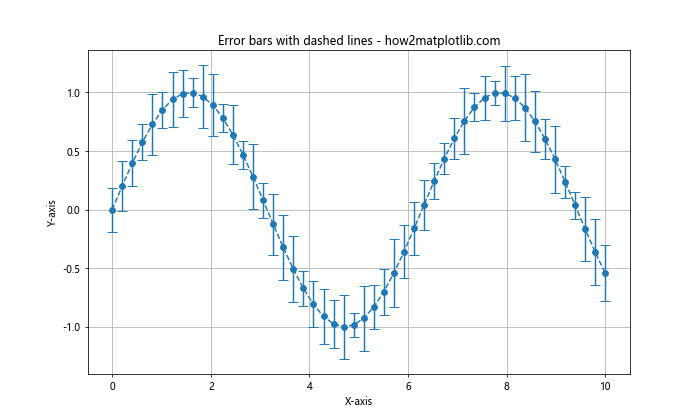
在这个例子中,errorbar()函数用于绘制带有误差线的数据点。linestyle='--'参数使误差线呈现为虚线,capsize参数设置误差线端点的大小。
结论
通过本文的详细介绍和丰富的示例,我们全面探讨了如何在Matplotlib中绘制虚线。从基本的虚线绘制到高级的自定义样式,从在不同类型的图表中应用虚线到与其他绘图元素的组合,我们涵盖了多种使用虚线的场景和技巧。虚线不仅可以增加图表的视觉吸引力,还能有效地传达额外的信息,如趋势、预测或数据分组。
在实际应用中,选择合适的虚线样式和参数可以大大提高数据可视化的效果。通过调整线型、颜色、宽度等属性,可以创建出既美观又富有信息量的图表。记住,虚线的使用应该服务于数据的清晰表达,而不是仅仅为了美观。
以下是一些使用虚线时的最佳实践:
- 保持一致性:在同一图表或报告中,保持虚线样式的一致性,以便读者能够轻松理解不同线条的含义。
-
避免过度使用:虽然虚线可以增加视觉兴趣,但过度使用可能会使图表变得混乱。适度使用虚线,只在需要强调或区分的地方使用。
-
考虑可读性:特别是在打印时,确保虚线的间隔和长度足够清晰可见。
-
结合颜色和标记:虚线可以与不同的颜色和数据点标记结合使用,以进一步增强数据的可区分性。
-
使用图例:当使用不同的虚线样式时,务必提供清晰的图例说明每种线型的含义。
-
适应图表类型:根据图表类型选择合适的虚线应用方式,例如在散点图中用于趋势线,在条形图中用于阈值线等。
最后,让我们再看一个综合性的例子,它结合了多种虚线技巧:
import matplotlib.pyplot as plt
import numpy as np

# 生成数据
x = np.linspace(0, 10, 100)
y1 = np.sin(x)
y2 = np.cos(x)
y3 = np.tan(x)

# 创建图表
fig, (ax1, ax2) = plt.subplots(2, 1, figsize=(12, 10))

# 上半部分:多条线与填充区域
ax1.plot(x, y1, label='sin(x)')
ax1.plot(x, y2, linestyle='--', label='cos(x)')
ax1.fill_between(x, y1, y2, where=(y1 > y2), alpha=0.3,
                 linestyle=':', edgecolor='red', label='sin(x) > cos(x)')
ax1.set_title('Multiple lines and filled area - how2matplotlib.com')
ax1.set_xlabel('X-axis')
ax1.set_ylabel('Y-axis')
ax1.legend()
ax1.grid(True)

# 下半部分:散点图与趋势线
np.random.seed(42)
x_scatter = np.linspace(0, 10, 50)
y_scatter = 2 * x_scatter + 1 + np.random.normal(0, 1, 50)
ax2.scatter(x_scatter, y_scatter, label='Data points')
ax2.plot(x_scatter, 2*x_scatter + 1, linestyle='--', color='red', label='Trend line')
ax2.axhline(y=np.mean(y_scatter), linestyle='-.', color='green', label='Mean')
ax2.set_title('Scatter plot with trend line and mean - how2matplotlib.com')
ax2.set_xlabel('X-axis')
ax2.set_ylabel('Y-axis')
ax2.legend()
ax2.grid(True)

plt.tight_layout()
plt.show()
Output:
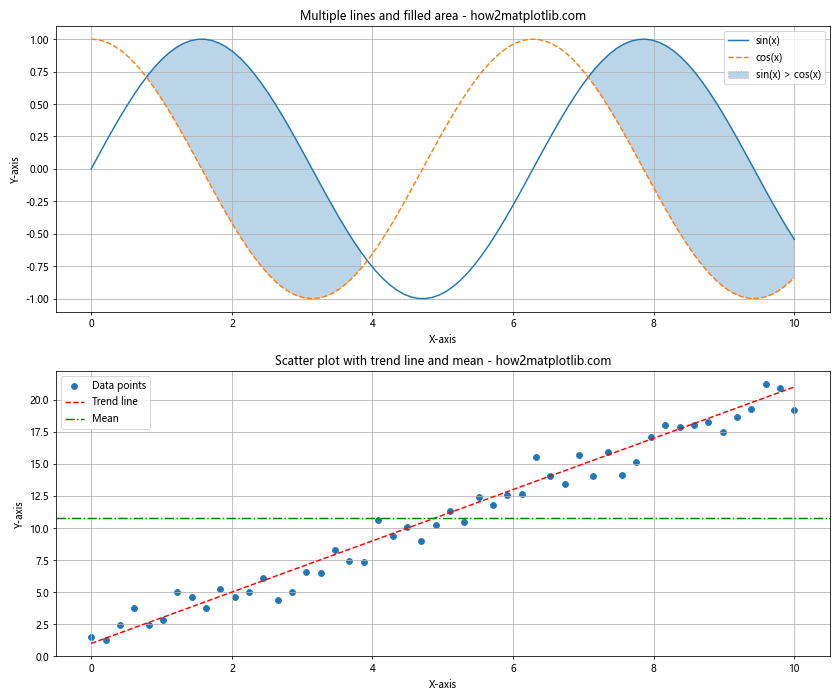
这个综合例子展示了:
1. 在上半部分,我们绘制了两条不同样式的线(实线和虚线),并使用点线边界填充了它们之间的区域。
2. 在下半部分,我们创建了一个散点图,添加了一条虚线趋势线,以及一条点划线表示平均值。
这个例子展示了如何在一个复杂的图表中有效地使用不同的虚线样式来传达多层次的信息。
总之,掌握Matplotlib中绘制虚线的技巧可以大大提升你的数据可视化能力。通过灵活运用这些技巧,你可以创建出既专业又富有洞察力的图表,有效地传达你的数据故事。记住,好的数据可视化不仅仅是about美观,更重要的是能够清晰、准确地传达信息。因此,在使用虚线时,始终要考虑它们如何增强你的数据叙述,而不是分散读者的注意力。
随着你在数据可视化领域的不断探索,你会发现还有许多其他的Matplotlib功能可以与虚线技巧结合使用,例如自定义颜色映射、3D绘图、动画等。继续学习和实践,你将能够创建出更加复杂和富有表现力的可视化作品。
最后,建议你经常查阅Matplotlib的官方文档,因为它提供了最新和最全面的信息。同时,参与数据可视化社区,分享你的作品并学习他人的技巧,也是提升技能的好方法。记住,在数据可视化的世界里,创造力和技术同样重要,所以不要害怕尝试新的想法和方法。祝你在Matplotlib的使用中取得成功,创造出令人印象深刻的数据可视化作品!
 极客笔记
极客笔记