如何在Matplotlib中制作折线图
参考:how to make line plot in matplotlib
Matplotlib是一个Python绘图库,可以用来制作各种类型的图表,包括折线图。在本文中,我们将学习如何使用Matplotlib制作折线图。
基本的折线图示例
下面是一个简单的示例,展示如何在Matplotlib中创建一个基本的折线图:
import matplotlib.pyplot as plt

x = [1, 2, 3, 4, 5]
y = [2, 3, 5, 7, 11]

plt.plot(x, y)
plt.show()
Output:
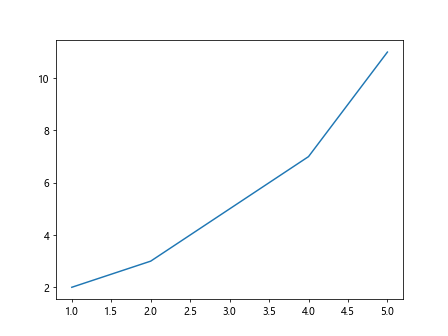
在这个例子中,我们定义了两个列表x和y,分别代表横坐标和纵坐标的值。然后调用plt.plot()方法来绘制折线图,并用plt.show()来显示图表。
自定义折线图样式
你可以通过传递额外的参数给plt.plot()方法来自定义折线图的样式,比如线的颜色、线型和点标记:
import matplotlib.pyplot as plt

x = [1, 2, 3, 4, 5]
y = [2, 3, 5, 7, 11]

plt.plot(x, y, color='red', linestyle='--', marker='o')
plt.show()
Output:
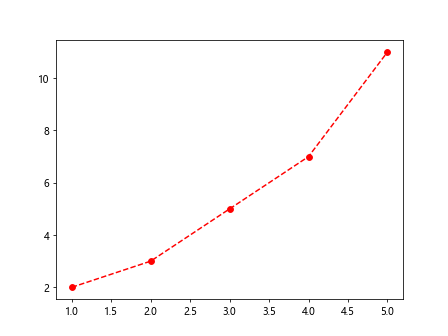
在这个例子中,我们通过color参数设置线的颜色为红色,通过linestyle参数设置线的样式为虚线,通过marker参数设置点的标记为圆点。
添加标题和标签
你可以通过plt.title()、plt.xlabel()和plt.ylabel()方法来添加标题和轴标签:
import matplotlib.pyplot as plt

x = [1, 2, 3, 4, 5]
y = [2, 3, 5, 7, 11]

plt.plot(x, y)
plt.title('Example Line Plot')
plt.xlabel('X-axis')
plt.ylabel('Y-axis')
plt.show()
Output:
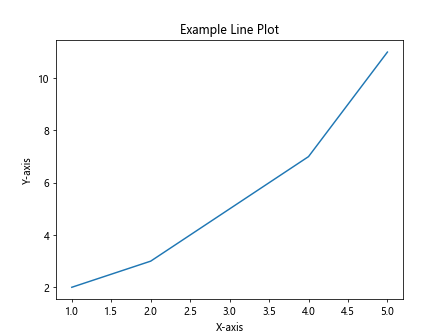
在这个例子中,我们使用plt.title()来添加标题,使用plt.xlabel()和plt.ylabel()来添加X轴和Y轴的标签。
绘制多条折线
你也可以在同一个图中绘制多条折线,只需要调用多次plt.plot()方法即可:
import matplotlib.pyplot as plt

x = [1, 2, 3, 4, 5]
y1 = [2, 3, 5, 7, 11]
y2 = [1, 4, 9, 16, 25]

plt.plot(x, y1, label='Line 1')
plt.plot(x, y2, label='Line 2')
plt.legend()
plt.show()
Output:
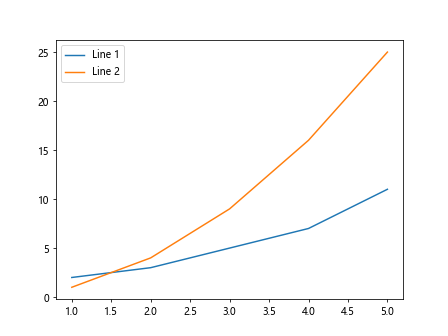
在这个例子中,我们定义了两个纵坐标的列表y1和y2,然后分别调用plt.plot()方法绘制两条折线,并使用label参数为每条折线添加标签,最后调用plt.legend()来显示图例。
使用不同风格的抗锯齿线条
如果你想要在线条上使用不同的风格,可以通过linestyle参数来实现。在下面的示例中,我们展示了如何使用不同的线条风格:
import matplotlib.pyplot as plt

x = [1, 2, 3, 4, 5]
y1 = [2, 3, 5, 7, 11]
y2 = [1, 4, 9, 16, 25]

plt.plot(x, y1, linestyle='-', label='Solid Line')
plt.plot(x, y2, linestyle='--', label='Dashed Line')
plt.plot(x, [10, 10, 10, 10, 10], linestyle=':', label='Dotted Line')
plt.plot(x, [9, 6, 3, 6, 9], linestyle='-.', label='Dash-dot Line')
plt.legend()
plt.show()
Output:
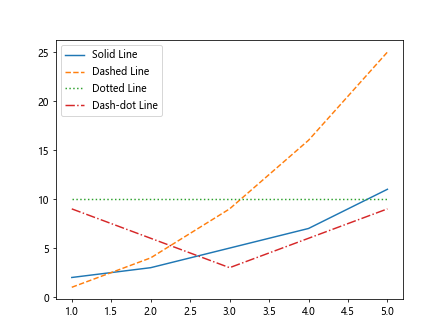
在这个例子中,我们分别绘制了实线、虚线、点线和点划线风格的折线,并使用linestyle参数来指定线条风格。
设置坐标轴范围
你可以通过plt.xlim()和plt.ylim()方法来设置横坐标和纵坐标的范围,以便更好地展示数据的变化:
import matplotlib.pyplot as plt

x = [1, 2, 3, 4, 5]
y = [2, 3, 5, 7, 11]

plt.plot(x, y)
plt.xlim(0, 6)
plt.ylim(0, 12)
plt.show()
Output:
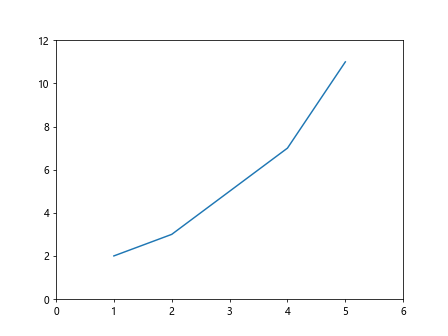
在这个例子中,我们使用plt.xlim()和plt.ylim()方法来设置横坐标和纵坐标的范围分别为0到6和0到12。
添加网格线
你可以通过调用plt.grid()方法来添加网格线,以便更好地显示数据的变化趋势:
import matplotlib.pyplot as plt

x = [1, 2, 3, 4, 5]
y = [2, 3, 5, 7, 11]

plt.plot(x, y)
plt.grid()
plt.show()
Output:
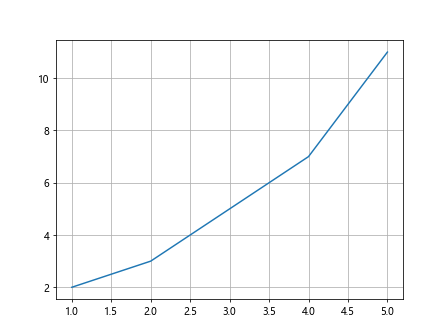
在这个例子中,我们调用plt.grid()方法来添加网格线。
自定义线条粗细和透明度
你可以通过linewidth和alpha参数来自定义线条的粗细和透明度,以更好地展示数据的变化:
import matplotlib.pyplot as plt

x = [1, 2, 3, 4, 5]
y = [2, 3, 5, 7, 11]

plt.plot(x, y, linewidth=2, alpha=0.5)
plt.show()
Output:
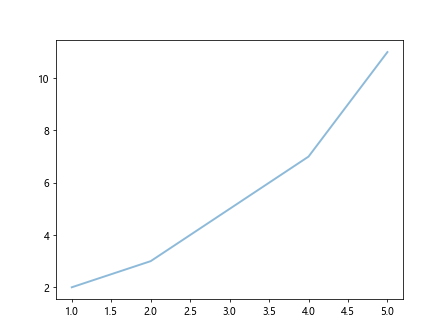
在这个例子中,我们通过linewidth参数设置线条的粗细为2,通过alpha参数设置线条的透明度为0.5。
在同一图中绘制多个子图
你可以通过使用plt.subplot()方法在同一个图中绘制多个子图,以便比较多组数据之间的关系:
import matplotlib.pyplot as plt

x = [1, 2, 3, 4, 5]
y1 = [2, 3, 5, 7, 11]
y2 = [1, 4, 9, 16, 25]

plt.subplot(2, 1, 1)
plt.plot(x, y1)
plt.title('Subplot 1')

plt.subplot(2, 1, 2)
plt.plot(x, y2)
plt.title('Subplot 2')

plt.show()
Output:
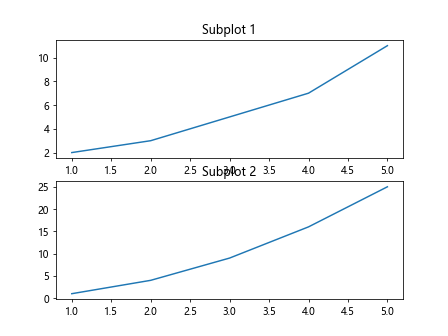
在这个例子中,我们通过plt.subplot()方法在同一个图中绘制了两个子图,分别展示了不同的数据集。
添加文字和注释
你可以通过plt.text()和plt.annotate()方法在图中添加文字和注释,以便更好地说明数据的意义:
import matplotlib.pyplot as plt

x = [1, 2, 3, 4, 5]
y = [2, 3, 5, 7, 11]

plt.plot(x, y)
plt.text(3, 6, 'Important Point', fontsize=12)
plt.annotate('Maximum', xy=(5, 11), xytext=(4, 10), arrowprops=dict(facecolor='black', shrink=0.05))
plt.show()
Output:
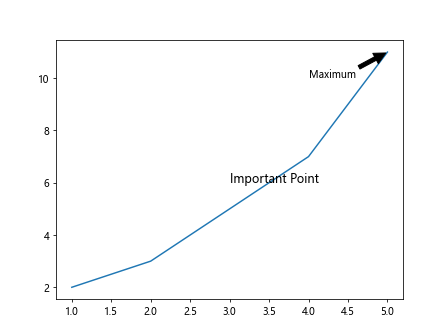
在这个例子中,我们使用plt.text()方法在图中添加了一个重要点的文字说明,使用plt.annotate()方法添加了一个箭头指向最大值,并在箭头旁边添加了注释。
绘制多个子图并设置间距
你可以使用plt.subplots()方法创建一个包含多个子图的图表,并通过调整hspace和wspace参数来设置子图之间的间距:
import matplotlib.pyplot as plt

x = [1, 2, 3, 4, 5]
y1 = [2, 3, 5, 7, 11]
y2 = [1, 4, 9, 16, 25]

fig, axs = plt.subplots(2, 1, figsize=(8, 6), sharex=True)
fig.subplots_adjust(hspace=0.5)

axs[0].plot(x, y1)
axs[0].set_title('Subplot 1')

axs[1].plot(x, y2)
axs[1].set_title('Subplot 2')

plt.show()
Output:
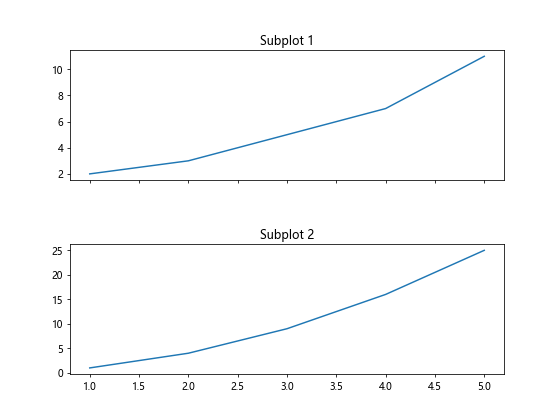
在这个例子中,我们使用plt.subplots()方法创建了一个包含两个子图的图表,使用fig.subplots_adjust()方法设置了子图之间的垂直间距为0.5。
使用日期作为横坐标
如果你的数据集包含时间序列数据,你可以将日期作为横坐标,并根据需要格式化日期:
import matplotlib.dates as mdates
import datetime
import matplotlib.pyplot as plt

dates = [datetime.date(2021, 1, 1), datetime.date(2021, 2, 1), datetime.date(2021, 3, 1), datetime.date(2021, 4, 1), datetime.date(2021, 5, 1)]
values = [2, 3, 5, 7, 11]

plt.gca().xaxis.set_major_formatter(mdates.DateFormatter('%Y-%m-%d'))
plt.gca().xaxis.set_major_locator(mdates.MonthLocator())
plt.plot(dates, values)
plt.show()
在这个例子中,我们使用matplotlib.dates模块来格式化日期,将日期作为横坐标展示。
通过这些示例,你应该能够掌握如何使用Matplotlib制作折线图,包括基本的折线图、自定义样式、添加标题和标签、绘制多条折线、设置坐标轴范围、添加网格线、自定义线条粗细和透明度、绘制多个子图、添加文字和注释等功能。
 极客笔记
极客笔记