如何在matplotlib中为散点图中的每个点标记文本
参考:how to label each point in scatter plot matplotlib
在数据可视化中,散点图是一种常用的展示数据分布和关联关系的方法。在matplotlib中,我们可以通过添加文本标签来标识每个散点,以便更清晰地表达数据。下面将详细介绍如何为散点图中的每个点添加标签。
1. 基本散点图和标签
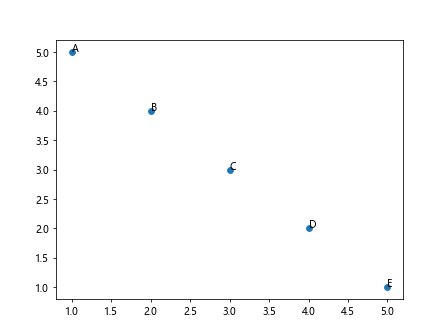
首先,我们创建一个简单的散点图,并为每个点添加标签。我们可以使用text()函数来在指定位置添加文本标签。
import matplotlib.pyplot as plt

# 生成数据
x = [1, 2, 3, 4, 5]
y = [5, 4, 3, 2, 1]
labels = ['A', 'B', 'C', 'D', 'E']

# 创建散点图
plt.scatter(x, y)

# 为每个点添加标签
for i, label in enumerate(labels):
    plt.text(x[i], y[i], label)

plt.show()
Output:
2. 修改标签样式
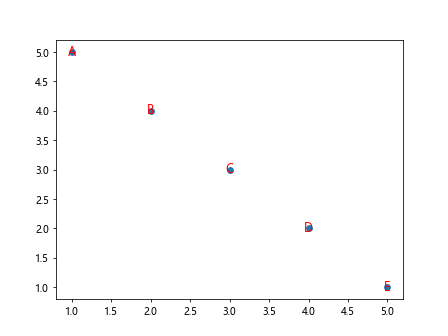
我们可以通过修改text()函数的参数来调整标签的样式,例如设置字体大小、颜色、对齐方式等。
import matplotlib.pyplot as plt

# 生成数据
x = [1, 2, 3, 4, 5]
y = [5, 4, 3, 2, 1]
labels = ['A', 'B', 'C', 'D', 'E']

# 创建散点图
plt.scatter(x, y)

# 为每个点添加标签,并设置样式
for i, label in enumerate(labels):
    plt.text(x[i], y[i], label, fontsize=12, color='red', ha='center', va='center')

plt.show()
Output:
3. 自定义标签位置
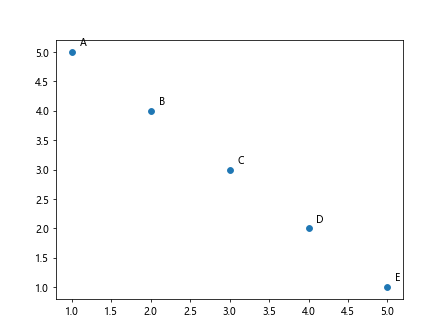
有时候,我们希望将标签放置在散点图的周围而不是直接在数据点上。这里我们可以通过微调标签的位置来实现。
import matplotlib.pyplot as plt

# 生成数据
x = [1, 2, 3, 4, 5]
y = [5, 4, 3, 2, 1]
labels = ['A', 'B', 'C', 'D', 'E']

# 创建散点图
plt.scatter(x, y)

# 为每个点添加标签,微调位置
for i, label in enumerate(labels):
    plt.text(x[i]+0.1, y[i]+0.1, label)

plt.show()
Output:
4. 使用箭头标注
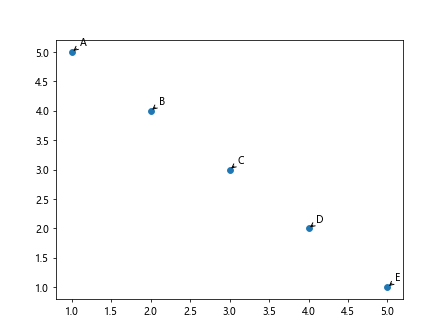
除了简单的文本标签外,我们还可以使用箭头标注来指示某些特殊的点。可以使用annotate()函数来实现。
import matplotlib.pyplot as plt

# 生成数据
x = [1, 2, 3, 4, 5]
y = [5, 4, 3, 2, 1]
labels = ['A', 'B', 'C', 'D', 'E']

# 创建散点图
plt.scatter(x, y)

# 为每个点添加标签并使用箭头标注
for i, label in enumerate(labels):
    plt.annotate(label, (x[i], y[i]), xytext=(x[i]+0.1, y[i]+0.1), arrowprops=dict(arrowstyle='->'))

plt.show()
Output:
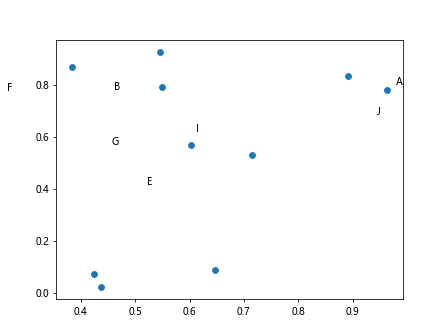
5. 标签位置随机分布
有时候,我们希望将标签随机分布在散点图中,而不是与数据点一一对应,这样可以使图表更具有随机性。
import matplotlib.pyplot as plt
import numpy as np

# 生成随机数据
np.random.seed(0)
x = np.random.rand(10)
y = np.random.rand(10)
labels = ['A', 'B', 'C', 'D', 'E', 'F', 'G', 'H', 'I', 'J']

# 创建散点图
plt.scatter(x, y)

# 随机分布标签
for label in labels:
    plt.text(np.random.rand(), np.random.rand(), label)

plt.show()
Output:
6. 控制标签显示范围
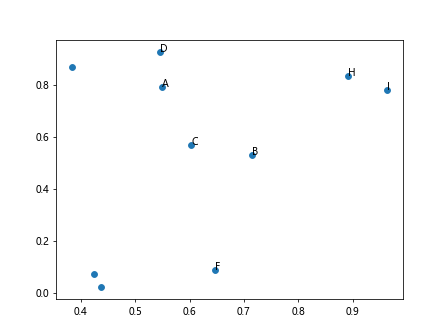
有时候,数据点过多或者标签内容较长,导致标签重叠或者超出图表范围。这时可以通过控制标签的显示范围来解决。
import matplotlib.pyplot as plt
import numpy as np

# 生成随机数据
np.random.seed(0)
x = np.random.rand(10)
y = np.random.rand(10)
labels = ['A', 'B', 'C', 'D', 'E', 'F', 'G', 'H', 'I', 'J']

# 创建散点图
plt.scatter(x, y)

# 控制标签位置
for i, label in enumerate(labels):
    if x[i] > 0.5:  # 仅在x坐标大于0.5的点上显示标签
        plt.text(x[i], y[i], label)

plt.show()
Output:
7. 添加HTML标签
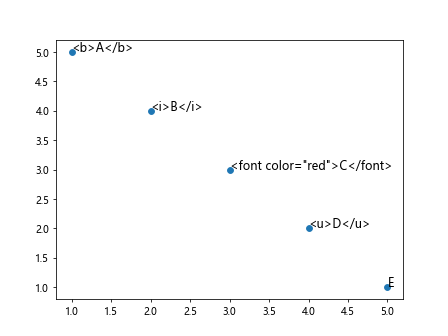
在标签中添加HTML标签,可以实现更加丰富的文本样式,例如加粗、斜体、颜色等。
import matplotlib.pyplot as plt

# 生成数据
x = [1, 2, 3, 4, 5]
y = [5, 4, 3, 2, 1]
labels = ['<b>A</b>', '<i>B</i>', '<font color="red">C</font>', '<u>D</u>', 'E']

# 创建散点图
plt.scatter(x, y)

# 为每个点添加带有HTML标签的标签
for i, label in enumerate(labels):
    plt.text(x[i], y[i], label, fontsize=12)

plt.show()
Output:
8. 使用循环标签
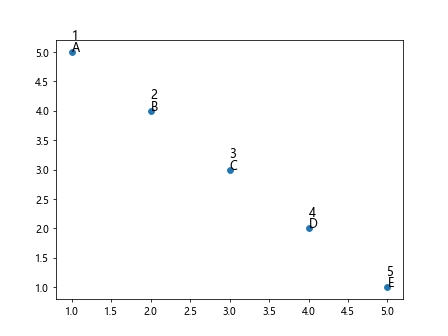
有时候,我们想要为每个点显示一系列的内容,可以通过循环显示多个标签。
import matplotlib.pyplot as plt

# 生成数据
x = [1, 2, 3, 4, 5]
y = [5, 4, 3, 2, 1]
labels = ['A\n1', 'B\n2', 'C\n3', 'D\n4', 'E\n5']

# 创建散点图
plt.scatter(x, y)

# 循环显示多个标签
for i, label in enumerate(labels):
    for j, sub_label in enumerate(label.split('\n')):
        plt.text(x[i], y[i]+j*0.2, sub_label, fontsize=12)

plt.show()
Output:
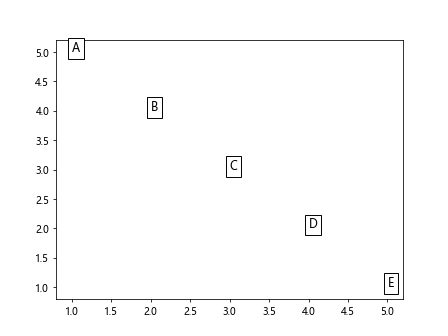
9. 添加背景框
为标签添加背景框可以使标签更加突出和易于阅读。
import matplotlib.pyplot as plt

# 生成数据
x = [1, 2, 3, 4, 5]
y = [5, 4, 3, 2, 1]
labels = ['A', 'B', 'C', 'D', 'E']

# 创建散点图
plt.scatter(x, y)

# 为每个点添加标签和背景框
for i, label in enumerate(labels):
    plt.text(x[i], y[i], label, fontsize=12, bbox=dict(facecolor='white', edgecolor='black'))

plt.show()
Output:
10. 自定义标签连接线样式
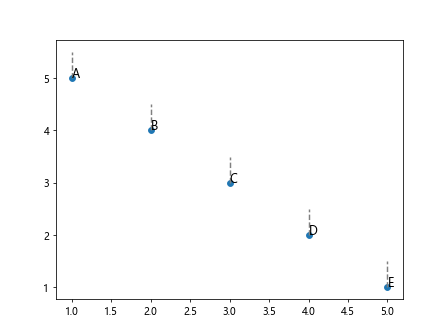
有时候,我们希望为标签添加连接线,以指示与具体数据点的关联。可以使用plt.plot()函数来添加连接线。
import matplotlib.pyplot as plt

# 生成数据
x = [1, 2, 3, 4, 5]
y = [5, 4, 3, 2, 1]
labels = ['A', 'B', 'C', 'D', 'E']

# 创建散点图
plt.scatter(x, y)

# 循环添加标签和连接线
for i, label in enumerate(labels):
    plt.text(x[i], y[i], label, fontsize=12)
    plt.plot([x[i], x[i]], [y[i], y[i]+0.5], color='gray', linestyle='--')  # 添加连接线

plt.show()
Output:
11. 添加标签旋转
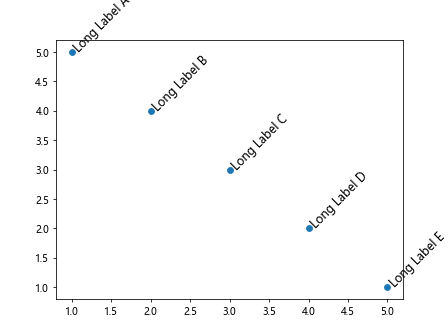
有时候,数据点较密集,标签较长,为了避免标签重叠,可以通过旋转标签来调整显示方式。
import matplotlib.pyplot as plt

# 生成数据
x = [1, 2, 3, 4, 5]
y = [5, 4, 3, 2, 1]
labels = ['Long Label A', 'Long Label B', 'Long Label C', 'Long Label D', 'Long Label E']

# 创建散点图
plt.scatter(x, y)

# 为每个点添加标签并旋转
for i, label in enumerate(labels):
    plt.text(x[i], y[i], label, fontsize=12, rotation=45)

plt.show()
Output:
12. 隐藏部分标签
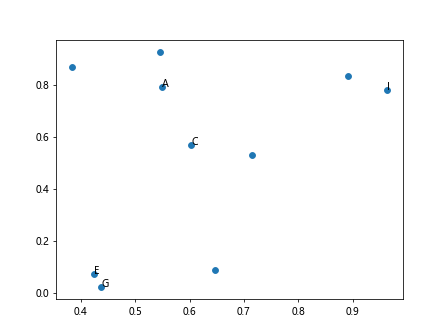
如果数据点太多,无法将所有标签都显示出来,可以选择隐藏部分标签,只显示关键点的标签。
import matplotlib.pyplot as plt
import numpy as np

# 生成随机数据
np.random.seed(0)
x = np.random.rand(10)
y = np.random.rand(10)
labels = ['A', 'B', 'C', 'D', 'E', 'F', 'G', 'H', 'I', 'J']

# 创建散点图
plt.scatter(x, y)

# 隐藏部分标签
for i, label in enumerate(labels):
    if i % 2 == 0:  # 隐藏偶数索引的标签
        plt.text(x[i], y[i], label)

plt.show()
Output:
13. 自定义标签格式
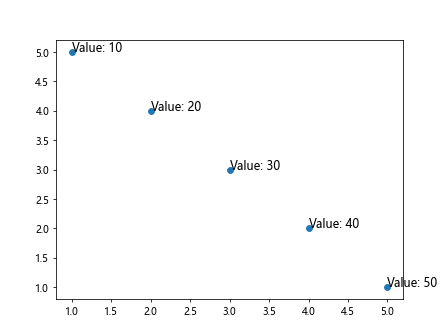
如果标签包含数值等数据,我们可以使用字符串格式化来自定义标签的显示格式。
import matplotlib.pyplot as plt

# 生成数据
x = [1, 2, 3, 4, 5]
y = [5, 4, 3, 2, 1]
values = [10, 20, 30, 40, 50]

# 创建散点图
plt.scatter(x, y)

# 自定义标签格式
for i, value in enumerate(values):
    plt.text(x[i], y[i], f'Value: {value}', fontsize=12)

plt.show()
Output:
14. 动态更新标签内容
有时候,我们希望在交互式图表中动态更新标签内容,可以通过设置标签对象的set_text()方法来实现。
import matplotlib.pyplot as plt
from matplotlib.text import Annotation

# 创建散点图
fig, ax = plt.subplots()
sc = ax.scatter([1, 2, 3], [3, 2, 1])
labels = [f'Label {i}' for i in range(3)]
annotations = [ax.text(1, 3, label) for label in labels]

# 动态更新标签内容
def update_label():
    for i, ann in enumerate(annotations):
        ann.set_text(f'Updated Label {i}')

    fig.canvas.draw()

# 调用更新函数
update_label()
15. 使用字典设置标签颜色
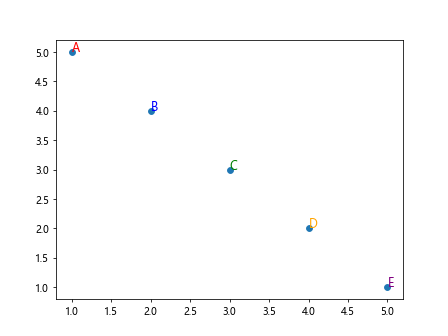
可以通过字典来设置每个标签的颜色,实现每个标签的个性化调整。
import matplotlib.pyplot as plt

# 生成数据
x = [1, 2, 3, 4, 5]
y = [5, 4, 3, 2, 1]
labels = ['A', 'B', 'C', 'D', 'E']
colors = {'A': 'red', 'B': 'blue', 'C': 'green', 'D': 'orange', 'E': 'purple'}

# 创建散点图
plt.scatter(x, y)

# 设置每个标签的颜色
for i, label in enumerate(labels):
    plt.text(x[i], y[i], label, fontsize=12, color=colors[label])

plt.show()
Output:
通过以上示例代码,我们详细介绍了如何在matplotlib中为散点图中的每个点添加标签。通过控制标签的位置、样式、内容等,可以使散点图更加直观、易于理解。
 极客笔记
极客笔记