如何在Python中为Matplotlib图表生成随机颜色
参考:How to generate a random color for a Matplotlib plot in Python
Matplotlib是Python中最流行的数据可视化库之一,它提供了丰富的绘图功能和自定义选项。在创建图表时,选择合适的颜色方案对于提高可读性和美观性至关重要。有时,我们可能需要为图表元素生成随机颜色,以增加视觉多样性或区分不同的数据系列。本文将详细介绍如何在Python中为Matplotlib图表生成随机颜色,并提供多种方法和实用技巧。
1. 使用随机RGB值生成颜色
最直接的方法是使用随机生成的RGB(红、绿、蓝)值来创建颜色。RGB颜色模型中,每个颜色通道的值范围是0到1(或0到255)。我们可以使用Python的random模块来生成这些随机值。
import matplotlib.pyplot as plt
import random

# 生成随机RGB颜色
def random_color():
    return (random.random(), random.random(), random.random())

# 创建示例图表
plt.figure(figsize=(8, 6))
for i in range(5):
    x = range(10)
    y = [random.randint(1, 10) for _ in range(10)]
    plt.plot(x, y, color=random_color(), label=f'Line {i+1} - how2matplotlib.com')

plt.title('Random Color Lines - how2matplotlib.com')
plt.xlabel('X-axis')
plt.ylabel('Y-axis')
plt.legend()
plt.show()
Output:
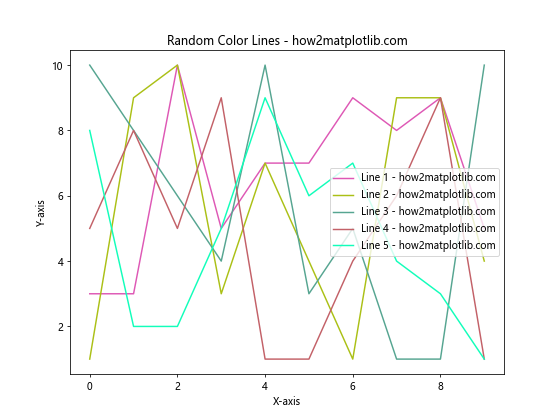
在这个示例中,我们定义了一个random_color()函数,它返回一个由三个随机浮点数组成的元组,代表RGB颜色。然后,我们创建了5条随机颜色的线,每条线的数据点也是随机生成的。
2. 使用Matplotlib内置的颜色映射
Matplotlib提供了许多内置的颜色映射(colormap),我们可以从这些映射中随机选择颜色。这种方法可以确保生成的颜色在视觉上更加协调。
import matplotlib.pyplot as plt
import numpy as np

# 从颜色映射中随机选择颜色
cmap = plt.cm.get_cmap('viridis')
colors = [cmap(np.random.random()) for _ in range(5)]

# 创建示例图表
plt.figure(figsize=(8, 6))
for i, color in enumerate(colors):
    x = range(10)
    y = np.random.randint(1, 10, 10)
    plt.scatter(x, y, color=color, label=f'Scatter {i+1} - how2matplotlib.com')

plt.title('Random Colors from Colormap - how2matplotlib.com')
plt.xlabel('X-axis')
plt.ylabel('Y-axis')
plt.legend()
plt.show()
Output:
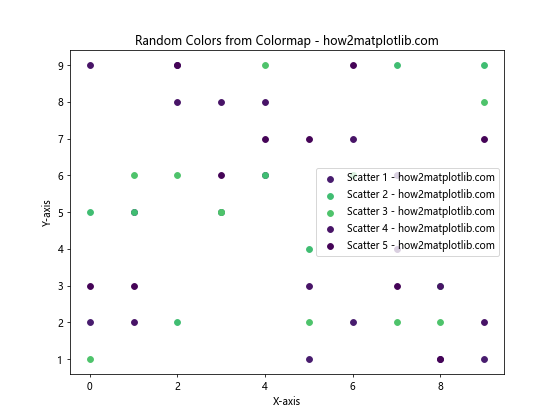
在这个例子中,我们使用了’viridis’颜色映射,但你可以尝试其他映射,如’plasma’、’inferno’或’coolwarm’等。通过从颜色映射中随机选择颜色,我们可以得到更加和谐的色彩方案。
3. 使用HSL颜色空间生成随机颜色
HSL(色相、饱和度、亮度)颜色空间提供了另一种生成随机颜色的方法。通过固定饱和度和亮度,同时随机化色相,我们可以创建出视觉上更加平衡的颜色方案。
import matplotlib.pyplot as plt
import colorsys
import random

def random_hsl_color():
    h = random.random()
    s = 0.5 + random.random() * 0.5  # 50-100% 饱和度
    l = 0.4 + random.random() * 0.2  # 40-60% 亮度
    r, g, b = colorsys.hls_to_rgb(h, l, s)
    return (r, g, b)

# 创建示例图表
plt.figure(figsize=(8, 6))
for i in range(5):
    x = range(10)
    y = [random.randint(1, 10) for _ in range(10)]
    plt.plot(x, y, color=random_hsl_color(), linewidth=2, label=f'Line {i+1} - how2matplotlib.com')

plt.title('Random HSL Colors - how2matplotlib.com')
plt.xlabel('X-axis')
plt.ylabel('Y-axis')
plt.legend()
plt.show()
Output:
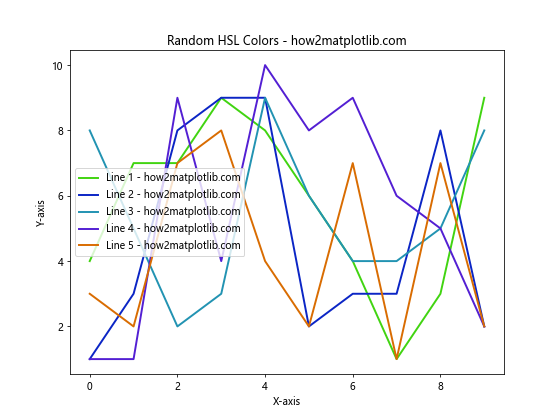
这个示例使用colorsys模块将HSL颜色转换为RGB。通过控制饱和度和亮度的范围,我们可以确保生成的颜色既不会太暗也不会太亮。
4. 使用预定义的颜色列表
有时,我们可能希望从一组预定义的颜色中随机选择,以确保颜色的一致性和可控性。
import matplotlib.pyplot as plt
import random

# 预定义的颜色列表
colors = ['#FF6B6B', '#4ECDC4', '#45B7D1', '#FFA07A', '#98D8C8', '#F7DC6F', '#BB8FCE']

plt.figure(figsize=(8, 6))
for i in range(7):
    x = range(10)
    y = [random.randint(1, 10) for _ in range(10)]
    color = random.choice(colors)
    plt.bar(x, y, color=color, alpha=0.7, label=f'Bar {i+1} - how2matplotlib.com')

plt.title('Random Colors from Predefined List - how2matplotlib.com')
plt.xlabel('X-axis')
plt.ylabel('Y-axis')
plt.legend()
plt.show()
Output:
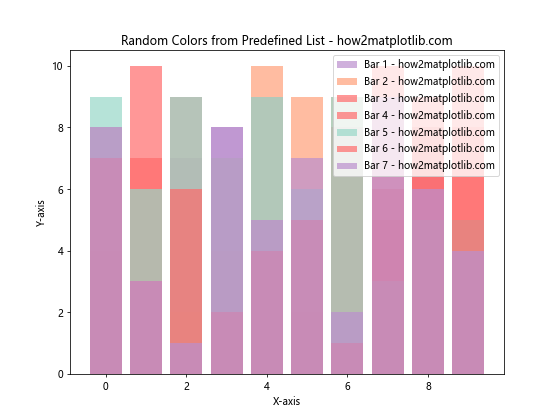
这个方法允许你精确控制可能出现的颜色,同时仍然保持一定的随机性。你可以根据需要自定义颜色列表。
5. 生成互补色
为了创建视觉上更加吸引人的图表,我们可以生成互补色。互补色位于色轮的对面,可以创造出强烈的对比效果。
import matplotlib.pyplot as plt
import colorsys
import random

def complementary_color(rgb):
    h, l, s = colorsys.rgb_to_hls(*rgb)
    return colorsys.hls_to_rgb((h + 0.5) % 1, l, s)

# 生成基础颜色和其互补色
base_color = (random.random(), random.random(), random.random())
comp_color = complementary_color(base_color)

plt.figure(figsize=(8, 6))
x = range(10)
y1 = [random.randint(1, 10) for _ in range(10)]
y2 = [random.randint(1, 10) for _ in range(10)]

plt.plot(x, y1, color=base_color, linewidth=2, label='Base Color - how2matplotlib.com')
plt.plot(x, y2, color=comp_color, linewidth=2, label='Complementary Color - how2matplotlib.com')

plt.title('Complementary Colors - how2matplotlib.com')
plt.xlabel('X-axis')
plt.ylabel('Y-axis')
plt.legend()
plt.show()
Output:
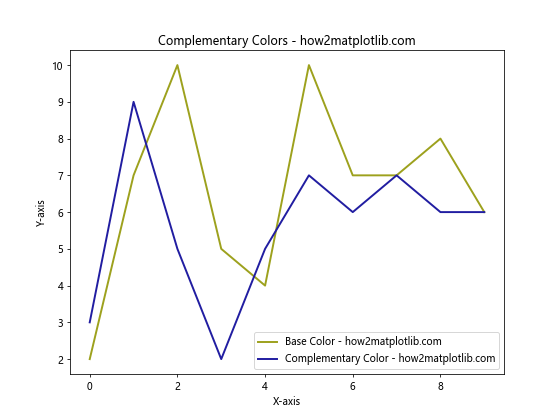
这个示例展示了如何生成一个随机的基础颜色及其互补色,并将它们应用到图表中。这种方法可以创建出视觉上非常吸引人的对比效果。
6. 使用颜色渐变
我们可以创建一个颜色渐变,从一个随机颜色开始,逐渐过渡到另一个颜色。这种方法特别适合表示连续的数据或时间序列。
import matplotlib.pyplot as plt
import numpy as np

# 生成随机起始和结束颜色
start_color = np.random.rand(3)
end_color = np.random.rand(3)

# 创建颜色渐变
n_points = 20
colors = [start_color + (end_color - start_color) * i / (n_points - 1) for i in range(n_points)]

plt.figure(figsize=(10, 6))
for i, color in enumerate(colors):
    plt.scatter([i] * 5, np.random.rand(5) * 10, color=color, s=100)

plt.title('Color Gradient - how2matplotlib.com')
plt.xlabel('X-axis')
plt.ylabel('Y-axis')
plt.show()
Output:
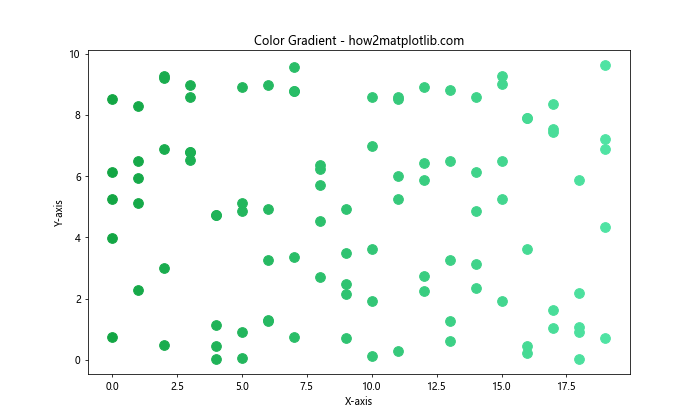
这个示例创建了一个从随机起始颜色到随机结束颜色的渐变。每个数据点使用渐变中的一个颜色,创造出平滑的过渡效果。
7. 使用自定义颜色生成函数
有时,我们可能需要更精细的控制over颜色生成过程。我们可以创建一个自定义函数,根据特定的规则或条件生成颜色。
import matplotlib.pyplot as plt
import random

def custom_color_generator():
    while True:
        r = random.random()
        g = random.random()
        b = random.random()
        # 确保颜色不会太暗或太亮
        if 0.3 < (r + g + b) / 3 < 0.7:
            return (r, g, b)

plt.figure(figsize=(8, 6))
for i in range(10):
    x = range(5)
    y = [random.randint(1, 10) for _ in range(5)]
    color = custom_color_generator()
    plt.plot(x, y, color=color, marker='o', label=f'Series {i+1} - how2matplotlib.com')

plt.title('Custom Color Generator - how2matplotlib.com')
plt.xlabel('X-axis')
plt.ylabel('Y-axis')
plt.legend(bbox_to_anchor=(1.05, 1), loc='upper left')
plt.tight_layout()
plt.show()
Output:
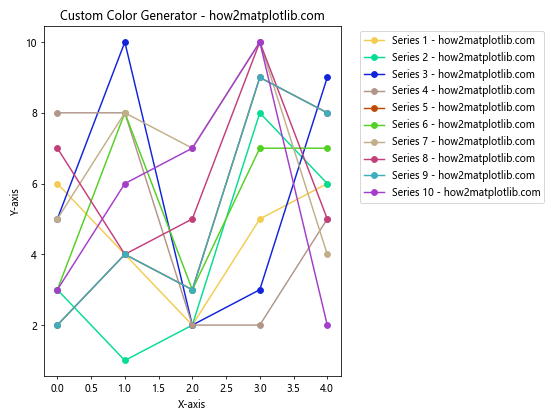
这个自定义函数确保生成的颜色既不会太暗也不会太亮,通过检查RGB值的平均值来实现。你可以根据需要修改这个函数,添加更多的条件或规则。
8. 使用色调循环
色调循环是一种生成一系列相关但可区分颜色的方法。我们可以通过在HSL颜色空间中循环色调值来实现这一点。
import matplotlib.pyplot as plt
import colorsys

def hue_cycle(n):
    hues = [i / n for i in range(n)]
    return [colorsys.hls_to_rgb(h, 0.6, 0.8) for h in hues]

n_colors = 8
colors = hue_cycle(n_colors)

plt.figure(figsize=(10, 6))
for i, color in enumerate(colors):
    plt.bar(i, i+1, color=color, label=f'Bar {i+1} - how2matplotlib.com')

plt.title('Hue Cycle Colors - how2matplotlib.com')
plt.xlabel('X-axis')
plt.ylabel('Y-axis')
plt.legend(bbox_to_anchor=(1.05, 1), loc='upper left')
plt.tight_layout()
plt.show()
Output:
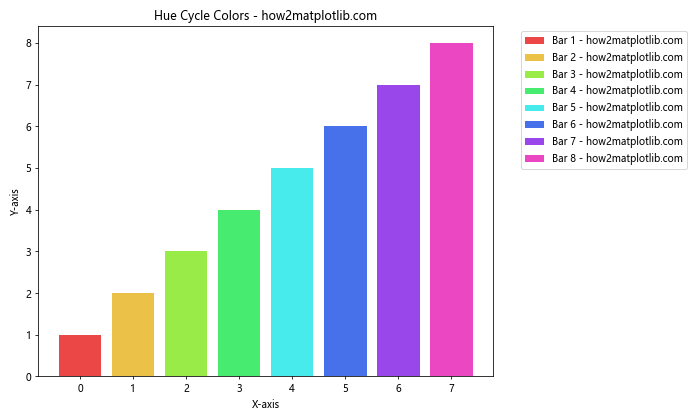
这个示例创建了一个色调循环,生成8种不同的颜色。这种方法特别适合需要多个相关但可区分颜色的情况,如饼图或多系列图表。
9. 使用Seaborn的调色板
Seaborn是基于Matplotlib的统计数据可视化库,它提供了许多优秀的调色板。我们可以利用Seaborn的调色板来为Matplotlib图表生成随机颜色。
import matplotlib.pyplot as plt
import seaborn as sns
import numpy as np

# 使用Seaborn的调色板
palette = sns.color_palette("husl", 10)
colors = [palette[i] for i in np.random.choice(len(palette), 5, replace=False)]

plt.figure(figsize=(8, 6))
for i, color in enumerate(colors):
    x = range(10)
    y = np.random.randint(1, 10, 10)
    plt.plot(x, y, color=color, marker='o', label=f'Series {i+1} - how2matplotlib.com')

plt.title('Random Colors from Seaborn Palette - how2matplotlib.com')
plt.xlabel('X-axis')
plt.ylabel('Y-axis')
plt.legend()
plt.show()
Output:
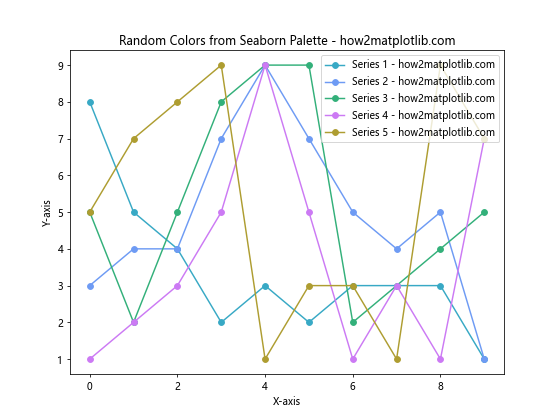
这个示例使用了Seaborn的”husl”调色板,它提供了一组视觉上平衡的颜色。我们从调色板中随机选择颜色,确保不重复使用。
10. 基于数据值生成颜色
有时,我们可能希望颜色反映数据的某些特征。例如,我们可以基于数据点的值来生成颜色,创建一个简单的热图效果。
import matplotlib.pyplot as plt
import numpy as np

def value_based_color(value, vmin, vmax):
    normalized = (value - vmin) / (vmax - vmin)
    return plt.cm.viridis(normalized)

data = np.random.rand(10, 10)
plt.figure(figsize=(8, 6))

for i in range(10):
    for j in range(10):
        color = value_based_color(data[i, j], np.min(data), np.max(data))
        plt.scatter(i, j, color=color, s=100)

plt.title('Value-Based Colors - how2matplotlib.com')
plt.xlabel('X-axis')
plt.ylabel('Y-axis')
plt.colorbar(label='Value')
plt.show()
Output:
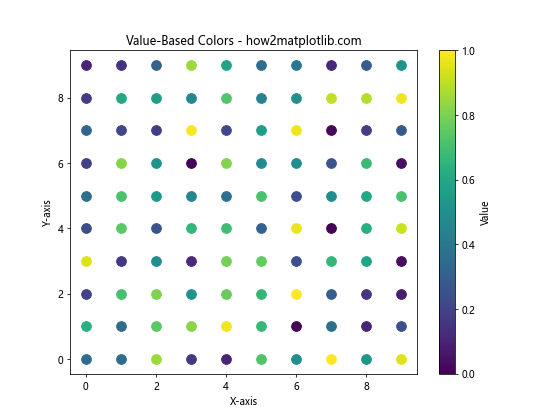
这个示例创建了一个散点图,其中每个点的颜色都基于其数据值。这种方法可以直观地展示数据的分布和强度。
11. 使用颜色名称
Matplotlib支持许多预定义的颜色名称。我们可以从这些名称中随机选择,以获得一组预定义但仍然随机的颜色。
import matplotlib.pyplot as plt
import random

# Matplotlib支持的部分颜色名称
color_names = ['red', 'blue', 'green', 'yellow', 'orange', 'purple', 'pink', 'brown', 'gray', 'cyan']

plt.figure(figsize=(8, 6))
for i in range(5):
    x = range(10)
    y = [random.randint(1, 10) for _ in range(10)]
    color = random.choice(color_names)
    plt.plot(x, y, color=color, label=f'Line {i+1} - {color} - how2matplotlib.com')

plt.title('Random Named Colors - how2matplotlib.com')
plt.xlabel('X-axis')
plt.ylabel('Y-axis')
plt.legend()
plt.show()
Output:
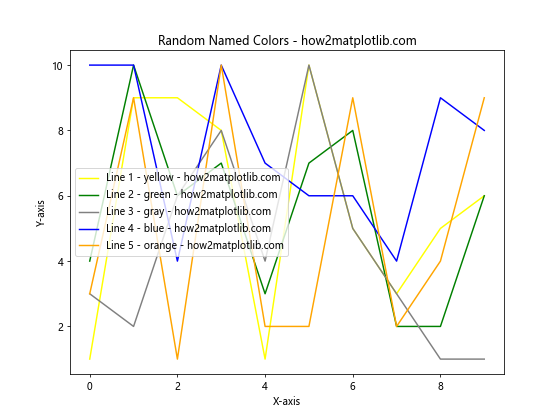
这个示例从预定义的颜色名称列表中随机选择颜色。这种方法简单直观,特别适合需要使用常见颜色名称的场景。
12. 使用颜色轮生成配色方案
颜色轮是一种有用的工具,可以帮助我们生成和谐的配色方案。我们可以使用它来创建互补色、三色组或其他配色方案。
import matplotlib.pyplot as plt
import colorsys

def color_wheel_scheme(base_hue, n=3, scheme='triadic'):
    hues = []
    if scheme == 'triadic':
        hues = [(base_hue + i/3) % 1 for i in range(n)]
    elif scheme == 'tetradic':
        hues = [(base_hue + i/2) % 1 for i in range(n)]
    elif scheme == 'analogous':
        hues = [(base_hue + i/12) % 1 for i in range(n)]
    return [colorsys.hls_to_rgb(h, 0.5, 0.8) for h in hues]

base_hue = random.random()
colors = color_wheel_scheme(base_hue, n=3, scheme='triadic')

plt.figure(figsize=(8, 6))
for i, color in enumerate(colors):
    x = range(10)
    y = [random.randint(1, 10) for _ in range(10)]
    plt.plot(x, y, color=color, linewidth=2, label=f'Line {i+1} - how2matplotlib.com')

plt.title('Color Wheel Scheme (Triadic) - how2matplotlib.com')
plt.xlabel('X-axis')
plt.ylabel('Y-axis')
plt.legend()
plt.show()
这个示例使用颜色轮生成了一个三色配色方案。你可以通过修改scheme参数来尝试不同的配色方案,如四色或类似色方案。
13. 使用黄金比例生成颜色
黄金比例(约0.618)可以用来生成一系列看起来和谐但不重复的颜色。这种方法特别适合需要大量不同颜色的情况。
import matplotlib.pyplot as plt

def golden_ratio_color(h):
    golden_ratio = 0.618033988749895
    return ((h + golden_ratio) % 1, 0.8, 0.95)

plt.figure(figsize=(10, 6))
h = random.random()
for i in range(10):
    h = (h + 0.618033988749895) % 1
    color = plt.cm.hsv(golden_ratio_color(h))
    plt.scatter([i]*5, range(5), c=[color], s=100, label=f'Point {i+1} - how2matplotlib.com')

plt.title('Golden Ratio Colors - how2matplotlib.com')
plt.xlabel('X-axis')
plt.ylabel('Y-axis')
plt.legend(bbox_to_anchor=(1.05, 1), loc='upper left')
plt.tight_layout()
plt.show()
这个示例使用黄金比例来生成一系列颜色。每个新的色相值都是通过将前一个色相值加上黄金比例并取模1得到的。
14. 使用Perlin噪声生成颜色
Perlin噪声是一种可以生成自然看起来的随机性的算法。我们可以使用它来创建平滑过渡的随机颜色。
import matplotlib.pyplot as plt
import numpy as np
from noise import pnoise1

def perlin_color(x, octaves=1, persistence=0.5, lacunarity=2.0):
    r = (pnoise1(x, octaves, persistence, lacunarity) + 1) / 2
    g = (pnoise1(x + 100, octaves, persistence, lacunarity) + 1) / 2
    b = (pnoise1(x + 200, octaves, persistence, lacunarity) + 1) / 2
    return (r, g, b)

plt.figure(figsize=(10, 6))
x = np.linspace(0, 5, 100)
colors = [perlin_color(i) for i in x]

for i in range(len(x) - 1):
    plt.plot(x[i:i+2], [0, 0], color=colors[i], linewidth=5)

plt.title('Perlin Noise Colors - how2matplotlib.com')
plt.xlabel('X-axis')
plt.yticks([])
plt.show()
这个示例使用Perlin噪声生成了一系列平滑过渡的颜色。注意,你可能需要安装noise库(pip install noise)来运行这个示例。
15. 使用时间生成颜色
我们可以基于当前时间来生成颜色,这样可以创建一种动态变化的效果,特别适合实时数据可视化。
import matplotlib.pyplot as plt
import time

def time_based_color():
    t = time.time()
    r = (math.sin(t) + 1) / 2
    g = (math.sin(t + 2*math.pi/3) + 1) / 2
    b = (math.sin(t + 4*math.pi/3) + 1) / 2
    return (r, g, b)

plt.figure(figsize=(8, 6))
for i in range(10):
    color = time_based_color()
    plt.scatter([i], [0], c=[color], s=1000)
    time.sleep(0.5)  # 为了演示效果,添加延迟

plt.title('Time-Based Colors - how2matplotlib.com')
plt.xlabel('X-axis')
plt.yticks([])
plt.show()
这个示例使用正弦函数和当前时间来生成颜色。每次运行时,你会看到不同的颜色序列。
结论
在Matplotlib中生成随机颜色是一个既有趣又实用的技巧。我们探讨了多种方法,从简单的随机RGB值到更复杂的基于算法的颜色生成。这些技术可以帮助你创建更加吸引人和信息丰富的可视化效果。
选择合适的随机颜色生成方法取决于你的具体需求。例如,如果你需要视觉上协调的颜色,可以考虑使用颜色映射或HSL颜色空间。如果你需要大量不同的颜色,黄金比例方法可能是一个好选择。对于需要特定色调或主题的项目,自定义颜色生成函数或预定义的颜色列表可能更合适。
记住,生成随机颜色时,要考虑到可读性和可访问性。确保文本和背景之间有足够的对比度,并考虑色盲用户的需求。你可以使用在线工具来检查你的配色方案是否对色盲友好。
最后,不要忘记实验和创新。结合不同的方法,你可能会发现独特而有效的配色方案,为你的数据可视化项目增添新的维度。随着实践和经验的积累,你将能够更直观地选择和生成适合特定场景的颜色,从而创造出既美观又有效的数据可视化作品。
 极客笔记
极客笔记