如何在Python中导出带透明背景的Matplotlib图表
参考:How to Export Matplotlib Plot with Transparent Background in Python
Matplotlib是Python中最流行的数据可视化库之一,它提供了丰富的绘图功能和灵活的自定义选项。在数据可视化过程中,有时我们需要导出带有透明背景的图表,以便更好地与其他设计元素或背景融合。本文将详细介绍如何在Python中使用Matplotlib创建和导出带透明背景的图表,包括各种图表类型和导出格式的示例。
1. 透明背景的重要性
在数据可视化中,透明背景可以为图表的使用和展示带来多种优势:
- 灵活性:透明背景允许图表轻松地融入各种背景中,无论是网页、幻灯片还是印刷材料。
- 专业外观:透明背景可以使图表看起来更加专业和精致,特别是在需要与其他设计元素结合时。
- 叠加效果:透明背景使得多个图表可以轻松叠加,创造出复杂的可视化效果。
- 文件大小:对于某些格式(如PNG),透明背景可以减小文件大小。
让我们从最基本的示例开始,逐步深入探讨如何创建和导出带透明背景的Matplotlib图表。
2. 基本设置
首先,我们需要了解如何在Matplotlib中设置透明背景。这主要通过设置图形(Figure)对象的facecolor参数来实现。
import matplotlib.pyplot as plt

# 创建一个带有透明背景的图形
fig, ax = plt.subplots(figsize=(8, 6))
fig.patch.set_facecolor('none')  # 设置透明背景

# 绘制一个简单的折线图
x = [1, 2, 3, 4, 5]
y = [2, 4, 1, 5, 3]
ax.plot(x, y, label='How2matplotlib.com')

ax.set_title('Transparent Background Example')
ax.legend()
plt.show()
Output:
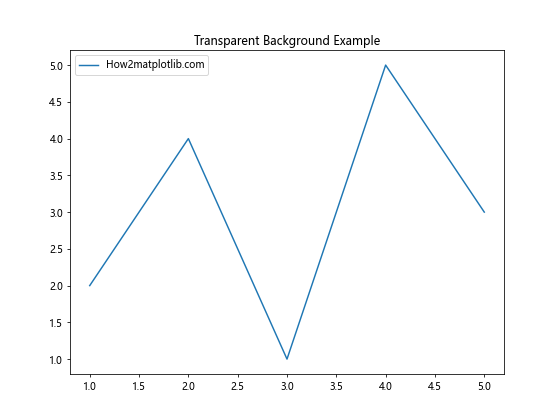
在这个示例中,我们通过fig.patch.set_facecolor('none')设置了透明背景。在保存图表时,我们使用transparent=True参数确保背景透明性被保留。
3. 不同图表类型的透明背景设置
Matplotlib支持多种图表类型,让我们看看如何为不同类型的图表设置透明背景。
3.1 散点图
import matplotlib.pyplot as plt
import numpy as np

fig, ax = plt.subplots(figsize=(8, 6))
fig.patch.set_facecolor('none')

# 生成随机数据
np.random.seed(42)
x = np.random.rand(50)
y = np.random.rand(50)

ax.scatter(x, y, alpha=0.7, s=100, c='blue', label='How2matplotlib.com')
ax.set_title('Scatter Plot with Transparent Background')
ax.legend()
plt.show()
Output:
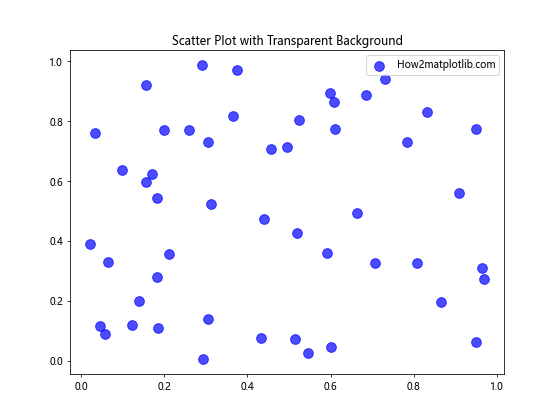
这个示例展示了如何创建一个带有透明背景的散点图。我们使用scatter函数绘制数据点,并通过alpha参数设置点的透明度。
3.2 柱状图
import matplotlib.pyplot as plt

fig, ax = plt.subplots(figsize=(8, 6))
fig.patch.set_facecolor('none')

categories = ['A', 'B', 'C', 'D']
values = [4, 7, 2, 5]

ax.bar(categories, values, color='skyblue', edgecolor='navy', label='How2matplotlib.com')
ax.set_title('Bar Chart with Transparent Background')
ax.legend()
plt.show()
Output:
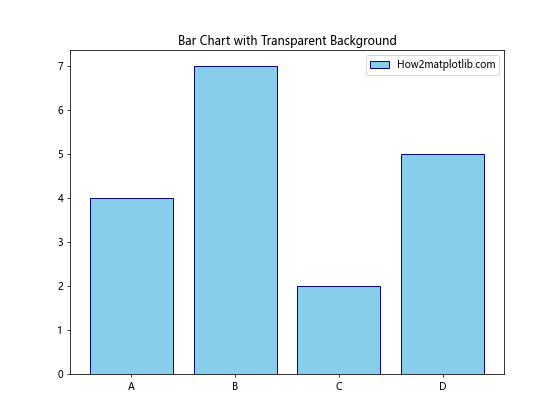
这个例子展示了如何创建一个带有透明背景的柱状图。我们使用bar函数绘制柱状图,并通过设置color和edgecolor来美化图表。
3.3 饼图
import matplotlib.pyplot as plt

fig, ax = plt.subplots(figsize=(8, 6))
fig.patch.set_facecolor('none')

sizes = [30, 25, 20, 15, 10]
labels = ['A', 'B', 'C', 'D', 'E']
colors = ['#ff9999', '#66b3ff', '#99ff99', '#ffcc99', '#ff99cc']

ax.pie(sizes, labels=labels, colors=colors, autopct='%1.1f%%', startangle=90)
ax.set_title('Pie Chart with Transparent Background')
ax.text(0.5, -0.1, 'How2matplotlib.com', ha='center', transform=ax.transAxes)

plt.savefig('transparent_pie.png', bbox_inches='tight', pad_inches=0.1, transparent=True)
这个示例展示了如何创建一个带有透明背景的饼图。我们使用pie函数绘制饼图,并通过colors参数设置不同扇区的颜色。
4. 高级透明度设置
除了设置整个图表的背景透明外,我们还可以对图表的各个元素进行透明度设置,以创造更加精细的视觉效果。
4.1 设置轴和网格的透明度
import matplotlib.pyplot as plt
import numpy as np

fig, ax = plt.subplots(figsize=(8, 6))
fig.patch.set_facecolor('none')

x = np.linspace(0, 10, 100)
y = np.sin(x)

ax.plot(x, y, label='How2matplotlib.com')
ax.set_title('Plot with Transparent Axes and Grid')

# 设置轴的透明度
ax.spines['top'].set_alpha(0.3)
ax.spines['right'].set_alpha(0.3)
ax.spines['bottom'].set_alpha(0.3)
ax.spines['left'].set_alpha(0.3)

# 设置网格的透明度
ax.grid(True, alpha=0.2)

ax.legend()
plt.show()
Output:
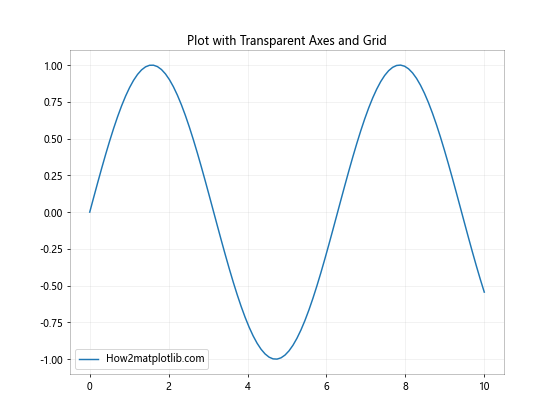
这个示例展示了如何设置轴和网格的透明度。我们通过设置spines的alpha值来调整轴的透明度,并通过grid函数的alpha参数设置网格的透明度。
4.2 设置图例的透明度
import matplotlib.pyplot as plt
import numpy as np

fig, ax = plt.subplots(figsize=(8, 6))
fig.patch.set_facecolor('none')

x = np.linspace(0, 10, 100)
y1 = np.sin(x)
y2 = np.cos(x)

ax.plot(x, y1, label='Sin')
ax.plot(x, y2, label='Cos')
ax.set_title('Plot with Transparent Legend')

# 设置图例的透明度
legend = ax.legend(title='How2matplotlib.com')
legend.get_frame().set_alpha(0.5)
plt.show()
Output:
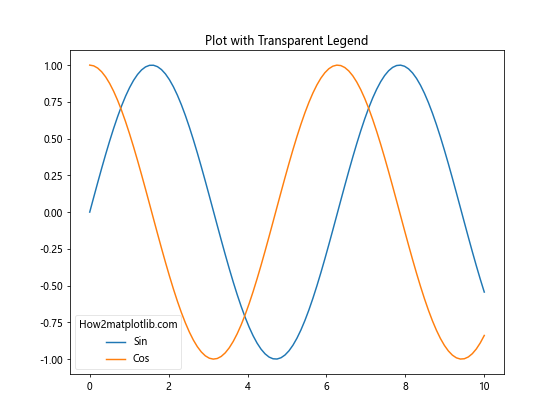
这个示例展示了如何设置图例的透明度。我们通过legend.get_frame().set_alpha()方法来调整图例背景的透明度。
5. 不同文件格式的透明背景导出
Matplotlib支持多种文件格式的导出,但并非所有格式都支持透明背景。让我们探讨一下几种常见格式的透明背景导出方法。
5.1 PNG格式
PNG是最常用的支持透明背景的图像格式之一。
import matplotlib.pyplot as plt
import numpy as np

fig, ax = plt.subplots(figsize=(8, 6))
fig.patch.set_facecolor('none')

x = np.linspace(0, 10, 100)
y = np.sin(x) * np.exp(-x/10)

ax.plot(x, y, label='How2matplotlib.com')
ax.set_title('Exporting to PNG with Transparent Background')
ax.legend()
plt.show()
Output:
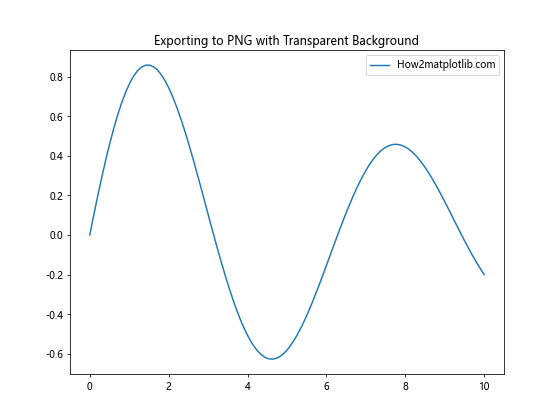
在这个示例中,我们使用savefig函数将图表保存为PNG格式,并设置transparent=True以保持背景透明。dpi参数用于设置图像的分辨率。
5.2 SVG格式
SVG是一种矢量图形格式,天然支持透明背景。
import matplotlib.pyplot as plt
import numpy as np

fig, ax = plt.subplots(figsize=(8, 6))
fig.patch.set_facecolor('none')

x = np.linspace(0, 10, 100)
y = np.cos(x) * np.exp(-x/10)

ax.plot(x, y, label='How2matplotlib.com')
ax.set_title('Exporting to SVG with Transparent Background')
ax.legend()
plt.show()
Output:
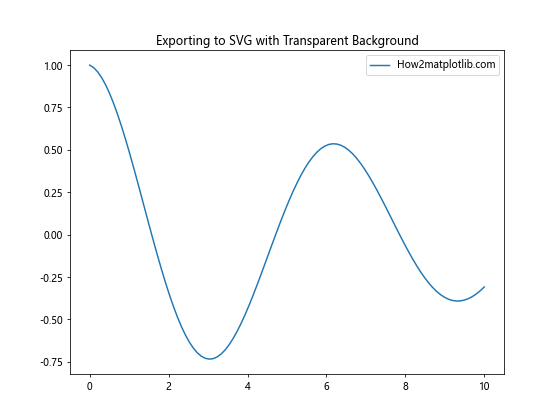
对于SVG格式,我们不需要特别指定transparent=True,因为SVG默认支持透明背景。
5.3 PDF格式
PDF也支持透明背景,但在某些查看器中可能不会正确显示。
import matplotlib.pyplot as plt
import numpy as np

fig, ax = plt.subplots(figsize=(8, 6))
fig.patch.set_facecolor('none')

x = np.linspace(0, 10, 100)
y = np.tan(x) * np.exp(-x/10)

ax.plot(x, y, label='How2matplotlib.com')
ax.set_title('Exporting to PDF with Transparent Background')
ax.legend()
plt.show()
Output:
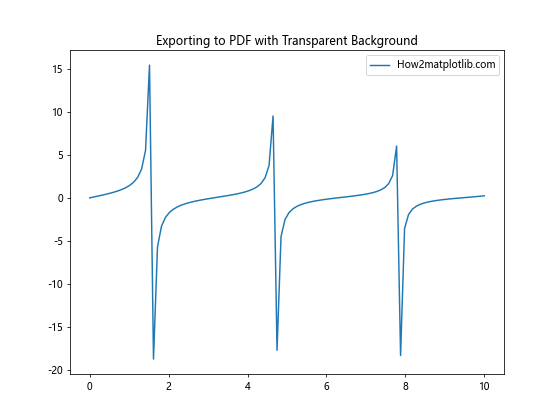
对于PDF格式,我们同样使用transparent=True来保持背景透明。
6. 处理多子图的透明背景
当处理包含多个子图的复杂图表时,设置透明背景需要额外注意。
import matplotlib.pyplot as plt
import numpy as np

fig, axs = plt.subplots(2, 2, figsize=(12, 10))
fig.patch.set_facecolor('none')

x = np.linspace(0, 10, 100)

# 子图1:正弦曲线
axs[0, 0].plot(x, np.sin(x))
axs[0, 0].set_title('Sine')

# 子图2:余弦曲线
axs[0, 1].plot(x, np.cos(x))
axs[0, 1].set_title('Cosine')

# 子图3:正切曲线
axs[1, 0].plot(x, np.tan(x))
axs[1, 0].set_title('Tangent')

# 子图4:散点图
axs[1, 1].scatter(np.random.rand(50), np.random.rand(50))
axs[1, 1].set_title('Scatter')

# 设置整体标题
fig.suptitle('Multiple Subplots with Transparent Background', fontsize=16)

# 添加水印
fig.text(0.5, 0.02, 'How2matplotlib.com', ha='center', va='center', alpha=0.5)

plt.tight_layout()
plt.show()
Output:
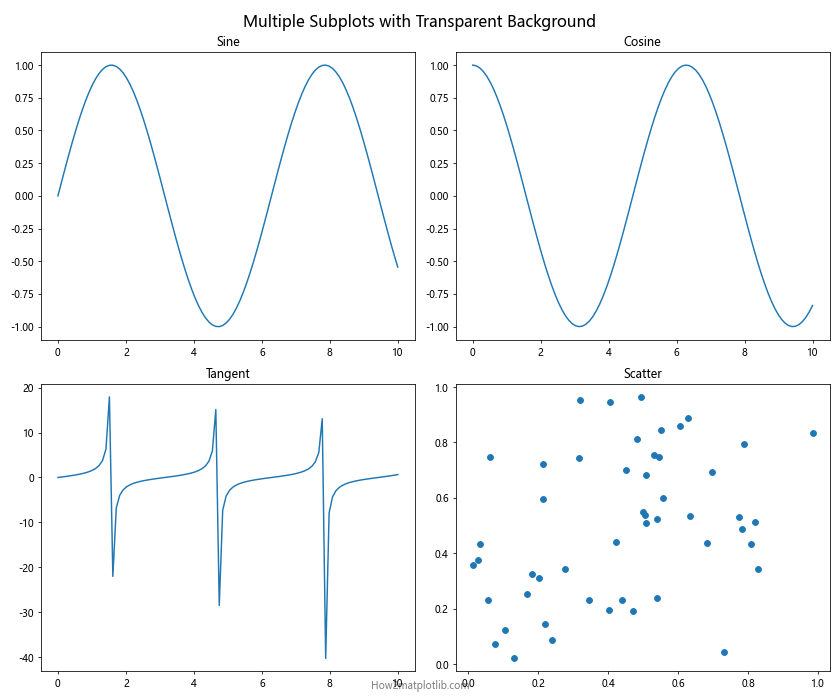
在这个示例中,我们创建了一个2×2的子图网格,每个子图展示不同类型的图表。我们通过fig.patch.set_facecolor('none')设置整个图形的背景为透明,并为每个子图添加了标题。
7. 自定义透明度渐变背景
有时,我们可能想要创建一个透明度渐变的背景,而不是完全透明或完全不透明。这可以通过自定义颜色映射(colormap)来实现。
import matplotlib.pyplot as plt
import numpy as np
from matplotlib.colors import LinearSegmentedColormap

# 创建自定义的透明度渐变颜色映射
colors = [(1, 1, 1, 0), (1, 1, 1, 1)]  # 从完全透明到完全不透明的白色
n_bins = 100  # 颜色的平滑度
cmap = LinearSegmentedColormap.from_list('custom_cmap', colors, N=n_bins)

fig, ax = plt.subplots(figsize=(8, 6))
fig.patch.set_facecolor('none')

x = np.linspace(0, 10, 100)
y = np.sin(x)

# 创建渐变背景
gradient = np.linspace(0, 1, 100).reshape(1, -1)
ax.imshow(gradient, cmap=cmap, aspect='auto', extent=[0, 10, -1.5, 1.5])

ax.plot(x, y, color='red', label='How2matplotlib.com')
ax.set_title('Plot with Gradient Transparent Background')
ax.legend()
plt.show()
Output:
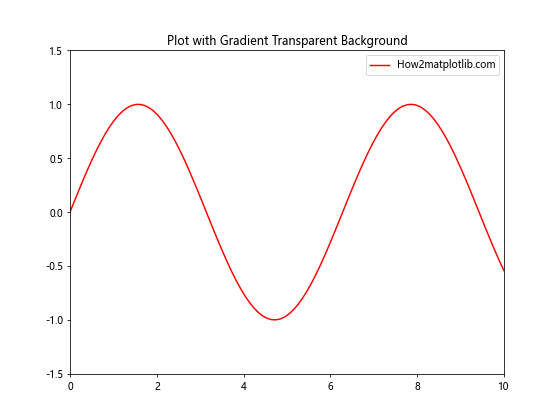
在这个示例中,我们创建了一个从完全透明到完全不透明的白色渐变背景。我们使用LinearSegmentedColormap创建自定义颜色映射,然后使用imshow函数将这个渐变应用到图表背景。
8. 处理图表## 8. 处理图表元素的透明度
在某些情况下,我们可能希望图表的某些元素具有不同程度的透明度,以突出重要信息或创造层次感。
8.1 设置线条透明度
import matplotlib.pyplot as plt
import numpy as np

fig, ax = plt.subplots(figsize=(8, 6))
fig.patch.set_facecolor('none')

x = np.linspace(0, 10, 100)
y1 = np.sin(x)
y2 = np.cos(x)
y3 = np.tan(x)

ax.plot(x, y1, label='Sin', alpha=1.0)
ax.plot(x, y2, label='Cos', alpha=0.7)
ax.plot(x, y3, label='Tan', alpha=0.4)

ax.set_title('Lines with Different Transparency')
ax.legend()
ax.text(5, -1, 'How2matplotlib.com', ha='center', va='center', alpha=0.5)
plt.show()
Output:
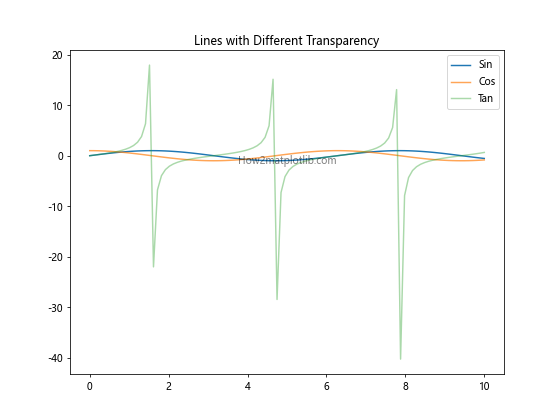
在这个示例中,我们绘制了三条具有不同透明度的线。通过调整alpha参数,我们可以控制每条线的透明度。
8.2 设置填充区域的透明度
import matplotlib.pyplot as plt
import numpy as np

fig, ax = plt.subplots(figsize=(8, 6))
fig.patch.set_facecolor('none')

x = np.linspace(0, 10, 100)
y1 = np.sin(x)
y2 = np.cos(x)

ax.fill_between(x, y1, y2, alpha=0.3, label='Filled Area')
ax.plot(x, y1, label='Sin')
ax.plot(x, y2, label='Cos')

ax.set_title('Filled Area with Transparency')
ax.legend()
ax.text(5, 0, 'How2matplotlib.com', ha='center', va='center', alpha=0.5)
plt.show()
Output:
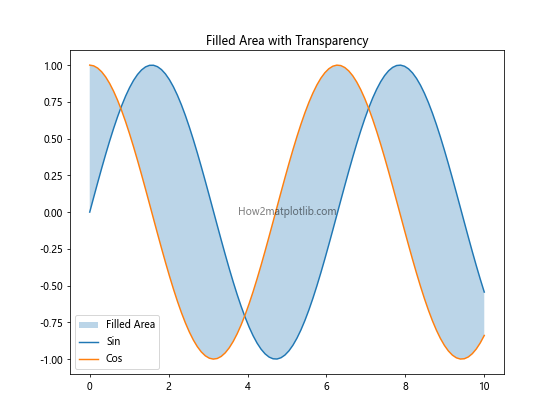
这个示例展示了如何使用fill_between函数创建具有透明度的填充区域。
9. 处理图像叠加
在某些情况下,我们可能需要将Matplotlib图表叠加在其他图像上。这时,透明背景就显得尤为重要。
import matplotlib.pyplot as plt
import numpy as np
from PIL import Image

# 创建Matplotlib图表
fig, ax = plt.subplots(figsize=(8, 6))
fig.patch.set_facecolor('none')

x = np.linspace(0, 10, 100)
y = np.sin(x)

ax.plot(x, y, color='red')
ax.set_title('Matplotlib Plot')
ax.text(5, 0, 'How2matplotlib.com', ha='center', va='center', alpha=0.5)

# 保存Matplotlib图表为PNG,保持透明背景
plt.savefig('plot_overlay.png', bbox_inches='tight', pad_inches=0, transparent=True)

# 打开背景图像
background = Image.open('background.jpg')

# 打开Matplotlib图表
plot = Image.open('plot_overlay.png')

# 将Matplotlib图表叠加到背景图像上
background.paste(plot, (50, 50), plot)
plt.show()
在这个示例中,我们首先创建了一个带有透明背景的Matplotlib图表,然后将其叠加到一个背景图像上。这种技术在创建复杂的数据可视化或信息图表时非常有用。
10. 使用样式和主题
Matplotlib提供了多种预定义的样式和主题,可以快速改变图表的外观。当使用这些样式时,我们仍然可以保持透明背景。
import matplotlib.pyplot as plt
import numpy as np

# 使用'ggplot'样式
plt.style.use('ggplot')

fig, ax = plt.subplots(figsize=(8, 6))
fig.patch.set_facecolor('none')

x = np.linspace(0, 10, 100)
y = np.sin(x) * np.exp(-x/10)

ax.plot(x, y, label='Data')
ax.set_title('Plot with ggplot Style and Transparent Background')
ax.legend()
ax.text(5, 0, 'How2matplotlib.com', ha='center', va='center', alpha=0.5)
plt.show()
Output:
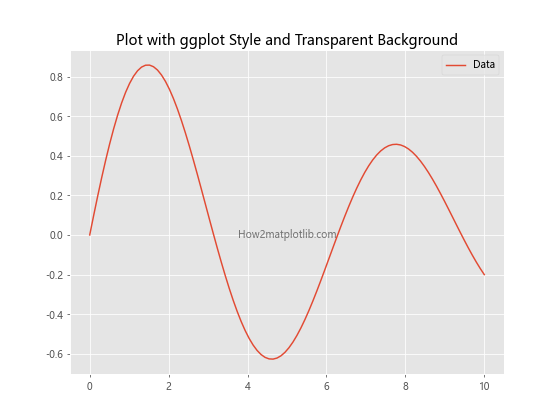
这个示例展示了如何使用’ggplot’样式创建图表,同时保持透明背景。
11. 处理3D图表的透明背景
对于3D图表,设置透明背景需要稍微不同的方法。
import matplotlib.pyplot as plt
import numpy as np
from mpl_toolkits.mplot3d import Axes3D

fig = plt.figure(figsize=(8, 6))
fig.patch.set_facecolor('none')
ax = fig.add_subplot(111, projection='3d')

# 生成数据
x = np.linspace(-5, 5, 100)
y = np.linspace(-5, 5, 100)
X, Y = np.meshgrid(x, y)
Z = np.sin(np.sqrt(X**2 + Y**2))

# 绘制3D表面
surf = ax.plot_surface(X, Y, Z, cmap='viridis')

ax.set_title('3D Surface Plot with Transparent Background')
fig.colorbar(surf)
ax.text2D(0.5, -0.1, 'How2matplotlib.com', ha='center', va='center', transform=ax.transAxes)
plt.show()
Output:
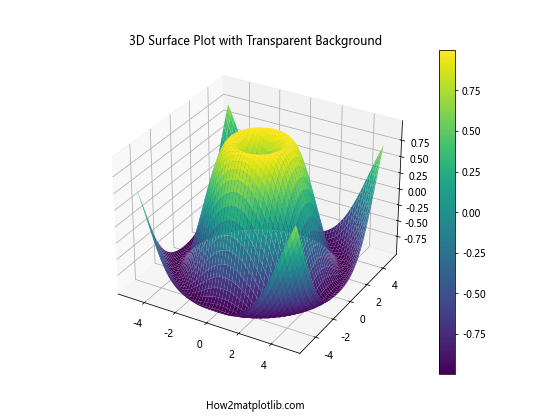
在这个示例中,我们创建了一个3D表面图,并设置了透明背景。注意,对于3D图表,我们使用fig.add_subplot(111, projection='3d')来创建3D轴。
12. 动态图表和动画
即使在创建动态图表或动画时,我们也可以保持透明背景。这在制作GIF或视频时特别有用。
import matplotlib.pyplot as plt
import numpy as np
import matplotlib.animation as animation

fig, ax = plt.subplots(figsize=(8, 6))
fig.patch.set_facecolor('none')

x = np.linspace(0, 2*np.pi, 100)
line, = ax.plot(x, np.sin(x))

def animate(i):
    line.set_ydata(np.sin(x + i/10))
    return line,

ani = animation.FuncAnimation(fig, animate, frames=100, interval=50, blit=True)

ax.set_title('Animated Plot with Transparent Background')
ax.text(np.pi, 0, 'How2matplotlib.com', ha='center', va='center', alpha=0.5)
plt.show()
Output:
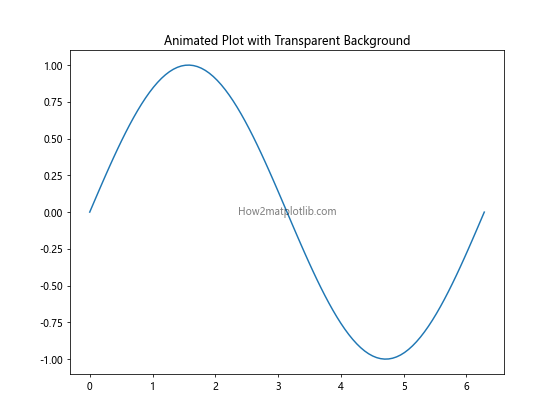
这个示例创建了一个简单的正弦波动画,并将其保存为带有透明背景的GIF文件。
13. 结合其他库
Matplotlib可以与其他数据处理和可视化库结合使用,同时保持透明背景的特性。
13.1 与Pandas结合
import matplotlib.pyplot as plt
import pandas as pd
import numpy as np

# 创建示例数据
dates = pd.date_range('20210101', periods=100)
df = pd.DataFrame(np.random.randn(100, 4), index=dates, columns=list('ABCD'))

fig, ax = plt.subplots(figsize=(10, 6))
fig.patch.set_facecolor('none')

df.plot(ax=ax)

ax.set_title('Pandas DataFrame Plot with Transparent Background')
ax.text(dates[50], 0, 'How2matplotlib.com', ha='center', va='center', alpha=0.5)
plt.show()
Output:
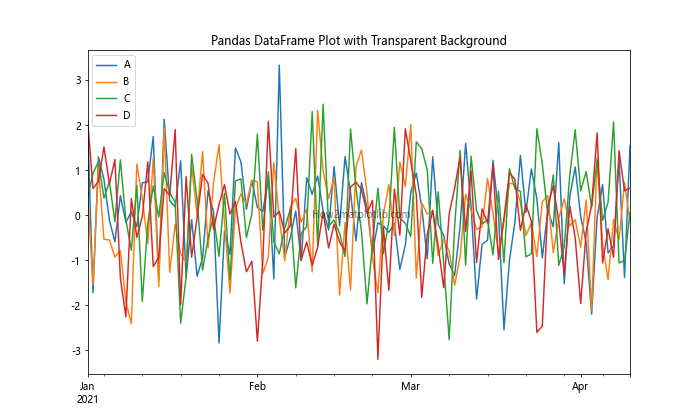
这个示例展示了如何将Pandas DataFrame的数据绘制成图表,并保持透明背景。
13.2 与Seaborn结合
import matplotlib.pyplot as plt
import seaborn as sns

# 设置Seaborn样式
sns.set_style("whitegrid")

fig, ax = plt.subplots(figsize=(8, 6))
fig.patch.set_facecolor('none')

# 使用Seaborn的内置数据集
tips = sns.load_dataset("tips")
sns.scatterplot(x="total_bill", y="tip", hue="time", data=tips, ax=ax)

ax.set_title('Seaborn Scatter Plot with Transparent Background')
ax.text(30, 2, 'How2matplotlib.com', ha='center', va='center', alpha=0.5)
plt.show()
Output:
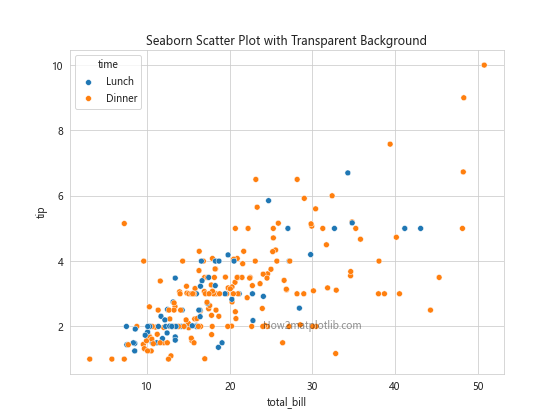
这个示例展示了如何使用Seaborn创建散点图,同时保持透明背景。
14. 总结
在本文中,我们详细探讨了如何在Python中使用Matplotlib创建和导出带有透明背景的图表。我们涵盖了以下主要内容:
- 基本设置:如何为图表设置透明背景。
- 不同图表类型:如何为各种图表类型(如散点图、柱状图、饼图等)设置透明背景。
- 高级透明度设置:如何调整图表各元素的透明度。
- 不同文件格式:如何将透明背景图表导出为PNG、SVG和PDF格式。
- 多子图处理:如何处理包含多个子图的复杂图表的透明背景。
- 自定义透明度渐变:如何创建透明度渐变背景。
- 图表元素透明度:如何设置线条和填充区域的透明度。
- 图像叠加:如何将透明背景的Matplotlib图表叠加到其他图像上。
- 样式和主题:如何在使用预定义样式时保持透明背景。
- 3D图表:如何为3D图表设置透明背景。
- 动态图表和动画:如何在创建动画时保持透明背景。
- 与其他库结合:如何在与Pandas和Seaborn结合使用时保持透明背景。
通过掌握这些技巧,你可以创建出更加专业、灵活的数据可视化作品,使你的图表能够更好地适应各种展示环境和需求。记住,透明背景不仅仅是一个视觉效果,它还能为你的数据可视化带来更多的可能性和创意空间。
最后,建议在实际应用中根据具体需求和场景来选择是否使用透明背景,以及如何调整透明度。合理使用透明背景可以大大提升你的数据可视化作品的质量和专业度。
 极客笔记
极客笔记