如何使用Python的Matplotlib库绘制3D立方体
参考:How to Draw 3D Cube using Matplotlib in Python
Matplotlib是Python中强大的数据可视化库,它不仅可以绘制2D图形,还能创建复杂的3D图形。本文将详细介绍如何使用Matplotlib绘制3D立方体,包括基本立方体、带颜色的立方体、多个立方体、旋转的立方体等多种变体。我们将逐步探讨不同的技术和方法,帮助您掌握3D立方体的绘制技巧。
1. Matplotlib 3D绘图基础
在开始绘制3D立方体之前,我们需要了解Matplotlib中3D绘图的基本概念和设置。
1.1 导入必要的库
首先,我们需要导入Matplotlib库及其3D工具包:
import matplotlib.pyplot as plt
from mpl_toolkits.mplot3d import Axes3D
import numpy as np

print("Welcome to how2matplotlib.com")
1.2 创建3D图形对象
要绘制3D图形,我们需要创建一个包含3D坐标系的图形对象:
fig = plt.figure()
ax = fig.add_subplot(111, projection='3d')

print("3D plotting with how2matplotlib.com")
plt.show()
这段代码创建了一个空白的3D图形。add_subplot(111, projection='3d')指定我们要使用3D投影。
2. 绘制基本的3D立方体
现在,让我们开始绘制最基本的3D立方体。
2.1 定义立方体的顶点
首先,我们需要定义立方体的8个顶点:
import matplotlib.pyplot as plt
from mpl_toolkits.mplot3d import Axes3D

fig = plt.figure()
ax = fig.add_subplot(111, projection='3d')

# 定义立方体的顶点
vertices = [
    [0, 0, 0],
    [1, 0, 0],
    [1, 1, 0],
    [0, 1, 0],
    [0, 0, 1],
    [1, 0, 1],
    [1, 1, 1],
    [0, 1, 1]
]

print("Defining cube vertices for how2matplotlib.com")
plt.show()
Output:

这段代码定义了一个单位立方体的8个顶点坐标。
2.2 绘制立方体的边
接下来,我们需要连接这些顶点来形成立方体的12条边:
import matplotlib.pyplot as plt
from mpl_toolkits.mplot3d import Axes3D

fig = plt.figure()
ax = fig.add_subplot(111, projection='3d')

# 定义立方体的顶点
vertices = [
    [0, 0, 0],
    [1, 0, 0],
    [1, 1, 0],
    [0, 1, 0],
    [0, 0, 1],
    [1, 0, 1],
    [1, 1, 1],
    [0, 1, 1]
]

# 定义立方体的边
edges = [
    [0, 1], [1, 2], [2, 3], [3, 0],  # 底面
    [4, 5], [5, 6], [6, 7], [7, 4],  # 顶面
    [0, 4], [1, 5], [2, 6], [3, 7]   # 连接底面和顶面的边
]

# 绘制边
for edge in edges:
    ax.plot3D(*zip(*[vertices[edge[0]], vertices[edge[1]]]), color="b")

ax.set_xlabel('X axis')
ax.set_ylabel('Y axis')
ax.set_zlabel('Z axis')
ax.set_title('3D Cube - how2matplotlib.com')

plt.show()
Output:
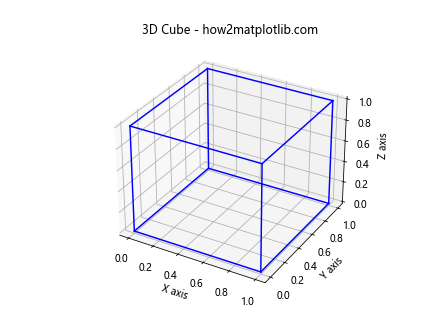
这段代码定义了立方体的12条边,并使用plot3D函数绘制每条边。
3. 添加颜色和样式
现在我们有了基本的立方体,让我们来添加一些颜色和样式,使其更加生动。
3.1 给立方体的面添加颜色
我们可以使用Poly3DCollection来给立方体的面添加颜色:
import matplotlib.pyplot as plt
from mpl_toolkits.mplot3d import Axes3D
from mpl_toolkits.mplot3d.art3d import Poly3DCollection

fig = plt.figure()
ax = fig.add_subplot(111, projection='3d')

# 定义立方体的顶点
vertices = [
    [0, 0, 0],
    [1, 0, 0],
    [1, 1, 0],
    [0, 1, 0],
    [0, 0, 1],
    [1, 0, 1],
    [1, 1, 1],
    [0, 1, 1]
]

# 定义立方体的面
faces = [
    [vertices[0], vertices[1], vertices[2], vertices[3]],
    [vertices[4], vertices[5], vertices[6], vertices[7]],
    [vertices[0], vertices[3], vertices[7], vertices[4]],
    [vertices[1], vertices[2], vertices[6], vertices[5]],
    [vertices[0], vertices[1], vertices[5], vertices[4]],
    [vertices[2], vertices[3], vertices[7], vertices[6]]
]

# 创建多边形集合
poly = Poly3DCollection(faces, alpha=0.8, linewidths=1, edgecolors='r')
poly.set_facecolor(['cyan', 'magenta', 'yellow', 'blue', 'green', 'red'])

# 添加多边形集合到坐标轴
ax.add_collection3d(poly)

ax.set_xlabel('X axis')
ax.set_ylabel('Y axis')
ax.set_zlabel('Z axis')
ax.set_title('Colored 3D Cube - how2matplotlib.com')

plt.show()
Output:
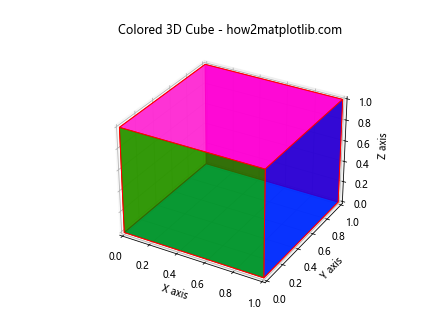
这段代码使用Poly3DCollection创建了立方体的面,并为每个面设置了不同的颜色。
3.2 添加透明度和边框
我们可以通过调整alpha参数来控制立方体的透明度,并通过设置edgecolors来改变边框颜色:
import matplotlib.pyplot as plt
from mpl_toolkits.mplot3d import Axes3D
from mpl_toolkits.mplot3d.art3d import Poly3DCollection

fig = plt.figure()
ax = fig.add_subplot(111, projection='3d')

# 定义立方体的顶点
vertices = [
    [0, 0, 0],
    [1, 0, 0],
    [1, 1, 0],
    [0, 1, 0],
    [0, 0, 1],
    [1, 0, 1],
    [1, 1, 1],
    [0, 1, 1]
]

# 定义立方体的面
faces = [
    [vertices[0], vertices[1], vertices[2], vertices[3]],
    [vertices[4], vertices[5], vertices[6], vertices[7]],
    [vertices[0], vertices[3], vertices[7], vertices[4]],
    [vertices[1], vertices[2], vertices[6], vertices[5]],
    [vertices[0], vertices[1], vertices[5], vertices[4]],
    [vertices[2], vertices[3], vertices[7], vertices[6]]
]

# 创建多边形集合
poly = Poly3DCollection(faces, alpha=0.6, linewidths=2, edgecolors='black')
poly.set_facecolor(['cyan', 'magenta', 'yellow', 'blue', 'green', 'red'])

# 添加多边形集合到坐标轴
ax.add_collection3d(poly)

ax.set_xlabel('X axis')
ax.set_ylabel('Y axis')
ax.set_zlabel('Z axis')
ax.set_title('Transparent 3D Cube - how2matplotlib.com')

plt.show()
Output:
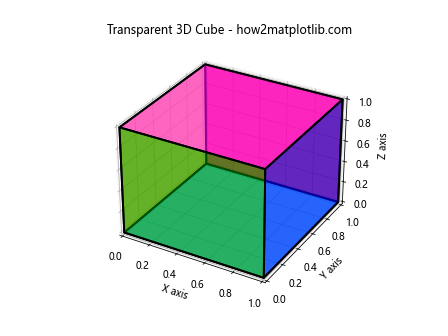
这段代码设置了alpha=0.6来增加透明度,并将边框颜色设置为黑色。
4. 绘制多个立方体
在实际应用中,我们可能需要在同一个图形中绘制多个立方体。让我们来看看如何实现这一点。
4.1 绘制两个不同位置的立方体
import matplotlib.pyplot as plt
from mpl_toolkits.mplot3d import Axes3D
from mpl_toolkits.mplot3d.art3d import Poly3DCollection

fig = plt.figure()
ax = fig.add_subplot(111, projection='3d')

def create_cube(offset):
    vertices = [
        [0+offset, 0+offset, 0+offset],
        [1+offset, 0+offset, 0+offset],
        [1+offset, 1+offset, 0+offset],
        [0+offset, 1+offset, 0+offset],
        [0+offset, 0+offset, 1+offset],
        [1+offset, 0+offset, 1+offset],
        [1+offset, 1+offset, 1+offset],
        [0+offset, 1+offset, 1+offset]
    ]

    faces = [
        [vertices[0], vertices[1], vertices[2], vertices[3]],
        [vertices[4], vertices[5], vertices[6], vertices[7]],
        [vertices[0], vertices[3], vertices[7], vertices[4]],
        [vertices[1], vertices[2], vertices[6], vertices[5]],
        [vertices[0], vertices[1], vertices[5], vertices[4]],
        [vertices[2], vertices[3], vertices[7], vertices[6]]
    ]

    return Poly3DCollection(faces, alpha=0.6, linewidths=1, edgecolors='black')

# 创建两个立方体
cube1 = create_cube(0)
cube2 = create_cube(1.5)

# 设置颜色
cube1.set_facecolor('cyan')
cube2.set_facecolor('magenta')

# 添加立方体到图形
ax.add_collection3d(cube1)
ax.add_collection3d(cube2)

ax.set_xlim(0, 3)
ax.set_ylim(0, 3)
ax.set_zlim(0, 3)

ax.set_xlabel('X axis')
ax.set_ylabel('Y axis')
ax.set_zlabel('Z axis')
ax.set_title('Multiple 3D Cubes - how2matplotlib.com')

plt.show()
Output:
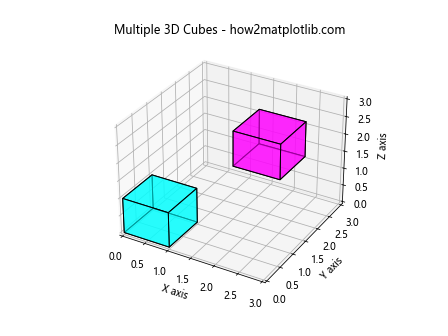
这段代码定义了一个create_cube函数来生成立方体,然后创建了两个位置不同的立方体并添加到图形中。
4.2 绘制不同大小的立方体
我们还可以绘制不同大小的立方体:
import matplotlib.pyplot as plt
from mpl_toolkits.mplot3d import Axes3D
from mpl_toolkits.mplot3d.art3d import Poly3DCollection

fig = plt.figure()
ax = fig.add_subplot(111, projection='3d')

def create_cube(offset, size):
    vertices = [
        [0+offset, 0+offset, 0+offset],
        [size+offset, 0+offset, 0+offset],
        [size+offset, size+offset, 0+offset],
        [0+offset, size+offset, 0+offset],
        [0+offset, 0+offset, size+offset],
        [size+offset, 0+offset, size+offset],
        [size+offset, size+offset, size+offset],
        [0+offset, size+offset, size+offset]
    ]

    faces = [
        [vertices[0], vertices[1], vertices[2], vertices[3]],
        [vertices[4], vertices[5], vertices[6], vertices[7]],
        [vertices[0], vertices[3], vertices[7], vertices[4]],
        [vertices[1], vertices[2], vertices[6], vertices[5]],
        [vertices[0], vertices[1], vertices[5], vertices[4]],
        [vertices[2], vertices[3], vertices[7], vertices[6]]
    ]

    return Poly3DCollection(faces, alpha=0.6, linewidths=1, edgecolors='black')

# 创建三个不同大小的立方体
cube1 = create_cube(0, 1)
cube2 = create_cube(1.5, 0.8)
cube3 = create_cube(2.5, 0.5)

# 设置颜色
cube1.set_facecolor('cyan')
cube2.set_facecolor('magenta')
cube3.set_facecolor('yellow')

# 添加立方体到图形
ax.add_collection3d(cube1)
ax.add_collection3d(cube2)
ax.add_collection3d(cube3)

ax.set_xlim(0, 3.5)
ax.set_ylim(0, 3.5)
ax.set_zlim(0, 3.5)

ax.set_xlabel('X axis')
ax.set_ylabel('Y axis')
ax.set_zlabel('Z axis')
ax.set_title('Multiple 3D Cubes with Different Sizes - how2matplotlib.com')

plt.show()
Output:
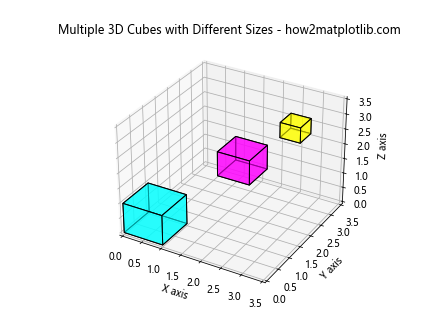
这段代码创建了三个不同大小和位置的立方体,展示了如何在同一个图形中绘制多个不同属性的立方体。
5. 添加动画效果
为了使我们的3D立方体更加生动,我们可以添加一些动画效果。Matplotlib提供了动画功能,让我们可以创建旋转的立方体。
5.1 创建旋转的立方体
import matplotlib.pyplot as plt
from mpl_toolkits.mplot3d import Axes3D
from mpl_toolkits.mplot3d.art3d import Poly3DCollection
import numpy as np
from matplotlib.animation import FuncAnimation

fig = plt.figure()
ax = fig.add_subplot(111, projection='3d')

vertices = np.array([
    [-1, -1, -1],
    [1, -1, -1],
    [1, 1, -1],
    [-1, 1, -1],
    [-1, -1,1],
    [1, -1, 1],
    [1, 1, 1],
    [-1, 1, 1]
])

faces = [
    [vertices[0], vertices[1], vertices[2], vertices[3]],
    [vertices[4], vertices[5], vertices[6], vertices[7]],
    [vertices[0], vertices[3], vertices[7], vertices[4]],
    [vertices[1], vertices[2], vertices[6], vertices[5]],
    [vertices[0], vertices[1], vertices[5], vertices[4]],
    [vertices[2], vertices[3], vertices[7], vertices[6]]
]

def rotate_cube(angle):
    rotation_matrix = np.array([
        [np.cos(angle), -np.sin(angle), 0],
        [np.sin(angle), np.cos(angle), 0],
        [0, 0, 1]
    ])
    rotated_vertices = np.dot(vertices, rotation_matrix)
    rotated_faces = [
        [rotated_vertices[0], rotated_vertices[1], rotated_vertices[2], rotated_vertices[3]],
        [rotated_vertices[4], rotated_vertices[5], rotated_vertices[6], rotated_vertices[7]],
        [rotated_vertices[0], rotated_vertices[3], rotated_vertices[7], rotated_vertices[4]],
        [rotated_vertices[1], rotated_vertices[2], rotated_vertices[6], rotated_vertices[5]],
        [rotated_vertices[0], rotated_vertices[1], rotated_vertices[5], rotated_vertices[4]],
        [rotated_vertices[2], rotated_vertices[3], rotated_vertices[7], rotated_vertices[6]]
    ]
    return rotated_faces

def update(frame):
    ax.clear()
    rotated_faces = rotate_cube(frame * np.pi / 180)
    cube = Poly3DCollection(rotated_faces, alpha=0.8, linewidths=1, edgecolors='black')
    cube.set_facecolor(['cyan', 'magenta', 'yellow', 'blue', 'green', 'red'])
    ax.add_collection3d(cube)
    ax.set_xlim(-2, 2)
    ax.set_ylim(-2, 2)
    ax.set_zlim(-2, 2)
    ax.set_title(f'Rotating 3D Cube - how2matplotlib.com (Angle: {frame}°)')

ani = FuncAnimation(fig, update, frames=range(0, 360, 2), interval=50)

plt.show()
Output:
这段代码创建了一个旋转的3D立方体动画。我们定义了一个rotate_cube函数来旋转立方体的顶点,然后使用FuncAnimation来创建动画效果。每一帧,立方体都会旋转一定角度。
5.2 创建多个旋转的立方体
我们还可以创建多个同时旋转的立方体,每个立方体具有不同的旋转速度和颜色:
import matplotlib.pyplot as plt
from mpl_toolkits.mplot3d import Axes3D
from mpl_toolkits.mplot3d.art3d import Poly3DCollection
import numpy as np
from matplotlib.animation import FuncAnimation

fig = plt.figure(figsize=(10, 8))
ax = fig.add_subplot(111, projection='3d')

def create_cube(size):
    vertices = np.array([
        [-1, -1, -1],
        [1, -1, -1],
        [1, 1, -1],
        [-1, 1, -1],
        [-1, -1, 1],
        [1, -1, 1],
        [1, 1, 1],
        [-1, 1, 1]
    ]) * size
    return vertices

def rotate_cube(vertices, angle_x, angle_y, angle_z):
    rotation_x = np.array([
        [1, 0, 0],
        [0, np.cos(angle_x), -np.sin(angle_x)],
        [0, np.sin(angle_x), np.cos(angle_x)]
    ])
    rotation_y = np.array([
        [np.cos(angle_y), 0, np.sin(angle_y)],
        [0, 1, 0],
        [-np.sin(angle_y), 0, np.cos(angle_y)]
    ])
    rotation_z = np.array([
        [np.cos(angle_z), -np.sin(angle_z), 0],
        [np.sin(angle_z), np.cos(angle_z), 0],
        [0, 0, 1]
    ])
    rotation_matrix = np.dot(rotation_z, np.dot(rotation_y, rotation_x))
    return np.dot(vertices, rotation_matrix)

def update(frame):
    ax.clear()
    for i, (cube, color, speed) in enumerate(cubes):
        rotated_vertices = rotate_cube(cube, frame * speed[0], frame * speed[1], frame * speed[2])
        faces = [
            [rotated_vertices[0], rotated_vertices[1], rotated_vertices[2], rotated_vertices[3]],
            [rotated_vertices[4], rotated_vertices[5], rotated_vertices[6], rotated_vertices[7]],
            [rotated_vertices[0], rotated_vertices[3], rotated_vertices[7], rotated_vertices[4]],
            [rotated_vertices[1], rotated_vertices[2], rotated_vertices[6], rotated_vertices[5]],
            [rotated_vertices[0], rotated_vertices[1], rotated_vertices[5], rotated_vertices[4]],
            [rotated_vertices[2], rotated_vertices[3], rotated_vertices[7], rotated_vertices[6]]
        ]
        cube_poly = Poly3DCollection(faces, alpha=0.8, linewidths=1, edgecolors='black')
        cube_poly.set_facecolor(color)
        ax.add_collection3d(cube_poly)

    ax.set_xlim(-3, 3)
    ax.set_ylim(-3, 3)
    ax.set_zlim(-3, 3)
    ax.set_title(f'Multiple Rotating 3D Cubes - how2matplotlib.com (Frame: {frame})')

# 创建多个立方体
cubes = [
    (create_cube(0.8), 'red', (0.02, 0.03, 0.01)),
    (create_cube(1.0), 'blue', (0.01, 0.02, 0.03)),
    (create_cube(1.2), 'green', (0.03, 0.01, 0.02))
]

ani = FuncAnimation(fig, update, frames=range(0, 360), interval=50)

plt.show()
Output:
这段代码创建了三个不同大小、颜色和旋转速度的立方体,并将它们同时展示在一个动画中。每个立方体都有自己的旋转速度和方向。
6. 高级技巧
在掌握了基本的3D立方体绘制技巧后,我们可以尝试一些更高级的技巧来增强我们的可视化效果。
6.1 添加纹理到立方体表面
我们可以给立方体的表面添加纹理,使其看起来更加真实:
import matplotlib.pyplot as plt
from mpl_toolkits.mplot3d import Axes3D
import numpy as np

fig = plt.figure()
ax = fig.add_subplot(111, projection='3d')

# 创建立方体的顶点
r = [0, 1]
X, Y = np.meshgrid(r, r)
one = np.ones(4).reshape(2, 2)
zero = np.zeros(4).reshape(2, 2)

# 定义六个面
x = [X, X, X*0+1, X*0, X, X]
y = [Y*0, Y*0+1, Y, Y, Y, Y]
z = [zero, zero, zero, zero, one, one]

# 创建纹理图案
texture = np.array([
    [0, 1, 0, 1],
    [1, 0, 1, 0],
    [0, 1, 0, 1],
    [1, 0, 1, 0]
])

# 绘制立方体的每个面
for i in range(6):
    ax.plot_surface(x[i], y[i], z[i], facecolors=plt.cm.binary(texture), shade=False)

ax.set_xlabel('X axis')
ax.set_ylabel('Y axis')
ax.set_zlabel('Z axis')
ax.set_title('3D Cube with Texture - how2matplotlib.com')

plt.show()
Output:
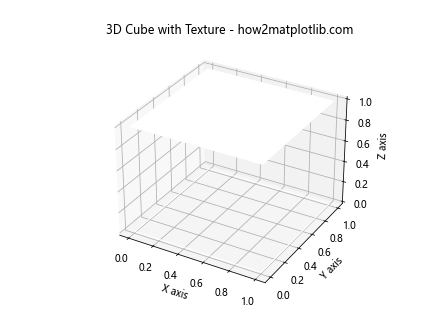
这段代码使用plot_surface函数来绘制立方体的每个面,并使用一个简单的黑白纹理图案来装饰表面。
6.2 创建透明效果
我们可以通过调整透明度来创建一个半透明的立方体,让内部结构可见:
import matplotlib.pyplot as plt
from mpl_toolkits.mplot3d import Axes3D
from mpl_toolkits.mplot3d.art3d import Poly3DCollection
import numpy as np

fig = plt.figure()
ax = fig.add_subplot(111, projection='3d')

# 定义立方体的顶点
vertices = np.array([
    [0, 0, 0],
    [1, 0, 0],
    [1, 1, 0],
    [0, 1, 0],
    [0, 0, 1],
    [1, 0, 1],
    [1, 1, 1],
    [0, 1, 1]
])

# 定义立方体的面
faces = [
    [vertices[0], vertices[1], vertices[2], vertices[3]],
    [vertices[4], vertices[5], vertices[6], vertices[7]],
    [vertices[0], vertices[3], vertices[7], vertices[4]],
    [vertices[1], vertices[2], vertices[6], vertices[5]],
    [vertices[0], vertices[1], vertices[5], vertices[4]],
    [vertices[2], vertices[3], vertices[7], vertices[6]]
]

# 创建透明的立方体
cube = Poly3DCollection(faces, alpha=0.3, linewidths=1, edgecolors='black')
cube.set_facecolor(['cyan', 'magenta', 'yellow', 'blue', 'green', 'red'])
ax.add_collection3d(cube)

# 添加顶点标记
for vertex in vertices:
    ax.scatter(*vertex, color='red', s=50)

# 添加边
for i, j in [(0, 1), (1, 2), (2, 3), (3, 0), (4, 5), (5, 6), (6, 7), (7, 4), (0, 4), (1, 5), (2, 6), (3, 7)]:
    ax.plot(*zip(vertices[i], vertices[j]), color='black')

ax.set_xlabel('X axis')
ax.set_ylabel('Y axis')
ax.set_zlabel('Z axis')
ax.set_title('Transparent 3D Cube with Vertices and Edges - how2matplotlib.com')

plt.show()
Output:
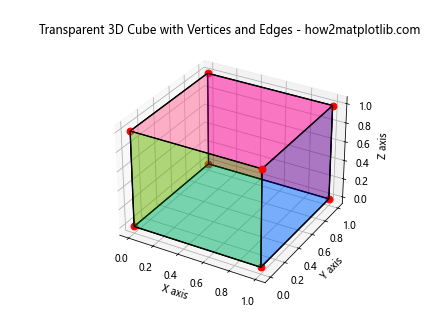
这段代码创建了一个半透明的立方体,同时显示了顶点和边,让我们可以清楚地看到立方体的内部结构。
7. 结合其他图形元素
3D立方体可以与其他图形元素结合,创造出更复杂和有趣的可视化效果。
7.1 在立方体内添加散点图
我们可以在立方体内部添加一些随机点,创建一个数据可视化效果:
import matplotlib.pyplot as plt
from mpl_toolkits.mplot3d import Axes3D
from mpl_toolkits.mplot3d.art3d import Poly3DCollection
import numpy as np

fig = plt.figure(figsize=(10, 8))
ax = fig.add_subplot(111, projection='3d')

# 定义立方体的顶点
vertices = np.array([
    [0, 0, 0],
    [1, 0, 0],
    [1, 1, 0],
    [0, 1, 0],
    [0, 0, 1],
    [1, 0, 1],
    [1, 1, 1],
    [0, 1, 1]
])

# 定义立方体的面
faces = [
    [vertices[0], vertices[1], vertices[2], vertices[3]],
    [vertices[4], vertices[5], vertices[6], vertices[7]],
    [vertices[0], vertices[3], vertices[7], vertices[4]],
    [vertices[1], vertices[2], vertices[6], vertices[5]],
    [vertices[0], vertices[1], vertices[5], vertices[4]],
    [vertices[2], vertices[3], vertices[7], vertices[6]]
]

# 创建半透明的立方体
cube = Poly3DCollection(faces, alpha=0.3, linewidths=1, edgecolors='black')
cube.set_facecolor('cyan')
ax.add_collection3d(cube)

# 生成随机点
n_points = 100
x = np.random.rand(n_points)
y = np.random.rand(n_points)
z = np.random.rand(n_points)
colors = np.random.rand(n_points)

# 绘制散点图
scatter = ax.scatter(x, y, z, c=colors, cmap='viridis', s=30)

ax.set_xlabel('X axis')
ax.set_ylabel('Y axis')
ax.set_zlabel('Z axis')
ax.set_title('3D Cube with Scatter Plot - how2matplotlib.com')

# 添加颜色条
plt.colorbar(scatter)

plt.show()
Output:
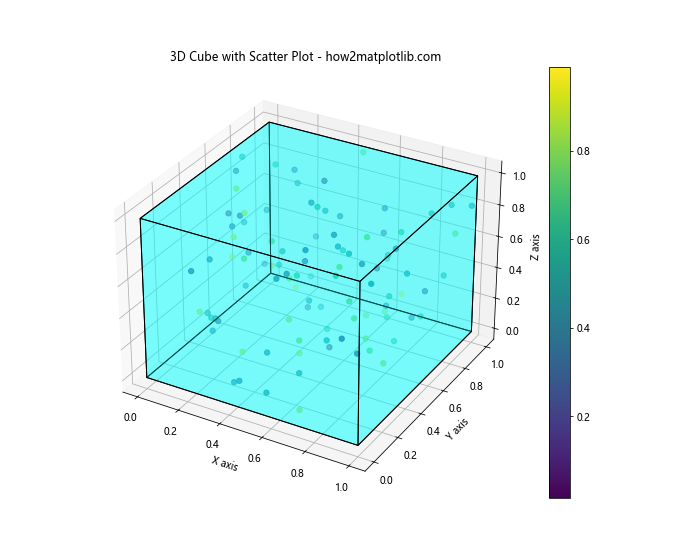
这段代码在半透明的立方体内部添加了一个彩色的散点图,展示了如何将3D立方体与其他数据可视化技术结合。
7.2 在立方体表面绘制等高线
我们可以在立方体的表面绘制等高线,创造出一种独特的视觉效果:
import matplotlib.pyplot as plt
from mpl_toolkits.mplot3d import Axes3D
import numpy as np

fig = plt.figure(figsize=(10, 8))
ax = fig.add_subplot(111, projection='3d')

# 创建立方体的顶点
r = [0, 1]
X, Y = np.meshgrid(r, r)
one = np.ones(4).reshape(2, 2)
zero = np.zeros(4).reshape(2, 2)

# 定义六个面
x = [X, X, X*0+1, X*0, X, X]
y = [Y*0, Y*0+1, Y, Y, Y, Y]
z = [zero, zero, zero, zero, one, one]

# 创建等高线数据
def f(x, y):
    return np.sin(np.pi * x) * np.cos(np.pi * y)

x_fine = np.linspace(0, 1, 50)
y_fine = np.linspace(0, 1, 50)
X_fine, Y_fine = np.meshgrid(x_fine, y_fine)

# 绘制立方体的每个面
for i in range(6):
    if i < 4:  # 侧面
        Z = f(X_fine, Y_fine)
    else:  # 顶面和底面
        Z = f(X_fine, Y_fine) * 0

    ax.plot_surface(x[i], y[i], z[i], facecolors=plt.cm.viridis(Z), shade=False)
    ax.contour(x[i], y[i], z[i], Z, zdir='z', offset=z[i][0][0], cmap='viridis')

ax.set_xlabel('X axis')
ax.set_ylabel('Y axis')
ax.set_zlabel('Z axis')
ax.set_title('3D Cube with Contour Lines - how2matplotlib.com')

plt.show()
这段代码在立方体的每个面上绘制了等高线,创造出一种独特的视觉效果。我们使用了一个简单的正弦余弦函数来生成等高线数据。
8. 优化和性能考虑
在处理复杂的3D图形时,性能可能会成为一个问题。以下是一些优化建议:
8.1 使用面而不是线条
当绘制大量立方体时,使用面(如Poly3DCollection)而不是单独的线条可以显著提高性能:
import matplotlib.pyplot as plt
from mpl_toolkits.mplot3d import Axes3D
from mpl_toolkits.mplot3d.art3d import Poly3DCollection
import numpy as np

fig = plt.figure(figsize=(10, 8))
ax = fig.add_subplot(111, projection='3d')

def create_cube(center, size):
    vertices = np.array([
        [-1, -1, -1],
        [1, -1, -1],
        [1, 1, -1],
        [-1, 1, -1],
        [-1, -1, 1],
        [1, -1, 1],
        [1, 1, 1],
        [-1, 1, 1]
    ]) * size / 2 + center

    faces = [
        [vertices[0], vertices[1], vertices[2], vertices[3]],
        [vertices[4], vertices[5], vertices[6], vertices[7]],
        [vertices[0], vertices[3], vertices[7], vertices[4]],
        [vertices[1], vertices[2], vertices[6], vertices[5]],
        [vertices[0], vertices[1], vertices[5], vertices[4]],
        [vertices[2], vertices[3], vertices[7], vertices[6]]
    ]

    return Poly3DCollection(faces, alpha=0.5, linewidths=1, edgecolors='black')

# 创建多个立方体
n_cubes = 50
for _ in range(n_cubes):
    center = np.random.rand(3) * 10
    size = np.random.rand() + 0.5
    cube = create_cube(center, size)
    cube.set_facecolor(np.random.rand(3))
    ax.add_collection3d(cube)

ax.set_xlim(0, 10)
ax.set_ylim(0, 10)
ax.set_zlim(0, 10)

ax.set_xlabel('X axis')
ax.set_ylabel('Y axis')
ax.set_zlabel('Z axis')
ax.set_title(f'Multiple 3D Cubes ({n_cubes}) - how2matplotlib.com')

plt.show()
Output:
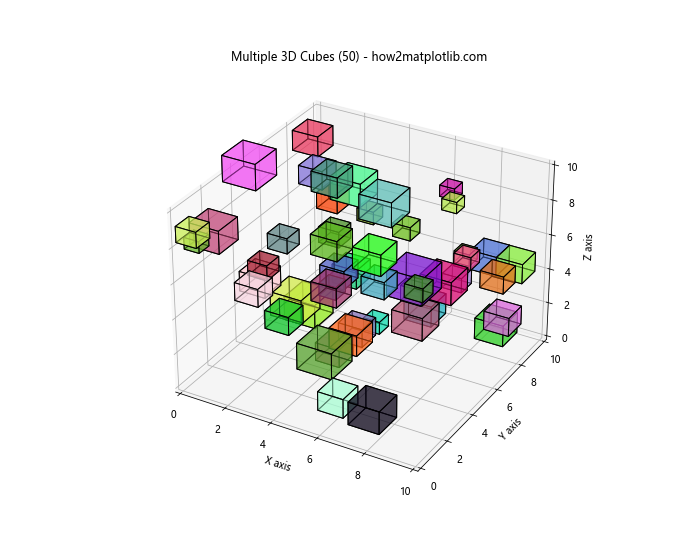
这段代码高效地创建和渲染了多个3D立方体,使用Poly3DCollection来提高性能。
8.2 减少细节级别
对于复杂的场景,可以考虑减少细节级别来提高性能:
import matplotlib.pyplot as plt
from mpl_toolkits.mplot3d import Axes3D
import numpy as np

fig = plt.figure(figsize=(10, 8))
ax = fig.add_subplot(111, projection='3d')

# 创建一个复杂的3D表面
x = np.linspace(-5, 5, 50)
y = np.linspace(-5, 5, 50)
X, Y = np.meshgrid(x, y)
Z = np.sin(np.sqrt(X**2 + Y**2))

# 绘制表面
surf = ax.plot_surface(X, Y, Z, cmap='viridis', linewidth=0, antialiased=False, rcount=20, ccount=20)

# 添加一个简化的立方体框架
cube_edges = [
    [(-5, -5, -1), (5, -5, -1)],
    [(-5, 5, -1), (5, 5, -1)],
    [(-5, -5, 1), (5, -5, 1)],
    [(-5, 5, 1), (5, 5, 1)],
    [(-5, -5, -1), (-5, 5, -1)],
    [(5, -5, -1), (5, 5, -1)],
    [(-5, -5, 1), (-5, 5, 1)],
    [(5, -5, 1), (5, 5, 1)],
    [(-5, -5, -1), (-5, -5, 1)],
    [(5, -5, -1), (5, -5, 1)],
    [(-5, 5, -1), (-5, 5, 1)],
    [(5, 5, -1), (5, 5, 1)]
]

for edge in cube_edges:
    ax.plot3D(*zip(*edge), color='red')

ax.set_xlabel('X axis')
ax.set_ylabel('Y axis')
ax.set_zlabel('Z axis')
ax.set_title('Complex 3D Surface with Simplified Cube Frame - how2matplotlib.com')

plt.show()
Output:
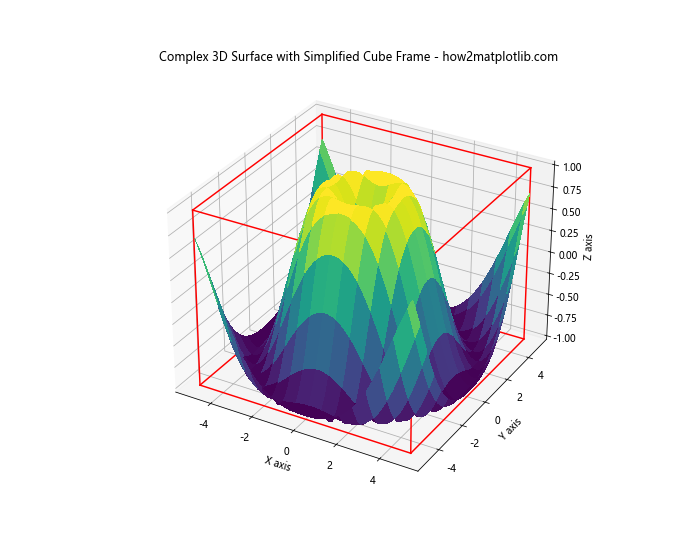
这段代码展示了如何在绘制复杂3D表面的同时,使用简化的立方体框架来提高性能。
9. 结论
通过本文,我们详细探讨了如何使用Python的Matplotlib库绘制3D立方体。从基本的立方体绘制到添加颜色、透明度,再到创建动画效果和结合其他图形元素,我们涵盖了广泛的技术和方法。这些技巧不仅可以用于创建引人注目的可视化效果,还可以应用于各种数据可视化和科学计算场景。
记住,3D可视化虽然强大,但也需要谨慎使用。在某些情况下,简单的2D图表可能更有效地传达信息。选择正确的可视化方法取决于你的数据和目标受众。
最后,继续探索Matplotlib的其他功能,结合其他Python库如NumPy和Pandas,你将能够创建更加复杂和有意义的数据可视化。希望这篇文章能够帮助你掌握3D立方体绘制的技巧,并在你的项目中创造出令人印象深刻的可视化效果。
 极客笔记
极客笔记