Matplotlib中创建不同大小子图的全面指南
参考:How to Create Different Subplot Sizes in Matplotlib
Matplotlib是Python中最流行的数据可视化库之一,它提供了强大而灵活的工具来创建各种类型的图表。在数据分析和科学研究中,我们经常需要在同一个图形中展示多个相关但不同的图表。这就需要使用子图(subplots)功能。而创建不同大小的子图则可以让我们更好地控制图表布局,突出重要信息,优化视觉效果。本文将详细介绍如何在Matplotlib中创建不同大小的子图,包括基本概念、常用方法、高级技巧以及实际应用案例。
1. 子图的基本概念
在深入探讨如何创建不同大小的子图之前,我们需要先了解子图的基本概念。
1.1 什么是子图?
子图是指在一个图形窗口中包含的多个独立的绘图区域。每个子图可以包含自己的坐标轴、标题和数据可视化。
1.2 为什么需要不同大小的子图?
创建不同大小的子图有以下几个主要原因:
- 突出重要信息:较大的子图可以用来展示主要数据或关键结果。
- 优化空间利用:根据数据的复杂度和重要性调整子图大小,可以更有效地利用画布空间。
- 提高可读性:合理安排子图大小可以使整体布局更加清晰,便于读者理解。
- 适应不同类型的图表:某些类型的图表(如热力图)可能需要更大的空间来展示细节。
让我们从最基本的子图创建开始,逐步学习如何控制子图的大小和布局。
2. 创建基本的子图
2.1 使用plt.subplot()
plt.subplot()是创建子图的最基本方法。它将整个图形区域划分为一个网格,并在指定位置创建子图。
import matplotlib.pyplot as plt

plt.figure(figsize=(10, 5))

# 创建第一个子图
plt.subplot(121)
plt.plot([1, 2, 3, 4], [1, 4, 2, 3])
plt.title('Subplot 1 - how2matplotlib.com')

# 创建第二个子图
plt.subplot(122)
plt.plot([1, 2, 3, 4], [1, 2, 4, 3])
plt.title('Subplot 2 - how2matplotlib.com')

plt.tight_layout()
plt.show()
Output:
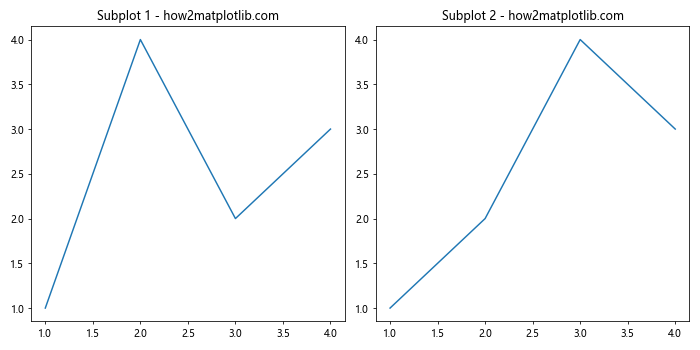
在这个例子中,我们创建了一个2×1的网格,并在其中放置了两个子图。121表示2行1列的第1个位置,122表示2行1列的第2个位置。
2.2 使用plt.subplots()
plt.subplots()函数提供了一种更方便的方式来创建多个子图。
import matplotlib.pyplot as plt

fig, (ax1, ax2) = plt.subplots(1, 2, figsize=(10, 5))

ax1.plot([1, 2, 3, 4], [1, 4, 2, 3])
ax1.set_title('Subplot 1 - how2matplotlib.com')

ax2.plot([1, 2, 3, 4], [1, 2, 4, 3])
ax2.set_title('Subplot 2 - how2matplotlib.com')

plt.tight_layout()
plt.show()
Output:
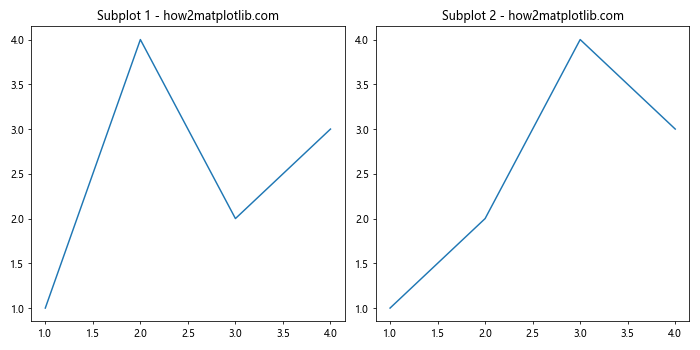
这个方法创建了一个包含两个子图的图形,并返回了图形对象和子图对象的数组。
3. 控制子图大小
现在我们来看看如何创建不同大小的子图。
3.1 使用gridspec
gridspec模块提供了更灵活的方式来控制子图的大小和位置。
import matplotlib.pyplot as plt
import matplotlib.gridspec as gridspec

fig = plt.figure(figsize=(12, 8))
gs = gridspec.GridSpec(2, 2)

ax1 = fig.add_subplot(gs[0, 0])
ax2 = fig.add_subplot(gs[0, 1])
ax3 = fig.add_subplot(gs[1, :])

ax1.plot([1, 2, 3], [4, 5, 6])
ax1.set_title('Subplot 1 - how2matplotlib.com')

ax2.plot([1, 2, 3], [6, 5, 4])
ax2.set_title('Subplot 2 - how2matplotlib.com')

ax3.plot([1, 2, 3, 4], [1, 4, 2, 3])
ax3.set_title('Subplot 3 (Larger) - how2matplotlib.com')

plt.tight_layout()
plt.show()
Output:
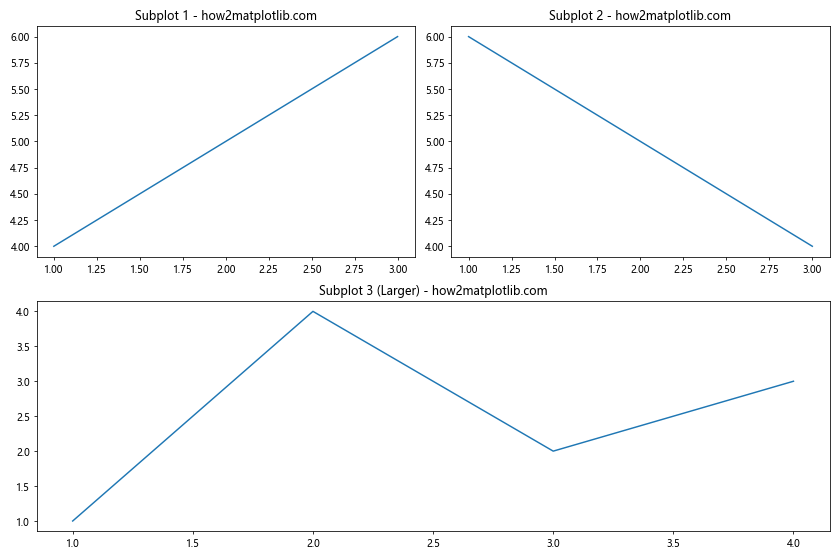
在这个例子中,我们创建了一个2×2的网格,但第三个子图占据了整个底行,因此比其他两个子图大。
3.2 使用width_ratios和height_ratios
我们可以使用width_ratios和height_ratios参数来精确控制子图的相对大小。
import matplotlib.pyplot as plt

fig, axs = plt.subplots(2, 2, figsize=(12, 8),
                        width_ratios=[2, 1],
                        height_ratios=[1, 2])

axs[0, 0].plot([1, 2, 3], [4, 5, 6])
axs[0, 0].set_title('Larger Width - how2matplotlib.com')

axs[0, 1].plot([1, 2, 3], [6, 5, 4])
axs[0, 1].set_title('Smaller Width - how2matplotlib.com')

axs[1, 0].plot([1, 2, 3, 4], [1, 4, 2, 3])
axs[1, 0].set_title('Larger Height - how2matplotlib.com')

axs[1, 1].plot([1, 2, 3, 4], [3, 2, 4, 1])
axs[1, 1].set_title('Larger Height - how2matplotlib.com')

plt.tight_layout()
plt.show()
Output:
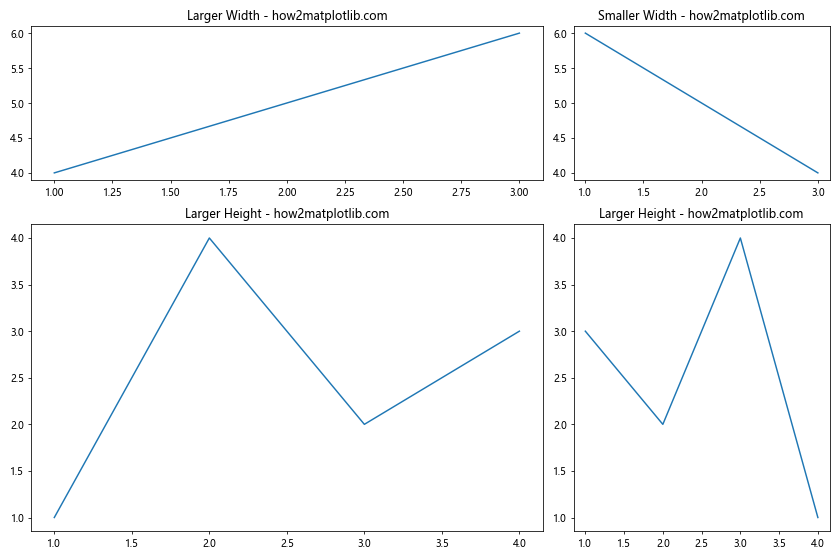
这个例子创建了一个2×2的网格,其中左列的宽度是右列的两倍,下行的高度是上行的两倍。
4. 高级布局技巧
4.1 嵌套子图
我们可以在一个子图内再创建子图,实现更复杂的布局。
import matplotlib.pyplot as plt

fig = plt.figure(figsize=(12, 8))

# 创建主子图
gs_main = fig.add_gridspec(1, 2, width_ratios=[2, 1])

ax_main_left = fig.add_subplot(gs_main[0])
ax_main_left.set_title('Main Left - how2matplotlib.com')
ax_main_left.plot([1, 2, 3], [4, 5, 6])

# 在右侧创建嵌套子图
gs_nested = gs_main[1].subgridspec(2, 1, height_ratios=[1, 2])

ax_nested_top = fig.add_subplot(gs_nested[0])
ax_nested_top.set_title('Nested Top - how2matplotlib.com')
ax_nested_top.plot([1, 2, 3], [1, 2, 3])

ax_nested_bottom = fig.add_subplot(gs_nested[1])
ax_nested_bottom.set_title('Nested Bottom - how2matplotlib.com')
ax_nested_bottom.plot([1, 2, 3], [3, 2, 1])

plt.tight_layout()
plt.show()
Output:
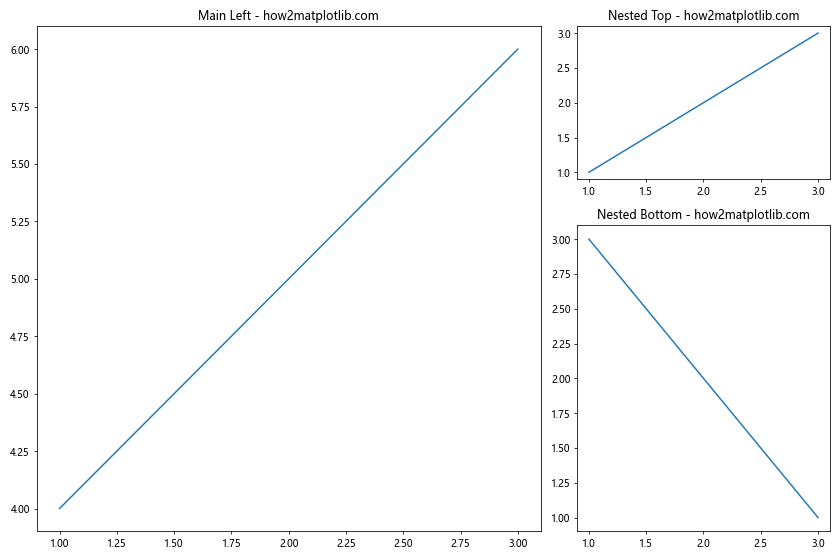
这个例子展示了如何在一个大的子图旁边创建两个较小的嵌套子图。
4.2 使用GridSpec的wspace和hspace
我们可以使用wspace和hspace参数来控制子图之间的间距。
import matplotlib.pyplot as plt
import matplotlib.gridspec as gridspec

fig = plt.figure(figsize=(12, 8))
gs = gridspec.GridSpec(2, 2, width_ratios=[2, 1], height_ratios=[1, 2],
                       wspace=0.4, hspace=0.3)

ax1 = fig.add_subplot(gs[0, 0])
ax2 = fig.add_subplot(gs[0, 1])
ax3 = fig.add_subplot(gs[1, :])

ax1.plot([1, 2, 3], [4, 5, 6])
ax1.set_title('Subplot 1 - how2matplotlib.com')

ax2.plot([1, 2, 3], [6, 5, 4])
ax2.set_title('Subplot 2 - how2matplotlib.com')

ax3.plot([1, 2, 3, 4], [1, 4, 2, 3])
ax3.set_title('Subplot 3 (Larger) - how2matplotlib.com')

plt.show()
Output:
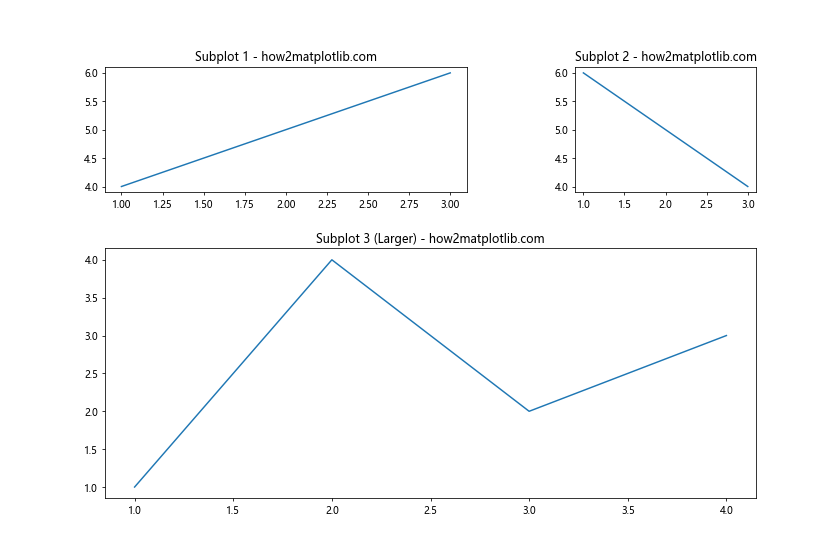
在这个例子中,wspace=0.4设置了列之间的间距,hspace=0.3设置了行之间的间距。
5. 实际应用案例
5.1 数据对比分析
在数据分析中,我们经常需要对比不同的数据集或同一数据集的不同特征。使用不同大小的子图可以有效地突出重要信息。
import matplotlib.pyplot as plt
import numpy as np

fig = plt.figure(figsize=(12, 8))
gs = fig.add_gridspec(2, 3)

# 主要数据展示
ax_main = fig.add_subplot(gs[0, :])
x = np.linspace(0, 10, 100)
ax_main.plot(x, np.sin(x), label='sin(x)')
ax_main.plot(x, np.cos(x), label='cos(x)')
ax_main.set_title('Main Data Comparison - how2matplotlib.com')
ax_main.legend()

# 辅助数据展示
ax1 = fig.add_subplot(gs[1, 0])
ax1.hist(np.random.normal(0, 1, 1000), bins=30)
ax1.set_title('Distribution 1 - how2matplotlib.com')

ax2 = fig.add_subplot(gs[1, 1])
ax2.scatter(np.random.rand(50), np.random.rand(50))
ax2.set_title('Scatter Plot - how2matplotlib.com')

ax3 = fig.add_subplot(gs[1, 2])
ax3.bar(['A', 'B', 'C', 'D'], [3, 7, 2, 5])
ax3.set_title('Bar Chart - how2matplotlib.com')

plt.tight_layout()
plt.show()
Output:
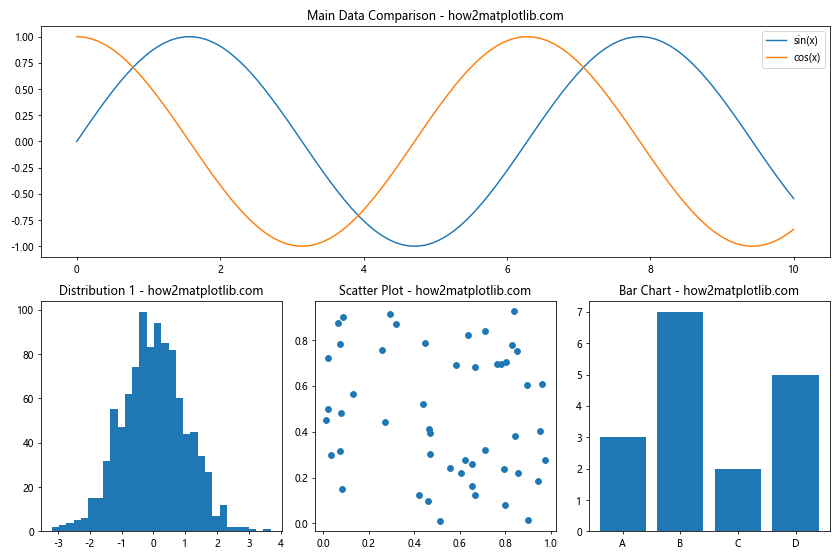
这个例子展示了如何使用不同大小的子图来展示主要数据和辅助数据。顶部的大子图用于主要的数据对比,底部的三个小子图用于展示辅助信息。
5.2 多尺度数据可视化
在处理多尺度数据时,不同大小的子图可以帮助我们同时展示宏观和微观的信息。
import matplotlib.pyplot as plt
import numpy as np

fig = plt.figure(figsize=(12, 8))
gs = fig.add_gridspec(2, 3)

# 宏观数据
ax_macro = fig.add_subplot(gs[:, :2])
x = np.linspace(0, 10, 1000)
y = np.sin(x) * np.exp(-x/10)
ax_macro.plot(x, y)
ax_macro.set_title('Macro View - how2matplotlib.com')

# 微观数据1
ax_micro1 = fig.add_subplot(gs[0, 2])
ax_micro1.plot(x[:100], y[:100])
ax_micro1.set_title('Micro View 1 - how2matplotlib.com')

# 微观数据2
ax_micro2 = fig.add_subplot(gs[1, 2])
ax_micro2.plot(x[400:500], y[400:500])
ax_micro2.set_title('Micro View 2 - how2matplotlib.com')

plt.tight_layout()
plt.show()
Output:
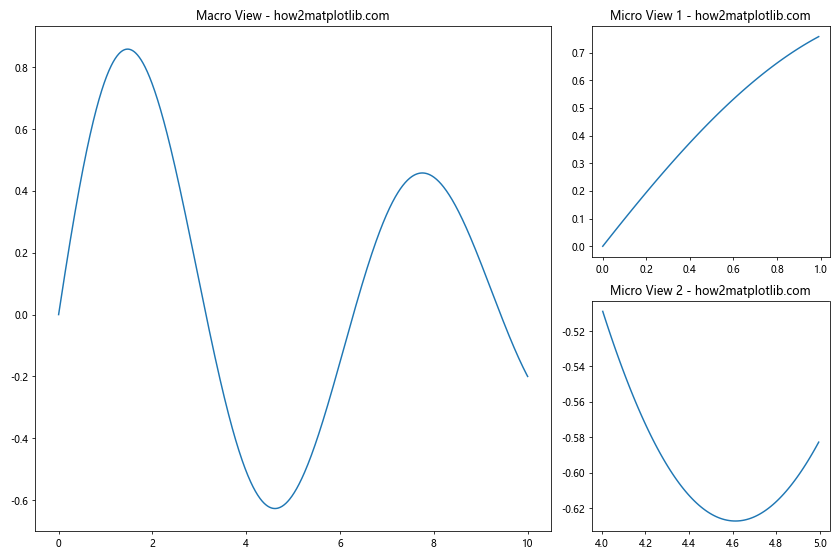
这个例子展示了如何使用一个大子图来显示整体趋势,同时使用两个小子图来展示局部细节。
6. 高级定制技巧
6.1 动态调整子图大小
有时我们可能需要根据数据的特性动态调整子图的大小。以下是一个根据数据范围调整子图大小的例子:
import matplotlib.pyplot as plt
import numpy as np
def adjust_subplot_size(data):
return max(1, min(3, np.log10(max(abs(np.max(data)), abs(np.min(data))))))
fig = plt.figure(figsize=(12, 8))
data1 = np.random.normal(0, 1, 1000)
data2 = np.random.normal(0, 10, 1000)
data3 = np.random.normal(0, 100, 1000)
size1 = adjust_subplot_size(data1)
size2 = adjust_subplot_size(data2)
size3 = adjust_subplot_size(data3)
gs = fig.add_gridspec(1, 3, width_ratios=[size1, size2, size3])
ax1 = fig.add_subplot(gs[0])
ax1.hist(data1, bins=30)
ax1.set_title(f'Data 1 (Size: {size1:.2f}) - how2matplotlib.com')
ax2 = fig.add_subplot(gs[1])
ax2.hist(data2, bins=30)
ax2.set_title(f'Data 2 (Size: {size2:.2f}) - how2matplotlib.com')
ax3 = fig.add_subplot(gs[2])
ax3.hist(data3, bins=30)
ax3.set_title(f'Data 3 (Size: {size3:.2f}) - how2matplotlib.com')
plt.tight_layout()
plt.show()
```这个例子展示了如何根据数据的范围动态调整子图的大小。数据范围越大,对应的子图就越大。
Output:

### 6.2 使用constrained_layout
`constrained_layout`是Matplotlib提供的一个自动调整子图布局的工具,它可以帮助我们避免子图重叠和标签被截断的问题。
```python
import matplotlib.pyplot as plt
import numpy as np
fig, axs = plt.subplots(2, 2, figsize=(12, 8), constrained_layout=True)
# 填充子图
axs[0, 0].plot(np.random.rand(50))
axs[0, 0].set_title('Subplot 1 - how2matplotlib.com')
axs[0, 0].set_xlabel('X Label')
axs[0, 0].set_ylabel('Y Label')
axs[0, 1].scatter(np.random.rand(50), np.random.rand(50))
axs[0, 1].set_title('Subplot 2 - how2matplotlib.com')
axs[0, 1].set_xlabel('X Label')
axs[0, 1].set_ylabel('Y Label')
axs[1, 0].bar(range(10), np.random.rand(10))
axs[1, 0].set_title('Subplot 3 - how2matplotlib.com')
axs[1, 0].set_xlabel('X Label')
axs[1, 0].set_ylabel('Y Label')
axs[1, 1].imshow(np.random.rand(10, 10), cmap='viridis')
axs[1, 1].set_title('Subplot 4 - how2matplotlib.com')
axs[1, 1].set_xlabel('X Label')
axs[1, 1].set_ylabel('Y Label')
plt.show()
Output:
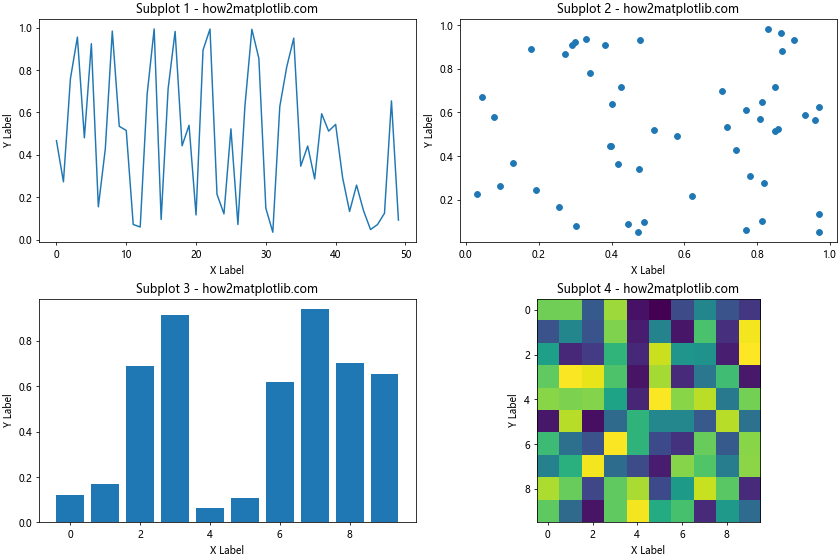
使用constrained_layout=True可以自动调整子图之间的间距,确保标签和标题不会重叠。
7. 处理特殊图表类型
某些特殊类型的图表可能需要更多的空间或特殊的布局。让我们看几个例子。
7.1 热力图与色标
热力图通常需要额外的空间来放置色标(colorbar)。
import matplotlib.pyplot as plt
import numpy as np

fig = plt.figure(figsize=(12, 8))
gs = fig.add_gridspec(1, 2, width_ratios=[20, 1])

ax_heatmap = fig.add_subplot(gs[0])
ax_colorbar = fig.add_subplot(gs[1])

data = np.random.rand(10, 10)
im = ax_heatmap.imshow(data, cmap='viridis')
ax_heatmap.set_title('Heatmap - how2matplotlib.com')

plt.colorbar(im, cax=ax_colorbar)
ax_colorbar.set_ylabel('Color Scale')

plt.tight_layout()
plt.show()
Output:
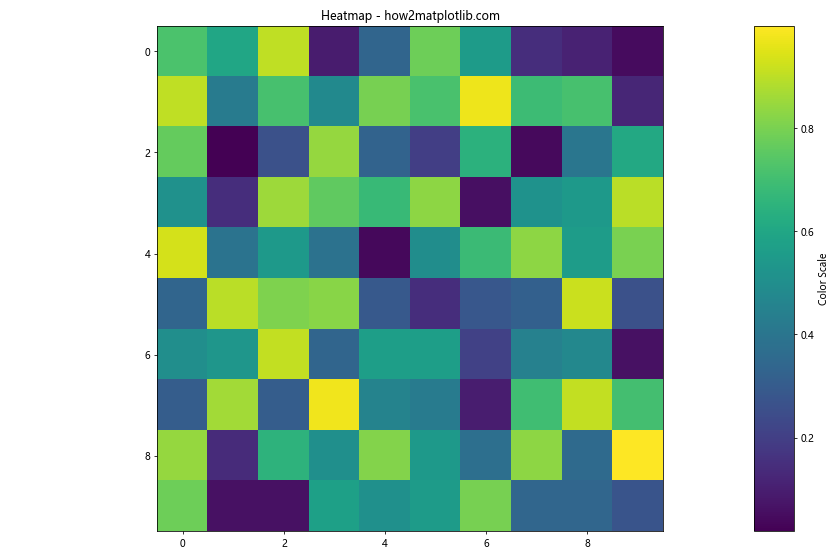
这个例子创建了一个热力图和一个单独的色标子图,使用width_ratios来控制它们的相对大小。
7.2 极坐标图
极坐标图通常需要更方形的空间来保持其圆形特性。
import matplotlib.pyplot as plt
import numpy as np

fig = plt.figure(figsize=(12, 8))
gs = fig.add_gridspec(1, 2, width_ratios=[1, 1])

ax_polar = fig.add_subplot(gs[0], projection='polar')
ax_cartesian = fig.add_subplot(gs[1])

# 极坐标数据
theta = np.linspace(0, 2*np.pi, 100)
r = np.abs(np.sin(2*theta) * np.cos(2*theta))
ax_polar.plot(theta, r)
ax_polar.set_title('Polar Plot - how2matplotlib.com')

# 笛卡尔坐标数据
x = np.linspace(0, 10, 100)
y = np.sin(x)
ax_cartesian.plot(x, y)
ax_cartesian.set_title('Cartesian Plot - how2matplotlib.com')

plt.tight_layout()
plt.show()
Output:
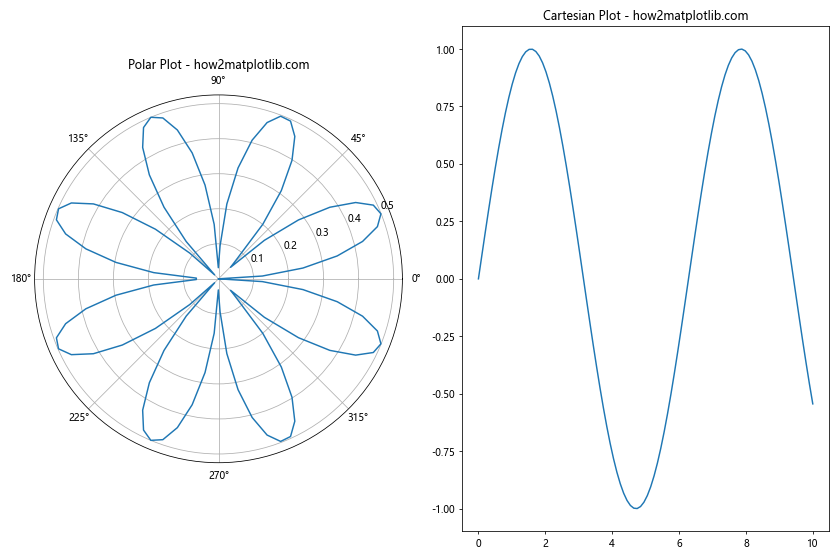
这个例子展示了如何在同一个图形中并排放置极坐标图和普通的笛卡尔坐标图。
8. 响应式布局
在某些情况下,我们可能需要创建能够适应不同屏幕大小的响应式布局。虽然Matplotlib主要用于静态图形,但我们可以通过一些技巧来实现简单的响应式设计。
import matplotlib.pyplot as plt
import numpy as np

def create_responsive_layout(width, height):
    fig = plt.figure(figsize=(width, height))

    if width > height:
        # 横向布局
        gs = fig.add_gridspec(1, 2)
        ax1 = fig.add_subplot(gs[0])
        ax2 = fig.add_subplot(gs[1])
    else:
        # 纵向布局
        gs = fig.add_gridspec(2, 1)
        ax1 = fig.add_subplot(gs[0])
        ax2 = fig.add_subplot(gs[1])

    x = np.linspace(0, 10, 100)
    ax1.plot(x, np.sin(x))
    ax1.set_title('Sin Plot - how2matplotlib.com')

    ax2.plot(x, np.cos(x))
    ax2.set_title('Cos Plot - how2matplotlib.com')

    plt.tight_layout()
    plt.show()

# 模拟不同的屏幕尺寸
create_responsive_layout(12, 6)  # 横向布局
create_responsive_layout(6, 12)  # 纵向布局
这个例子展示了如何根据图形的宽高比来动态调整子图的布局。当宽度大于高度时,使用横向布局;反之则使用纵向布局。
9. 子图的动态添加和删除
在某些交互式应用中,我们可能需要动态地添加或删除子图。虽然Matplotlib主要用于静态图形,但我们可以通过一些技巧来模拟这种动态行为。
import matplotlib.pyplot as plt
import numpy as np

fig = plt.figure(figsize=(12, 8))
gs = fig.add_gridspec(2, 2)

def add_subplot(row, col):
    ax = fig.add_subplot(gs[row, col])
    x = np.linspace(0, 10, 100)
    ax.plot(x, np.random.rand(100))
    ax.set_title(f'Subplot ({row}, {col}) - how2matplotlib.com')
    plt.draw()

def remove_subplot(row, col):
    for ax in fig.axes:
        if ax.get_subplotspec().get_gridspec() == gs[row, col]:
            fig.delaxes(ax)
            break
    plt.draw()

# 初始添加两个子图
add_subplot(0, 0)
add_subplot(0, 1)

plt.ion()  # 打开交互模式
plt.show()

# 模拟动态添加和删除
plt.pause(2)
add_subplot(1, 0)
plt.pause(2)
remove_subplot(0, 1)
plt.pause(2)
add_subplot(1, 1)

plt.ioff()  # 关闭交互模式
plt.show()
这个例子展示了如何动态地添加和删除子图。虽然这不是Matplotlib的标准用法,但在某些特殊场景下可能会有用。
10. 最佳实践和注意事项
在创建不同大小的子图时,有一些最佳实践和注意事项需要考虑:
- 保持一致性:尽管子图大小不同,但要保持整体风格的一致性,包括颜色、字体等。
-
避免过度复杂:不要在一个图形中放置太多子图,这可能会使图形变得混乱难懂。
-
考虑数据的重要性:将最重要或最复杂的数据放在较大的子图中。
-
使用适当的间距:确保子图之间有足够的间距,避免内容重叠。
-
注意标签和标题:确保所有标签和标题都清晰可见,不被其他元素遮挡。
-
考虑输出格式:根据输出格式(如打印、屏幕显示、幻灯片等)调整布局。
-
使用
tight_layout()或constrained_layout:这些功能可以帮助自动调整子图布局。 -
测试不同的屏幕尺寸:如果可能,在不同大小的屏幕上测试你的图形。
-
使用相对单位:尽可能使用相对单位而不是绝对单位来定义子图大小。
-
保持简洁:记住,图形的主要目的是传达信息。不要为了美观而牺牲清晰度。
结论
创建不同大小的子图是Matplotlib中一项强大而灵活的功能。通过合理利用这一功能,我们可以创建出既美观又信息丰富的数据可视化图表。从基本的subplot()和subplots()函数,到更高级的GridSpec和嵌套布局,Matplotlib提供了多种工具来满足不同的需求。
在实际应用中,选择合适的子图大小和布局需要考虑数据的特性、重要性以及整体的视觉平衡。通过实践和经验,你将能够创建出既能有效传达信息,又能吸引读者注意力的图表。
记住,创建优秀的数据可视化不仅仅是技术问题,还需要对数据有深入的理解,以及对设计原则的把握。继续探索和实践,你将能够充分发挥Matplotlib的潜力,创造出令人印象深刻的数据可视化作品。
 极客笔记
极客笔记