Matplotlib图例中如何调整项目顺序:全面指南
参考:How to Change Order of Items in Matplotlib Legend
Matplotlib是Python中最流行的数据可视化库之一,它提供了强大的绘图功能。在使用Matplotlib创建图表时,图例(Legend)是一个非常重要的元素,它帮助读者理解图表中不同数据系列的含义。然而,有时默认的图例顺序可能不符合我们的需求。本文将详细介绍如何在Matplotlib中调整图例项目的顺序,以创建更清晰、更有意义的图表。
1. 理解Matplotlib图例的基本概念
在深入探讨如何调整图例顺序之前,我们首先需要了解Matplotlib图例的基本概念。图例通常包含了图表中各个数据系列的标识符和描述。默认情况下,Matplotlib会按照数据系列在代码中的绘制顺序来排列图例项目。
让我们从一个简单的例子开始:
import matplotlib.pyplot as plt

plt.figure(figsize=(10, 6))
plt.plot([1, 2, 3, 4], [1, 4, 2, 3], label='Line A')
plt.plot([1, 2, 3, 4], [2, 3, 4, 1], label='Line B')
plt.plot([1, 2, 3, 4], [4, 1, 3, 2], label='Line C')
plt.legend()
plt.title('Basic Legend Example - how2matplotlib.com')
plt.show()
Output:
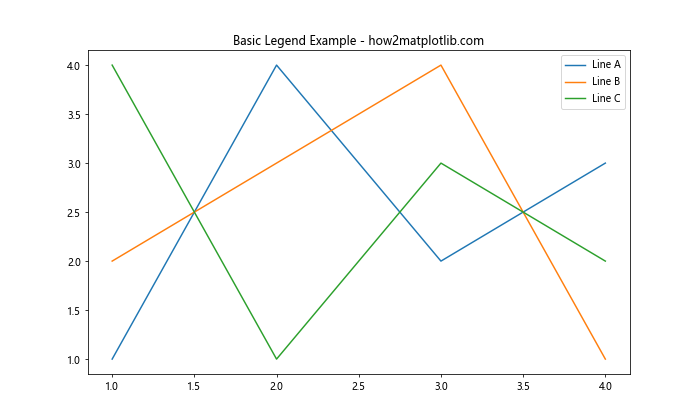
在这个例子中,我们绘制了三条线,并为每条线添加了标签。Matplotlib会自动创建一个图例,按照线条绘制的顺序显示标签。
2. 使用legend()函数调整图例顺序
调整图例顺序的最直接方法是使用legend()函数,并明确指定标签的顺序。这种方法允许我们完全控制图例项目的排列。
import matplotlib.pyplot as plt

plt.figure(figsize=(10, 6))
line1, = plt.plot([1, 2, 3, 4], [1, 4, 2, 3], label='Line A')
line2, = plt.plot([1, 2, 3, 4], [2, 3, 4, 1], label='Line B')
line3, = plt.plot([1, 2, 3, 4], [4, 1, 3, 2], label='Line C')
plt.legend([line3, line1, line2], ['Line C', 'Line A', 'Line B'])
plt.title('Reordered Legend - how2matplotlib.com')
plt.show()
Output:
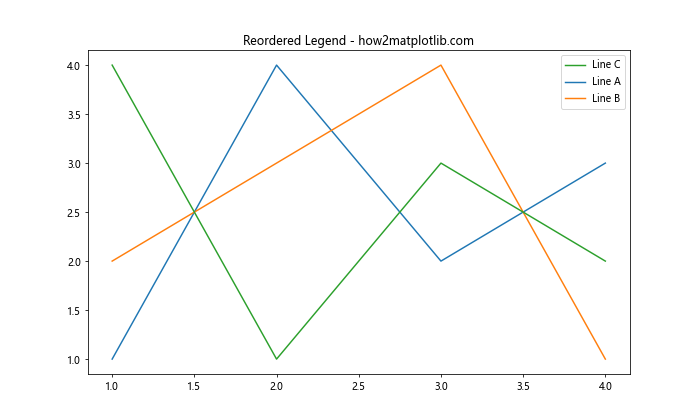
在这个例子中,我们首先创建了三条线,然后使用legend()函数明确指定了图例的顺序。注意我们如何将线条对象和标签作为单独的列表传递给legend()函数。
3. 使用handles和labels参数调整顺序
另一种调整图例顺序的方法是使用plt.gca().get_legend_handles_labels()获取当前图表的句柄(handles)和标签,然后重新排序这些列表。
import matplotlib.pyplot as plt

plt.figure(figsize=(10, 6))
plt.plot([1, 2, 3, 4], [1, 4, 2, 3], label='Line A')
plt.plot([1, 2, 3, 4], [2, 3, 4, 1], label='Line B')
plt.plot([1, 2, 3, 4], [4, 1, 3, 2], label='Line C')

handles, labels = plt.gca().get_legend_handles_labels()
order = [2, 0, 1]  # 指定新的顺序
plt.legend([handles[idx] for idx in order], [labels[idx] for idx in order])
plt.title('Reordered Legend using handles and labels - how2matplotlib.com')
plt.show()
Output:
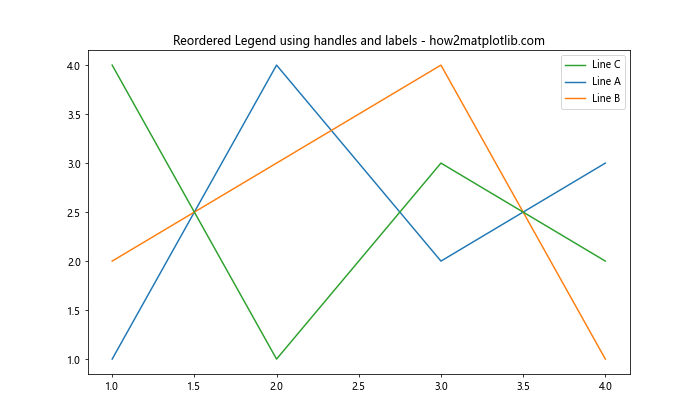
这种方法的优点是我们可以通过简单地改变order列表来灵活地调整顺序,而不需要显式地列出所有的句柄和标签。
4. 使用sorted()函数按字母顺序排列图例
有时,我们可能希望图例按照字母顺序排列。这可以通过使用Python的sorted()函数来实现:
import matplotlib.pyplot as plt

plt.figure(figsize=(10, 6))
plt.plot([1, 2, 3, 4], [1, 4, 2, 3], label='Line C')
plt.plot([1, 2, 3, 4], [2, 3, 4, 1], label='Line A')
plt.plot([1, 2, 3, 4], [4, 1, 3, 2], label='Line B')

handles, labels = plt.gca().get_legend_handles_labels()
labels, handles = zip(*sorted(zip(labels, handles), key=lambda t: t[0]))
plt.legend(handles, labels)
plt.title('Alphabetically Sorted Legend - how2matplotlib.com')
plt.show()
Output:
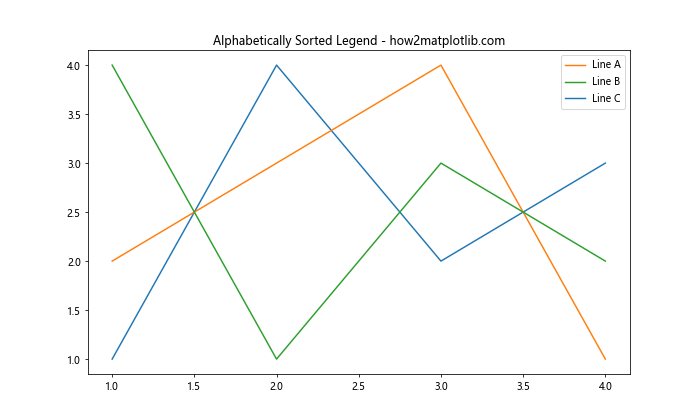
在这个例子中,我们使用zip()函数将标签和句柄配对,然后使用sorted()函数按标签的字母顺序排序。最后,我们再次解压缩排序后的列表以获取新的顺序。
5. 使用自定义排序函数
如果我们需要更复杂的排序逻辑,可以定义一个自定义的排序函数:
import matplotlib.pyplot as plt

def custom_sort(item):
    order = {'Line B': 1, 'Line A': 2, 'Line C': 3}
    return order[item]

plt.figure(figsize=(10, 6))
plt.plot([1, 2, 3, 4], [1, 4, 2, 3], label='Line C')
plt.plot([1, 2, 3, 4], [2, 3, 4, 1], label='Line A')
plt.plot([1, 2, 3, 4], [4, 1, 3, 2], label='Line B')

handles, labels = plt.gca().get_legend_handles_labels()
labels, handles = zip(*sorted(zip(labels, handles), key=custom_sort))
plt.legend(handles, labels)
plt.title('Custom Sorted Legend - how2matplotlib.com')
plt.show()
在这个例子中,我们定义了一个custom_sort函数,它为每个标签分配了一个优先级。然后我们使用这个函数作为sorted()的key参数来排序图例项目。
6. 反转图例顺序
有时,我们可能只是想简单地反转图例的顺序。这可以通过使用Python的切片语法轻松实现:
import matplotlib.pyplot as plt

plt.figure(figsize=(10, 6))
plt.plot([1, 2, 3, 4], [1, 4, 2, 3], label='Line A')
plt.plot([1, 2, 3, 4], [2, 3, 4, 1], label='Line B')
plt.plot([1, 2, 3, 4], [4, 1, 3, 2], label='Line C')

handles, labels = plt.gca().get_legend_handles_labels()
plt.legend(handles[::-1], labels[::-1])
plt.title('Reversed Legend Order - how2matplotlib.com')
plt.show()
Output:
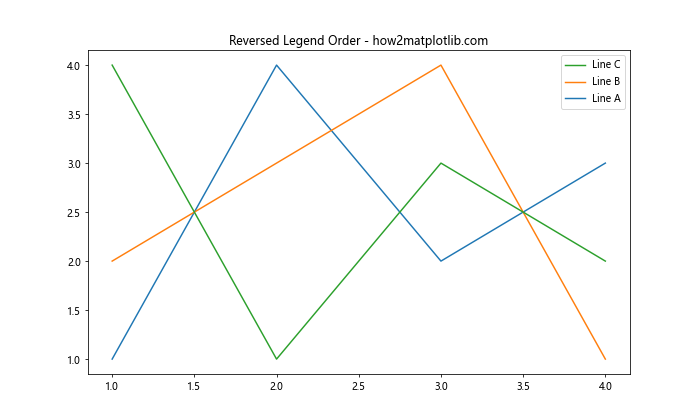
在这个例子中,我们使用[::-1]切片语法来反转句柄和标签列表的顺序。
7. 在多子图中调整图例顺序
当我们使用多个子图时,调整图例顺序的方法略有不同。我们需要为每个子图单独设置图例:
import matplotlib.pyplot as plt

fig, (ax1, ax2) = plt.subplots(1, 2, figsize=(15, 6))

ax1.plot([1, 2, 3, 4], [1, 4, 2, 3], label='Line A')
ax1.plot([1, 2, 3, 4], [2, 3, 4, 1], label='Line B')
ax1.plot([1, 2, 3, 4], [4, 1, 3, 2], label='Line C')
handles, labels = ax1.get_legend_handles_labels()
ax1.legend(handles[::-1], labels[::-1])
ax1.set_title('Subplot 1 - how2matplotlib.com')

ax2.plot([1, 2, 3, 4], [1, 4, 2, 3], label='Line X')
ax2.plot([1, 2, 3, 4], [2, 3, 4, 1], label='Line Y')
ax2.plot([1, 2, 3, 4], [4, 1, 3, 2], label='Line Z')
handles, labels = ax2.get_legend_handles_labels()
ax2.legend([handles[2], handles[0], handles[1]], [labels[2], labels[0], labels[1]])
ax2.set_title('Subplot 2 - how2matplotlib.com')

plt.tight_layout()
plt.show()
Output:
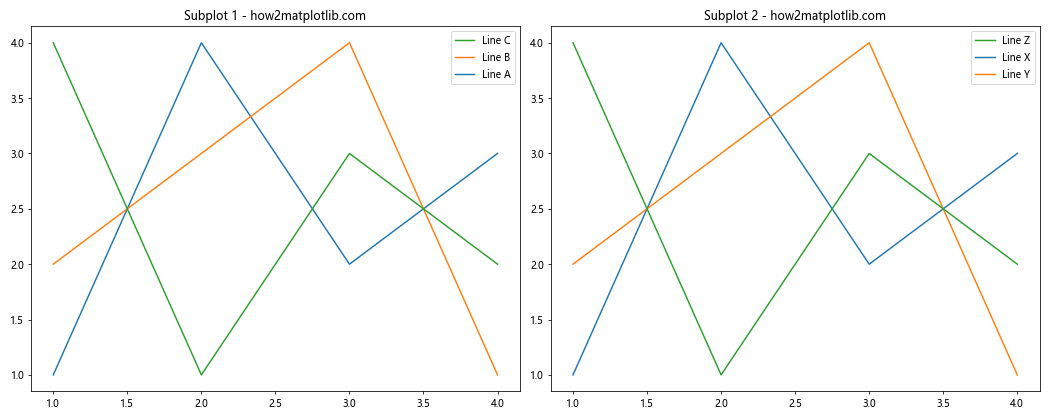
在这个例子中,我们创建了两个子图,并为每个子图单独设置了图例顺序。第一个子图使用反转顺序,第二个子图使用自定义顺序。
8. 使用OrderedDict调整图例顺序
Python的collections模块提供了OrderedDict类,我们可以利用它来精确控制图例的顺序:
import matplotlib.pyplot as plt
from collections import OrderedDict

plt.figure(figsize=(10, 6))
lines = OrderedDict()
lines['Line C'] = plt.plot([1, 2, 3, 4], [1, 4, 2, 3], label='Line C')[0]
lines['Line A'] = plt.plot([1, 2, 3, 4], [2, 3, 4, 1], label='Line A')[0]
lines['Line B'] = plt.plot([1, 2, 3, 4], [4, 1, 3, 2], label='Line B')[0]

plt.legend(lines.values(), lines.keys())
plt.title('Legend Order using OrderedDict - how2matplotlib.com')
plt.show()
Output:
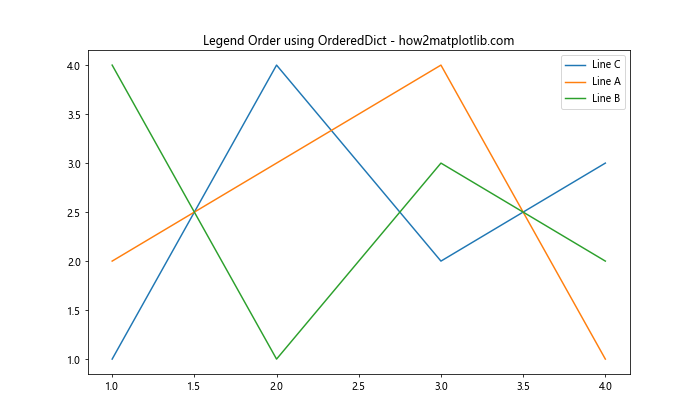
在这个例子中,我们使用OrderedDict来存储线条对象和标签。这样我们可以在创建图例时精确控制顺序。
9. 动态调整图例顺序
有时,我们可能需要根据数据的某些特征动态调整图例顺序。例如,我们可能想根据每条线的最终值来排序:
import matplotlib.pyplot as plt
import numpy as np

plt.figure(figsize=(10, 6))
data = {
    'Line A': np.random.rand(10),
    'Line B': np.random.rand(10),
    'Line C': np.random.rand(10)
}

for label, values in data.items():
    plt.plot(values, label=label)

handles, labels = plt.gca().get_legend_handles_labels()
sorted_pairs = sorted(zip(handles, labels), key=lambda x: x[0].get_ydata()[-1], reverse=True)
handles, labels = zip(*sorted_pairs)

plt.legend(handles, labels)
plt.title('Dynamically Sorted Legend - how2matplotlib.com')
plt.show()
Output:
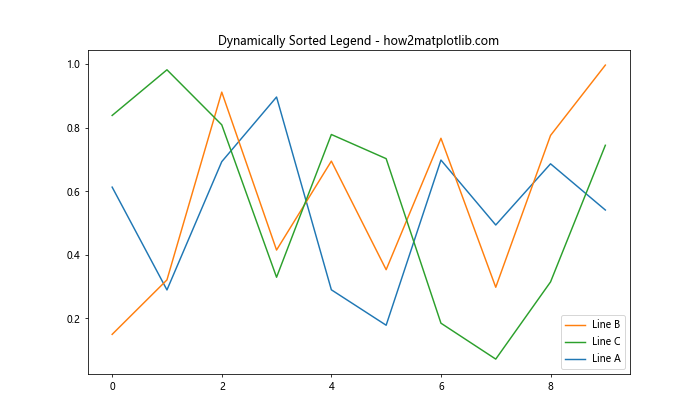
在这个例子中,我们根据每条线的最后一个数据点的值来排序图例。这种方法在处理时间序列数据时特别有用,可以突出显示最近表现最好的数据系列。
10. 使用bbox_to_anchor调整图例位置
调整图例顺序时,我们可能还想调整图例的位置。bbox_to_anchor参数允许我们精确控制图例的位置:
import matplotlib.pyplot as plt

plt.figure(figsize=(10, 6))
plt.plot([1, 2, 3, 4], [1, 4, 2, 3], label='Line A')
plt.plot([1, 2, 3, 4], [2, 3, 4, 1], label='Line B')
plt.plot([1, 2, 3, 4], [4, 1, 3, 2], label='Line C')

handles, labels = plt.gca().get_legend_handles_labels()
plt.legend(handles[::-1], labels[::-1], bbox_to_anchor=(1.05, 1), loc='upper left')
plt.title('Legend with Custom Position - how2matplotlib.com')
plt.tight_layout()
plt.show()
Output:
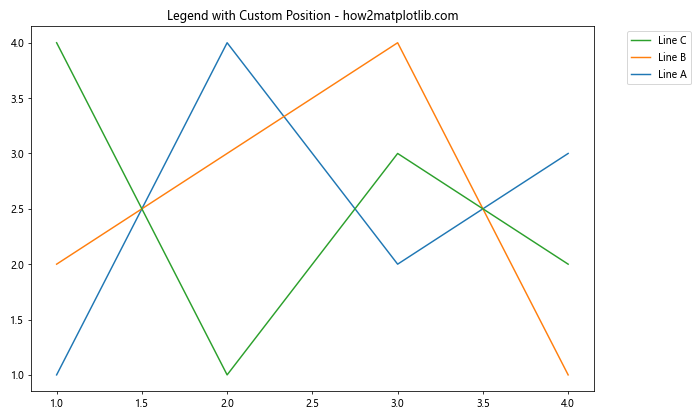
在这个例子中,我们不仅反转了图例顺序,还使用bbox_to_anchor将图例放置在图表的右上角外部。
11. 使用ncol参数创建多列图例
当图例项目较多时,我们可能希望将图例排列成多列以节省空间:
import matplotlib.pyplot as plt

plt.figure(figsize=(12, 6))
for i in range(6):
    plt.plot([1, 2, 3, 4], [i+1, i+2, i+3, i+4], label=f'Line {i+1}')

handles, labels = plt.gca().get_legend_handles_labels()
plt.legend(handles[::-1], labels[::-1], ncol=3, loc='upper center', bbox_to_anchor=(0.5, -0.05))
plt.title('Multi-column Legend - how2matplotlib.com')
plt.tight_layout()
plt.show()
Output:
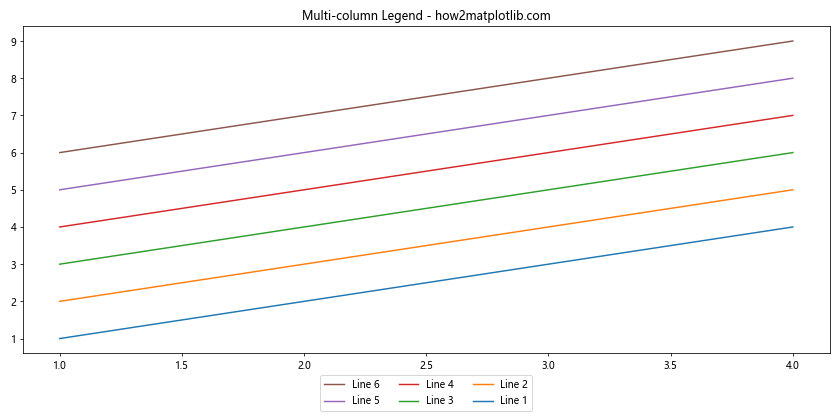
在这个例子中,我们创建了6条线,并使用ncol=3参数将图例排列成3列。我们还使用bbox_to_anchor将图例放置在图表下方。
12. 使用handler_map自定义图例样式
有时,我们可能想要更改图例中特定项目的样式。这可以通过handler_map参数实现:
import matplotlib.pyplot as plt
from matplotlib.legend_handler import HandlerLine2D

class CustomHandler(HandlerLine2D):
    def create_artists(self, legend, orig_handle, xdescent, ydescent, width, height, fontsize, trans):
        line, = super().create_artists(legend, orig_handle, xdescent, ydescent, width, height, fontsize, trans)
        line.set_color('red')  # 将图例中的线条颜色设置为红色
        return [line]

plt.figure(figsize=(10, 6))
line1, = plt.plot([1, 2, 3, 4], [1, 4, 2, 3], label='Line A')
line2, = plt.plot([1, 2, 3, 4], [2, 3, 4, 1], label='Line B')
line3, = plt.plot([1, 2, 3, 4], [4, 1, 3, 2], label='Line C')

plt.legend(handler_map={line2: CustomHandler()})
plt.title('Custom Legend Handler - how2matplotlib.com')
plt.show()
Output:
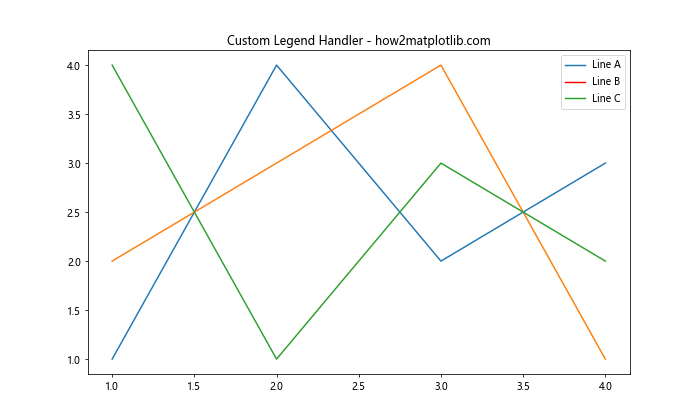
在这个例子中,我们创建了一个自定义的HandlerLine2D子类,它将图例中的线条颜色更改为红色。然后,我们使用handler_map参数将这个自定义处理程序应用于line2。
13. 使用zorder调整图例中项目的叠加顺序
虽然zorder主要用于控制图表元素的叠加顺序,但它也可以影响图例中项目的显示顺序:
import matplotlib.pyplot as plt

plt.figure(figsize=(10, 6))
plt.plot([1, 2, 3, 4], [1, 4, 2, 3], label='Line A', zorder=3)
plt.plot([1, 2, 3, 4], [2, 3, 4, 1], label='Line B', zorder=1)
plt.plot([1, 2, 3, 4], [4, 1, 3, 2], label='Line C', zorder=2)

plt.legend()
plt.title('Legend Order Affected by zorder - how2matplotlib.com')
plt.show()
Output:
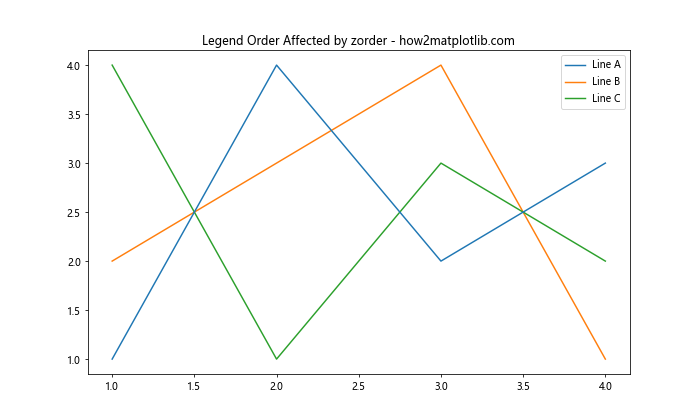
在这个例子中,尽管线条是按 A、B、C 的顺序绘制的,但由于zorder的设置,图例中的顺序会变为 B、C、A。
14. 使用loc参数调整图例位置
除了使用bbox_to_anchor,我们还可以使用loc参数来快速调整图例的位置:
import matplotlib.pyplot as plt

plt.figure(figsize=(10, 6))
plt.plot([1, 2, 3, 4], [1, 4, 2, 3], label='Line A')
plt.plot([1, 2, 3, 4], [2, 3, 4, 1], label='Line B')
plt.plot([1, 2, 3, 4], [4, 1, 3, 2], label='Line C')

handles, labels = plt.gca().get_legend_handles_labels()
plt.legend(handles[::-1], labels[::-1], loc='center left')
plt.title('Legend with Custom Location - how2matplotlib.com')
plt.show()
Output:
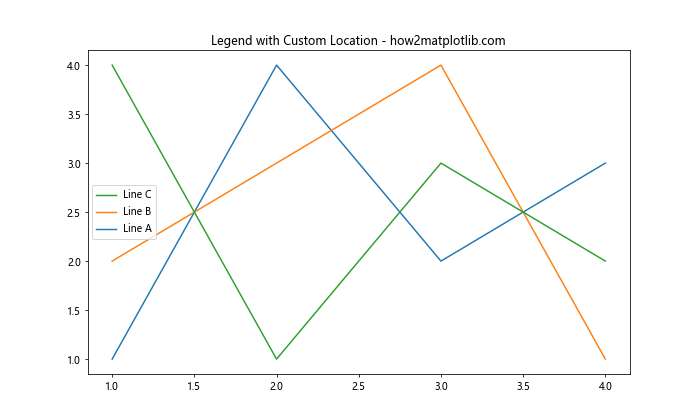
在这个例子中,我们使用loc='center left'将图例放置在图表的左侧中央。
15. 使用columnspacing和handlelength调整图例布局
当使用多列图例时,我们可能想要调整列之间的间距和图例标记的长度:
import matplotlib.pyplot as plt

plt.figure(figsize=(12, 6))
for i in range(6):
    plt.plot([1, 2, 3, 4], [i+1, i+2, i+3, i+4], label=f'Line {i+1}')

handles, labels = plt.gca().get_legend_handles_labels()
plt.legend(handles[::-1], labels[::-1], ncol=3, loc='upper center',
           bbox_to_anchor=(0.5, -0.05), columnspacing=1, handlelength=1)
plt.title('Adjusted Legend Layout - how2matplotlib.com')
plt.tight_layout()
plt.show()
Output:
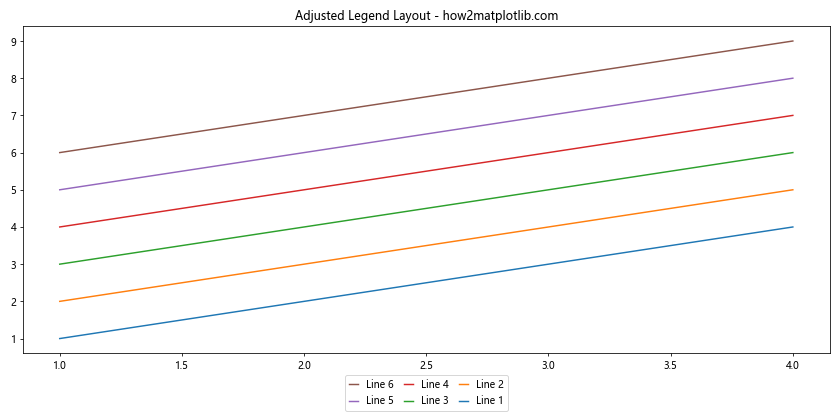
在这个例子中,我们使用columnspacing=1来增加列之间的间距,使用handlelength=1来减少图例标记的长度。
16. 使用frameon参数控制图例边框
有时,我们可能想要移除图例的边框以获得更清爽的外观:
import matplotlib.pyplot as plt

plt.figure(figsize=(10, 6))
plt.plot([1, 2, 3, 4], [1, 4, 2, 3], label='Line A')
plt.plot([1, 2, 3, 4], [2, 3, 4, 1], label='Line B')
plt.plot([1, 2, 3, 4], [4, 1, 3, 2], label='Line C')

handles, labels = plt.gca().get_legend_handles_labels()
plt.legend(handles[::-1], labels[::-1], frameon=False)
plt.title('Legend without Frame - how2matplotlib.com')
plt.show()
Output:
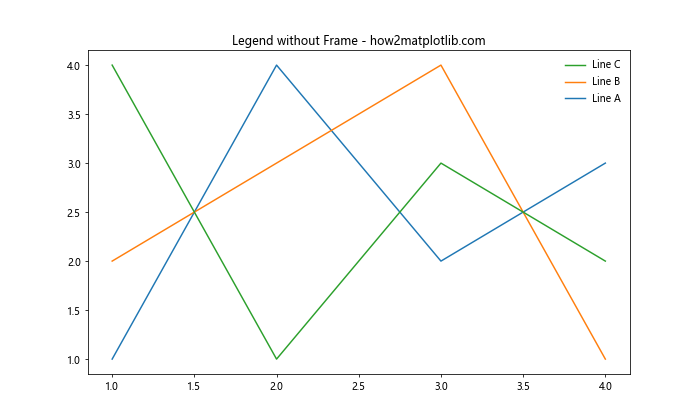
在这个例子中,我们使用frameon=False参数来移除图例的边框。
17. 使用drag_pan事件动态更新图例顺序
对于交互式图表,我们可能想要允许用户通过拖动来重新排序图例项目:
import matplotlib.pyplot as plt
from matplotlib.legend_handler import HandlerLine2D

class DraggableLegend:
    def __init__(self, legend):
        self.legend = legend
        self.fig = legend.figure
        self.picking_pos = None
        self.connect()

    def connect(self):
        self.cidpress = self.fig.canvas.mpl_connect('button_press_event', self.on_press)
        self.cidrelease = self.fig.canvas.mpl_connect('button_release_event', self.on_release)
        self.cidmotion = self.fig.canvas.mpl_connect('motion_notify_event', self.on_motion)

    def on_press(self, event):
        if event.inaxes != self.legend.ax:
            return
        contains, _ = self.legend.contains(event)
        if not contains:
            return
        self.picking_pos = event.y

    def on_motion(self, event):
        if self.picking_pos is None:
            return
        dy = event.y - self.picking_pos
        self.legend.set_bbox_to_anchor((0, dy), 'upper left')
        self.fig.canvas.draw()

    def on_release(self, event):
        self.picking_pos = None
        self.fig.canvas.draw()

plt.figure(figsize=(10, 6))
plt.plot([1, 2, 3, 4], [1, 4, 2, 3], label='Line A')
plt.plot([1, 2, 3, 4], [2, 3, 4, 1], label='Line B')
plt.plot([1, 2, 3, 4], [4, 1, 3, 2], label='Line C')

legend = plt.legend()
DraggableLegend(legend)

plt.title('Draggable Legend - how2matplotlib.com')
plt.show()
Output:
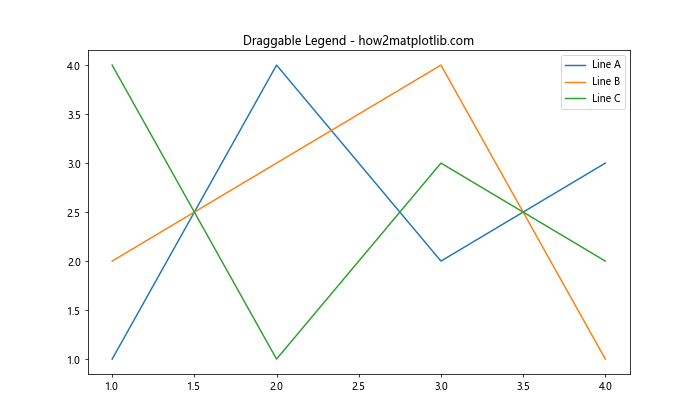
这个例子创建了一个可拖动的图例。用户可以点击并拖动图例来改变其位置。
总结
调整Matplotlib图例中项目的顺序是创建清晰、信息丰富的数据可视化的重要步骤。通过本文介绍的各种方法,你可以灵活地控制图例的顺序、样式和位置,以最好地展示你的数据。
从简单的反转顺序到复杂的自定义排序函数,从调整图例位置到创建可交互的图例,这些技巧将帮助你创建更专业、更有吸引力的图表。记住,选择最适合你的数据和受众的方法是关键。
通过实践和实验,你将能够掌握这些技巧,并在你的数据可视化项目中灵活运用。无论你是在进行科学研究、数据分析还是商业报告,这些方法都将帮助你更有效地传达信息,让你的图表更具说服力。
最后,不要忘记Matplotlib的强大和灵活性。本文介绍的方法只是冰山一角,随着你对Matplotlib的深入了解,你将发现更多可能性来优化你的图表和图例。继续探索,不断学习,你的数据可视化技能将会不断提升。
 极客笔记
极客笔记