如何在Matplotlib中添加子图之间的间距
参考:how to add space between subplots in matplotlib
Matplotlib是一个功能强大的Python绘图库,可以用来创建各种类型的图表和图形。在Matplotlib中,我们经常需要在同一个图中显示多个子图。但是,默认情况下,子图之间是没有间距的,这可能会导致图表显得拥挤,不易阅读。本文将介绍如何在Matplotlib中添加子图之间的间距,以使图表更加清晰和美观。
1. 使用subplot2grid方法创建子图
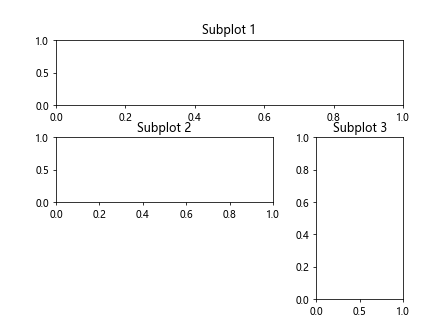
首先,我们可以使用subplot2grid方法创建子图,并通过设置参数hspace和wspace来控制子图之间的垂直和水平间距。以下是一个示例代码:
import matplotlib.pyplot as plt

fig = plt.figure()

ax1 = plt.subplot2grid((3,3), (0,0), colspan=3)
ax1.set_title('Subplot 1')

ax2 = plt.subplot2grid((3,3), (1,0), colspan=2)
ax2.set_title('Subplot 2')

ax3 = plt.subplot2grid((3,3), (1,2), rowspan=2)
ax3.set_title('Subplot 3')

plt.subplots_adjust(hspace=0.5, wspace=0.5)
plt.show()
Output:

在上面的示例中,我们使用subplot2grid方法创建了一个3×3的网格,并在其中放置了三个子图。通过调整hspace和wspace参数的数值,可以控制子图之间的垂直和水平间距。
2. 使用subplots方法创建子图
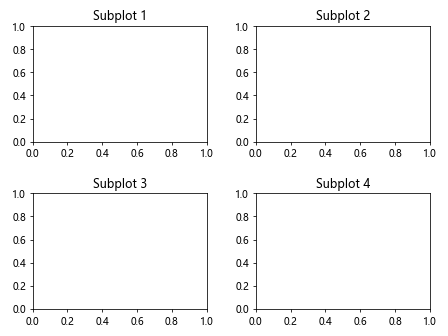
另一种创建子图的方法是使用subplots方法,然后通过调整fig.tight_layout()方法的参数来调整子图的间距。以下是一个示例代码:
import matplotlib.pyplot as plt

fig, axs = plt.subplots(2, 2)
axs[0, 0].set_title('Subplot 1')
axs[0, 1].set_title('Subplot 2')
axs[1, 0].set_title('Subplot 3')
axs[1, 1].set_title('Subplot 4')

fig.tight_layout(h_pad=2, w_pad=2)
plt.show()
Output:

在上面的示例中,我们使用subplots(2, 2)方法创建了一个2×2的子图网格,并且设置了每个子图的标题。通过调整fig.tight_layout()方法的h_pad和w_pad参数来控制子图之间的垂直和水平间距。
3. 使用gridspec方法创建子图
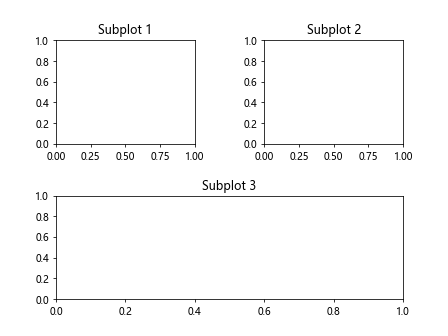
最后,我们还可以使用GridSpec方法创建子图,并通过调整wspace和hspace属性来设置子图之间的间距。以下是一个示例代码:
import matplotlib.pyplot as plt
import matplotlib.gridspec as gridspec

fig = plt.figure()
gs = gridspec.GridSpec(2, 2)

ax1 = plt.subplot(gs[0, 0])
ax1.set_title('Subplot 1')

ax2 = plt.subplot(gs[0, 1])
ax2.set_title('Subplot 2')

ax3 = plt.subplot(gs[1, :])
ax3.set_title('Subplot 3')

plt.subplots_adjust(wspace=0.5, hspace=0.5)
plt.show()
Output:

在上面的示例中,我们使用GridSpec(2, 2)方法创建了一个2×2的子图网格,并在其中放置了三个子图。通过调整subplots_adjust方法的wspace和hspace参数来控制子图之间的水平和垂直间距。
结论
通过上面的示例代码,我们学习了如何在Matplotlib中添加子图之间的间距。无论是使用subplot2grid、subplots还是GridSpec方法,我们都可以通过调整参数来控制子图之间的间距,从而使图表更加清晰和美观。
 极客笔记
极客笔记