如何在Matplotlib中添加图例
参考:how to add legend in matplotlib
图例在Matplotlib中是一个非常重要的组件,它可以帮助我们更好地理解图表中的数据内容。在Matplotlib中添加图例非常简单,但有一些技巧和参数需要了解。本文将详细介绍如何在Matplotlib中添加图例。
示例代码1:基本图例
import matplotlib.pyplot as plt

x = [1, 2, 3, 4, 5]
y1 = [2, 3, 5, 7, 6]
y2 = [1, 2, 4, 3, 5]

plt.plot(x, y1, label='Line 1')
plt.plot(x, y2, label='Line 2')
plt.legend()
plt.show()
Output:
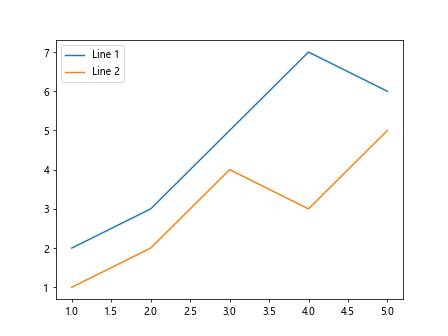
在这个示例代码中,我们创建了两条折线,分别对应y1和y2,然后通过label参数给它们分别取了名字。最后调用plt.legend()来显示图例。
示例代码2:调整图例位置
import matplotlib.pyplot as plt

x = [1, 2, 3, 4, 5]
y1 = [2, 3, 5, 7, 6]
y2 = [1, 2, 4, 3, 5]

plt.plot(x, y1, label='Line 1')
plt.plot(x, y2, label='Line 2')
plt.legend(loc='upper right')
plt.show()
Output:
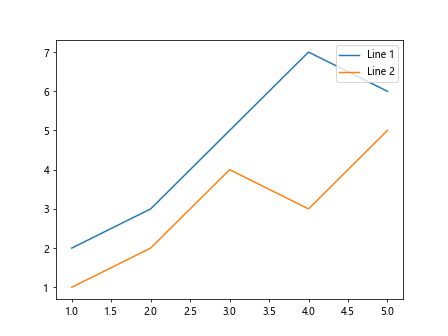
在这个示例代码中,我们通过传入loc='upper right'参数,将图例显示在右上角。
示例代码3:调整图例标题
import matplotlib.pyplot as plt

x = [1, 2, 3, 4, 5]
y1 = [2, 3, 5, 7, 6]
y2 = [1, 2, 4, 3, 5]

plt.plot(x, y1, label='Line 1')
plt.plot(x, y2, label='Line 2')
plt.legend(title='Legend Title')
plt.show()
Output:
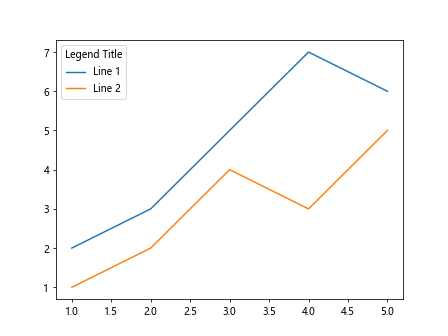
在这个示例代码中,我们通过传入title='Legend Title'参数,将图例标题设为’Legend Title’。
示例代码4:调整图例样式
import matplotlib.pyplot as plt

x = [1, 2, 3, 4, 5]
y1 = [2, 3, 5, 7, 6]
y2 = [1, 2, 4, 3, 5]

plt.plot(x, y1, label='Line 1', linestyle='--')
plt.plot(x, y2, label='Line 2', linestyle='-.')
plt.legend()
plt.show()
Output:
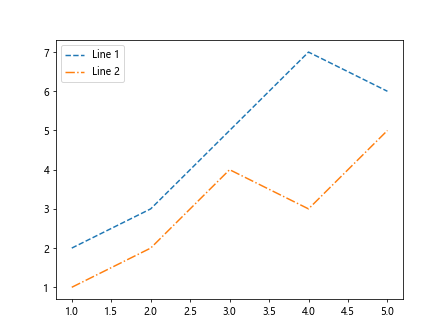
在这个示例代码中,我们通过传入linestyle='--'和linestyle='-.'参数,分别将两条折线的样式调整为虚线和点划线。
示例代码5:调整图例字体和大小
import matplotlib.pyplot as plt

x = [1, 2, 3, 4, 5]
y1 = [2, 3, 5, 7, 6]
y2 = [1, 2, 4, 3, 5]

plt.plot(x, y1, label='Line 1')
plt.plot(x, y2, label='Line 2')
plt.legend(fontsize='large', title_fontsize='medium')
plt.show()
Output:
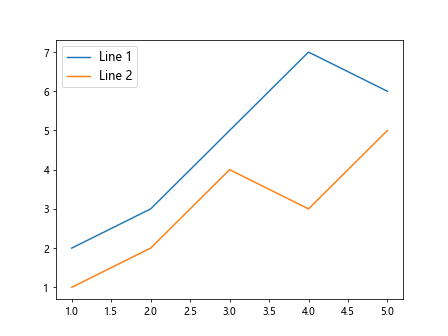
在这个示例代码中,我们通过传入fontsize='large'和title_fontsize='medium'参数,调整了图例的字体大小。
示例代码6:隐藏图例
import matplotlib.pyplot as plt

x = [1, 2, 3, 4, 5]
y1 = [2, 3, 5, 7, 6]
y2 = [1, 2, 4, 3, 5]

plt.plot(x, y1, label='Line 1')
plt.plot(x, y2, label='Line 2')
plt.legend().set_visible(False)
plt.show()
Output:
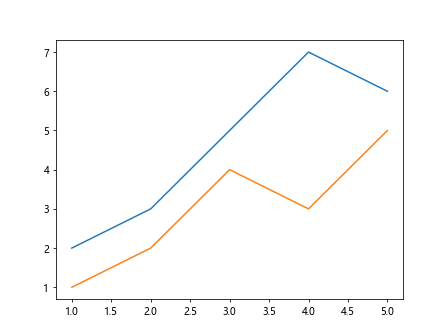
在这个示例代码中,我们使用plt.legend().set_visible(False)将图例隐藏起来。
示例代码7:设置图例边框样式
import matplotlib.pyplot as plt

x = [1, 2, 3, 4, 5]
y1 = [2, 3, 5, 7, 6]
y2 = [1, 2, 4, 3, 5]

plt.plot(x, y1, label='Line 1')
plt.plot(x, y2, label='Line 2')
plt.legend(frameon=True, edgecolor='black')
plt.show()
Output:
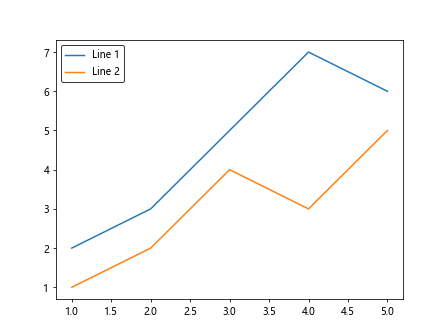
在这个示例代码中,我们通过传入frameon=True和edgecolor='black'参数,设置了图例的边框为黑色。
示例代码8:调整图例标签显示顺序
import matplotlib.pyplot as plt

x = [1, 2, 3, 4, 5]
y1 = [2, 3, 5, 7, 6]
y2 = [1, 2, 4, 3, 5]

plt.plot(x, y1, label='Line 1')
plt.plot(x, y2, label='Line 2')
plt.legend(reversed=True)
plt.show()
在这个示例代码中,我们通过传入reversed=True参数,将图例标签的显示顺序反转。
示例代码9:设置图例的透明度
import matplotlib.pyplot as plt

x = [1, 2, 3, 4, 5]
y1 = [2, 3, 5, 7, 6]
y2 = [1, 2, 4, 3, 5]

plt.plot(x, y1, label='Line 1')
plt.plot(x, y2, label='Line 2')
plt.legend(alpha=0.5)
plt.show()
在这个示例代码中,我们通过传入alpha=0.5参数,设置图例的透明度为0.5。
示例代码10:自定义图例位置
import matplotlib.pyplot as plt

x = [1, 2, 3, 4, 5]
y1 = [2, 3, 5, 7, 6]
y2 = [1, 2, 4, 3, 5]

plt.plot(x, y1, linestyle='--')
plt.plot(x, y2, linestyle='-.')
plt.legend(['Line 1', 'Line 2'], loc=(0.5, 0.5))
plt.show()
Output:
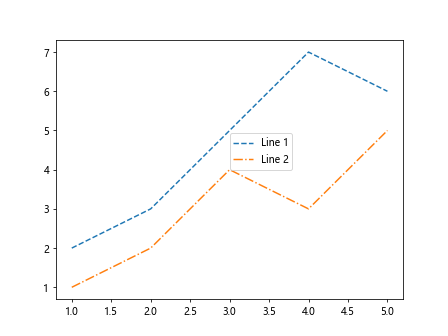
在这个示例代码中,我们通过传入loc=(0.5, 0.5)参数,将图例位置设置在0.5,0.5这个位置。
通过以上示例代码,我们可以看到在Matplotlib中添加图例是非常简单和灵活的,通过传入不同的参数,我们可以更好地控制图例的显示效果。
 极客笔记
极客笔记