如何在Matplotlib中绘制混淆矩阵
参考: How can I plot a confusion matrix in matplotlib
混淆矩阵是一种特别的矩阵,用于可视化机器学习算法的性能,特别是在分类问题中。它展示了实际类别与模型预测类别之间的关系。在本文中,我们将详细介绍如何使用Matplotlib库在Python中绘制混淆矩阵,并提供10-20个示例代码,帮助你理解和掌握这一过程。
基本概念
在开始绘制混淆矩阵之前,我们需要了解一些基本概念。混淆矩阵是一个方阵,其中行表示实际类别,列表示预测类别。每个单元格中的数值表示预测结果与实际类别的匹配程度。混淆矩阵的主对角线上的值表示正确分类的数量,而非对角线上的值表示错误分类的数量。
示例代码
以下是使用Matplotlib绘制混淆矩阵的示例代码。每个示例都是独立的,可以直接运行。
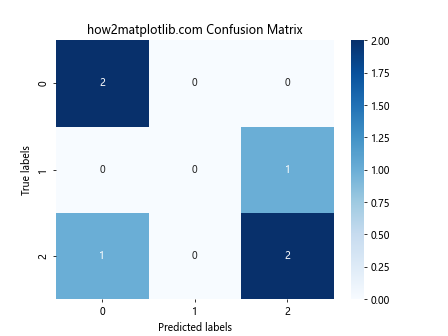
示例1:基础混淆矩阵绘制
import matplotlib.pyplot as plt
from sklearn.metrics import confusion_matrix
import seaborn as sns
import numpy as np

# 假设的真实标签和预测标签
y_true = [2, 0, 2, 2, 0, 1]
y_pred = [0, 0, 2, 2, 0, 2]

# 计算混淆矩阵
conf_mat = confusion_matrix(y_true, y_pred)

# 绘制混淆矩阵
fig, ax = plt.subplots()
sns.heatmap(conf_mat, annot=True, fmt='d', cmap='Blues', ax=ax)
ax.set_title('how2matplotlib.com Confusion Matrix')
ax.set_xlabel('Predicted labels')
ax.set_ylabel('True labels')
plt.show()
Output:
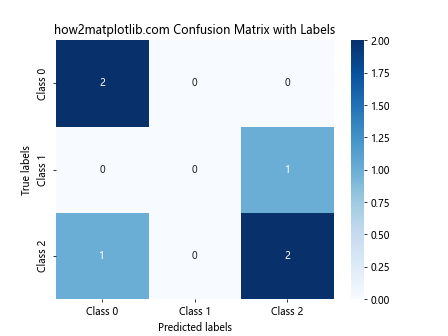
示例2:添加类别标签
import matplotlib.pyplot as plt
from sklearn.metrics import confusion_matrix
import seaborn as sns
import numpy as np

# 假设的真实标签和预测标签
y_true = [2, 0, 2, 2, 0, 1]
y_pred = [0, 0, 2, 2, 0, 2]
classes = ['Class 0', 'Class 1', 'Class 2']

# 计算混淆矩阵
conf_mat = confusion_matrix(y_true, y_pred)

# 绘制混淆矩阵
fig, ax = plt.subplots()
sns.heatmap(conf_mat, annot=True, fmt='d', cmap='Blues', ax=ax, xticklabels=classes, yticklabels=classes)
ax.set_title('how2matplotlib.com Confusion Matrix with Labels')
ax.set_xlabel('Predicted labels')
ax.set_ylabel('True labels')
plt.show()
Output:
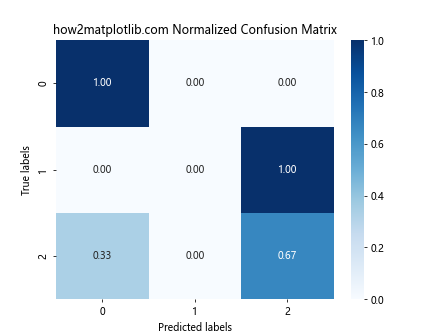
示例3:归一化混淆矩阵
import matplotlib.pyplot as plt
from sklearn.metrics import confusion_matrix
import seaborn as sns
import numpy as np

# 假设的真实标签和预测标签
y_true = [2, 0, 2, 2, 0, 1]
y_pred = [0, 0, 2, 2, 0, 2]

# 计算混淆矩阵并归一化
conf_mat = confusion_matrix(y_true, y_pred)
conf_mat_normalized = conf_mat.astype('float') / conf_mat.sum(axis=1)[:, np.newaxis]

# 绘制归一化混淆矩阵
fig, ax = plt.subplots()
sns.heatmap(conf_mat_normalized, annot=True, fmt='.2f', cmap='Blues', ax=ax)
ax.set_title('how2matplotlib.com Normalized Confusion Matrix')
ax.set_xlabel('Predicted labels')
ax.set_ylabel('True labels')
plt.show()
Output:
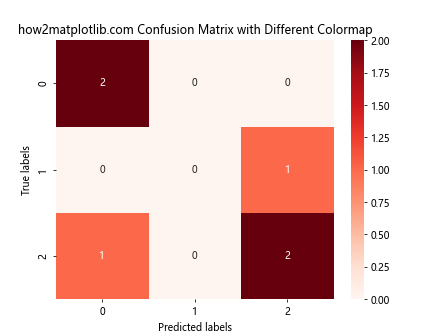
示例4:改变颜色映射
import matplotlib.pyplot as plt
from sklearn.metrics import confusion_matrix
import seaborn as sns
import numpy as np

# 假设的真实标签和预测标签
y_true = [2, 0, 2, 2, 0, 1]
y_pred = [0, 0, 2, 2, 0, 2]

# 计算混淆矩阵
conf_mat = confusion_matrix(y_true, y_pred)

# 绘制混淆矩阵,改变颜色映射
fig, ax = plt.subplots()
sns.heatmap(conf_mat, annot=True, fmt='d', cmap='Reds', ax=ax)
ax.set_title('how2matplotlib.com Confusion Matrix with Different Colormap')
ax.set_xlabel('Predicted labels')
ax.set_ylabel('True labels')
plt.show()
Output:
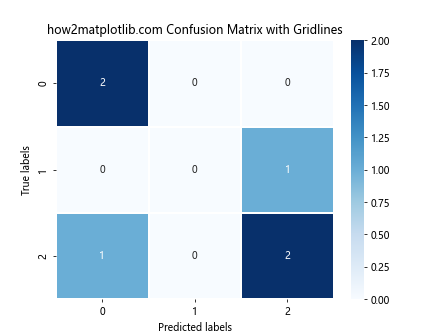
示例5:添加网格线
import matplotlib.pyplot as plt
from sklearn.metrics import confusion_matrix
import seaborn as sns
import numpy as np

# 假设的真实标签和预测标签
y_true = [2, 0, 2, 2, 0, 1]
y_pred = [0, 0, 2, 2, 0, 2]

# 计算混淆矩阵
conf_mat = confusion_matrix(y_true, y_pred)

# 绘制混淆矩阵,添加网格线
fig, ax = plt.subplots()
sns.heatmap(conf_mat, annot=True, fmt='d', cmap='Blues', ax=ax, linewidths=.5)
ax.set_title('how2matplotlib.com Confusion Matrix with Gridlines')
ax.set_xlabel('Predicted labels')
ax.set_ylabel('True labels')
plt.show()
Output:
示例6:改变注释颜色
import matplotlib.pyplot as plt
from sklearn.metrics import confusion_matrix
import seaborn as sns
import numpy as np

# 假设的真实标签和预测标签
y_true = [2, 0, 2, 2, 0, 1]
y_pred = [0, 0, 2, 2, 0, 2]

# 计算混淆矩阵
conf_mat = confusion_matrix(y_true, y_pred)

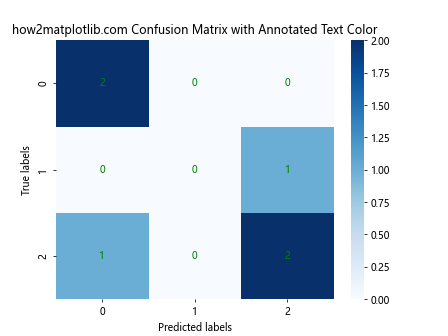
# 绘制混淆矩阵,改变注释颜色
fig, ax = plt.subplots()
sns.heatmap(conf_mat, annot=True, fmt='d', cmap='Blues', ax=ax, annot_kws={"color": "green"})
ax.set_title('how2matplotlib.com Confusion Matrix with Annotated Text Color')
ax.set_xlabel('Predicted labels')
ax.set_ylabel('True labels')
plt.show()
Output:
示例7:改变字体大小
import matplotlib.pyplot as plt
from sklearn.metrics import confusion_matrix
import seaborn as sns
import numpy as np

# 假设的真实标签和预测标签
y_true = [2, 0, 2, 2, 0, 1]
y_pred = [0, 0, 2, 2, 0, 2]

# 计算混淆矩阵
conf_mat = confusion_matrix(y_true, y_pred)

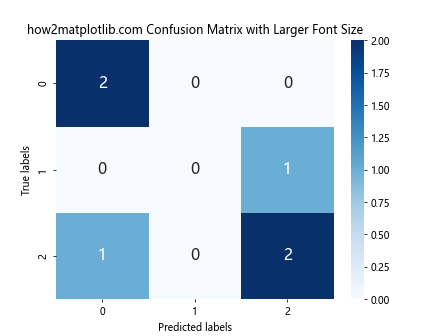
# 绘制混淆矩阵,改变字体大小
fig, ax = plt.subplots()
sns.heatmap(conf_mat, annot=True, fmt='d', cmap='Blues', ax=ax, annot_kws={"size": 16})
ax.set_title('how2matplotlib.com Confusion Matrix with Larger Font Size')
ax.set_xlabel('Predicted labels')
ax.set_ylabel('True labels')
plt.show()
Output:
示例8:调整颜色条
import matplotlib.pyplot as plt
from sklearn.metrics import confusion_matrix
import seaborn as sns
import numpy as np

# 假设的真实标签和预测标签
y_true = [2, 0, 2, 2, 0, 1]
y_pred = [0, 0, 2, 2, 0, 2]

# 计算混淆矩阵
conf_mat = confusion_matrix(y_true, y_pred)

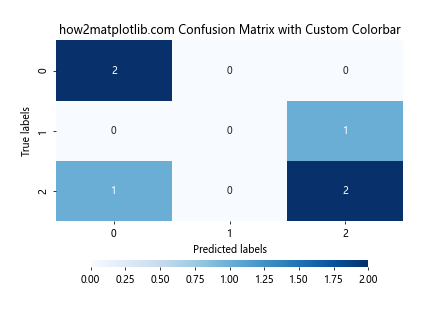
# 绘制混淆矩阵,调整颜色条
fig, ax = plt.subplots()
cbar_kws = {"orientation": "horizontal", "shrink": 0.8, "aspect": 40}
sns.heatmap(conf_mat, annot=True, fmt='d', cmap='Blues', ax=ax, cbar_kws=cbar_kws)
ax.set_title('how2matplotlib.com Confusion Matrix with Custom Colorbar')
ax.set_xlabel('Predicted labels')
ax.set_ylabel('True labels')
plt.show()
Output:
 极客笔记
极客笔记