Matplotlib轴刻度标签格式化:从数字到千位和百万位的完整指南
参考:Formatting Axis Tick Labels: From Numbers to Thousands and Millions
在数据可视化中,正确格式化轴刻度标签对于清晰地传达信息至关重要。Matplotlib作为Python中最流行的绘图库之一,提供了多种方法来自定义轴刻度标签的格式。本文将深入探讨如何使用Matplotlib将轴刻度标签从普通数字格式化为更易读的千位和百万位表示。我们将涵盖多种技术,包括内置函数、自定义格式化器以及更高级的方法,以满足各种数据可视化需求。
1. 使用内置函数进行基本格式化
Matplotlib提供了一些内置函数,可以轻松地对轴刻度标签进行基本格式化。这些函数位于matplotlib.ticker模块中,使用它们可以快速实现常见的格式化需求。
1.1 使用FuncFormatter
FuncFormatter是一个强大的工具,它允许我们定义自定义函数来格式化刻度标签。以下是一个简单的例子,展示如何使用FuncFormatter将数字格式化为千位表示:
import matplotlib.pyplot as plt
import numpy as np
from matplotlib.ticker import FuncFormatter

def thousands_formatter(x, pos):
    return f'{x/1000:.1f}K'

fig, ax = plt.subplots(figsize=(10, 6))
x = np.linspace(0, 10000, 100)
y = np.sin(x/1000) * 5000 + 5000

ax.plot(x, y, label='how2matplotlib.com')
ax.yaxis.set_major_formatter(FuncFormatter(thousands_formatter))
ax.set_title('Using FuncFormatter for Thousands')
ax.set_xlabel('X-axis')
ax.set_ylabel('Y-axis (Thousands)')
ax.legend()
plt.show()
Output:
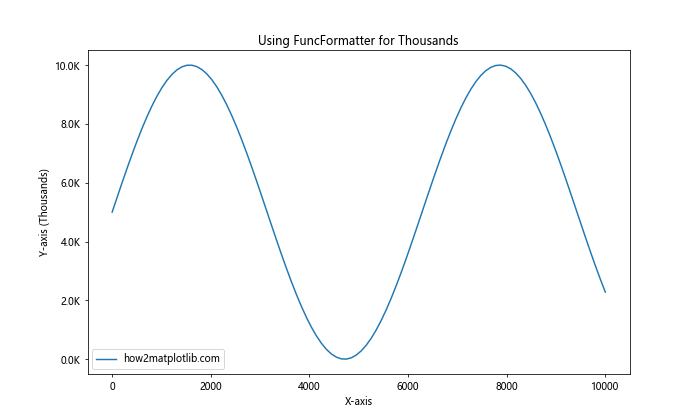
在这个例子中,我们定义了一个thousands_formatter函数,它将输入值除以1000并添加”K”后缀。然后,我们使用FuncFormatter将这个函数应用到y轴上。这样,y轴的刻度标签就会以千位形式显示。
1.2 使用ScalarFormatter
ScalarFormatter是另一个有用的格式化器,它可以自动处理科学记数法和大数字的表示。以下是一个使用ScalarFormatter的例子:
import matplotlib.pyplot as plt
import numpy as np
from matplotlib.ticker import ScalarFormatter

fig, ax = plt.subplots(figsize=(10, 6))
x = np.logspace(0, 9, 100)
y = x**2

ax.plot(x, y, label='how2matplotlib.com')
ax.set_xscale('log')
ax.set_yscale('log')

formatter = ScalarFormatter(useMathText=True)
formatter.set_scientific(True)
formatter.set_powerlimits((-1, 1))

ax.xaxis.set_major_formatter(formatter)
ax.yaxis.set_major_formatter(formatter)

ax.set_title('Using ScalarFormatter for Large Numbers')
ax.set_xlabel('X-axis')
ax.set_ylabel('Y-axis')
ax.legend()
plt.show()
Output:
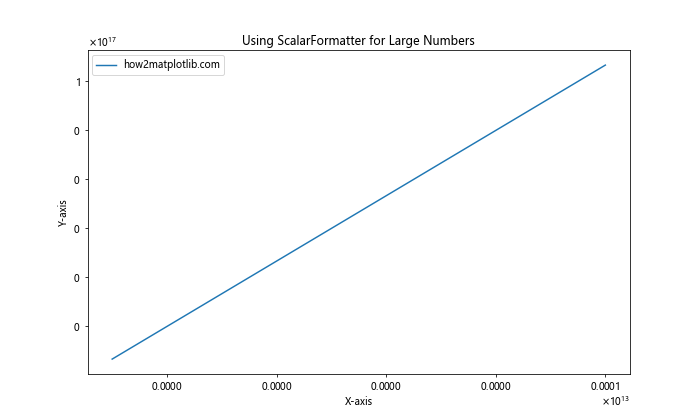
在这个例子中,我们使用ScalarFormatter来处理对数刻度上的大数字。通过设置useMathText=True,我们可以使用LaTeX风格的数学文本来表示指数。set_scientific(True)和set_powerlimits((-1, 1))用于控制何时使用科学记数法。
2. 自定义格式化器
虽然内置函数可以满足许多基本需求,但有时我们需要更高度的自定义。在这种情况下,我们可以创建自己的格式化器类。
2.1 创建自定义千位和百万位格式化器
以下是一个自定义格式化器的例子,它可以根据数值大小自动选择使用千位(K)或百万位(M)表示:
import matplotlib.pyplot as plt
import numpy as np
from matplotlib.ticker import Formatter

class CustomFormatter(Formatter):
    def __call__(self, x, pos=None):
        if x >= 1e6:
            return f'{x/1e6:.1f}M'
        elif x >= 1e3:
            return f'{x/1e3:.1f}K'
        else:
            return f'{x:.0f}'

fig, ax = plt.subplots(figsize=(10, 6))
x = np.linspace(0, 1e7, 100)
y = np.sin(x/1e6) * 5e6 + 5e6

ax.plot(x, y, label='how2matplotlib.com')
ax.yaxis.set_major_formatter(CustomFormatter())
ax.set_title('Custom Formatter for Thousands and Millions')
ax.set_xlabel('X-axis')
ax.set_ylabel('Y-axis')
ax.legend()
plt.show()
Output:
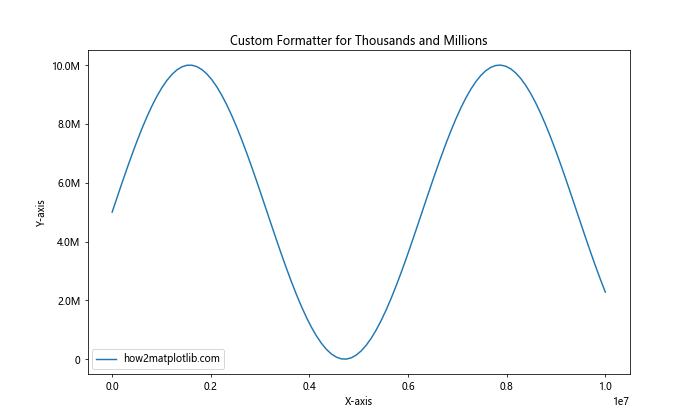
这个自定义格式化器根据数值的大小自动选择合适的表示方式。对于大于或等于1百万的数值,它使用”M”后缀;对于大于或等于1千但小于1百万的数值,它使用”K”后缀;对于小于1千的数值,它保持原样。
2.2 使用lambda函数进行简单格式化
对于一些简单的格式化需求,我们可以使用lambda函数结合FuncFormatter来快速实现:
import matplotlib.pyplot as plt
import numpy as np
from matplotlib.ticker import FuncFormatter

fig, ax = plt.subplots(figsize=(10, 6))
x = np.linspace(0, 1e6, 100)
y = np.sin(x/1e5) * 5e5 + 5e5

ax.plot(x, y, label='how2matplotlib.com')
ax.yaxis.set_major_formatter(FuncFormatter(lambda x, p: f'{x/1e6:.1f}M'))
ax.set_title('Using Lambda Function for Millions')
ax.set_xlabel('X-axis')
ax.set_ylabel('Y-axis (Millions)')
ax.legend()
plt.show()
Output:
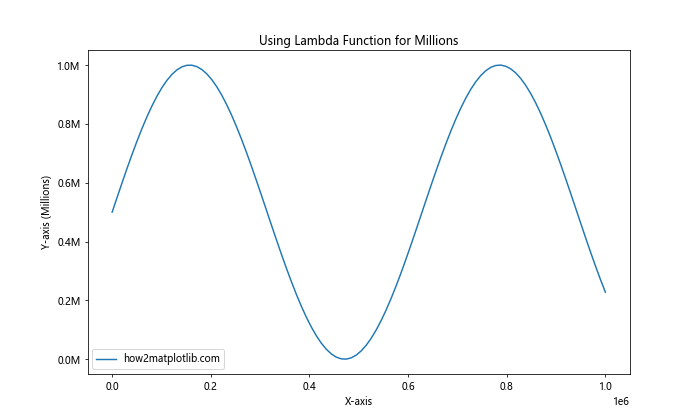
这个例子使用了一个简单的lambda函数来将y轴的刻度标签格式化为百万位表示。这种方法适用于快速实现简单的格式化需求。
3. 高级格式化技巧
除了基本的格式化方法,Matplotlib还提供了一些高级技巧,可以帮助我们更精细地控制刻度标签的格式。
3.1 使用StrMethodFormatter
StrMethodFormatter允许我们使用字符串格式化方法来定制刻度标签。这是一个非常灵活的选项,特别适合需要精确控制格式的情况:
import matplotlib.pyplot as plt
import numpy as np
from matplotlib.ticker import StrMethodFormatter

fig, ax = plt.subplots(figsize=(10, 6))
x = np.linspace(0, 1e6, 100)
y = np.sin(x/1e5) * 5e5 + 5e5

ax.plot(x, y, label='how2matplotlib.com')
ax.yaxis.set_major_formatter(StrMethodFormatter('{x:.2f}'))
ax.set_title('Using StrMethodFormatter')
ax.set_xlabel('X-axis')
ax.set_ylabel('Y-axis')
ax.legend()
plt.show()
Output:
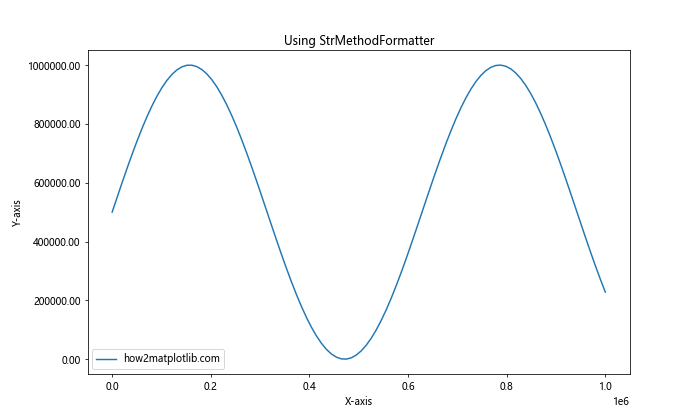
在这个例子中,我们使用StrMethodFormatter将y轴的刻度标签格式化为保留两位小数的形式。这种方法提供了极大的灵活性,允许我们使用Python的字符串格式化语法来定制标签。
3.2 结合多种格式化器
有时,我们可能需要在同一个图表中使用不同的格式化方式。以下是一个结合多种格式化器的例子:
import matplotlib.pyplot as plt
import numpy as np
from matplotlib.ticker import FuncFormatter, StrMethodFormatter

def custom_formatter(x, pos):
    if x >= 1e6:
        return f'{x/1e6:.1f}M'
    elif x >= 1e3:
        return f'{x/1e3:.1f}K'
    else:
        return f'{x:.0f}'

fig, (ax1, ax2) = plt.subplots(1, 2, figsize=(15, 6))

x = np.linspace(0, 1e7, 100)
y1 = np.sin(x/1e6) * 5e6 + 5e6
y2 = np.cos(x/1e6) * 5e3 + 5e3

ax1.plot(x, y1, label='how2matplotlib.com (Millions)')
ax1.yaxis.set_major_formatter(FuncFormatter(custom_formatter))
ax1.set_title('Custom Formatter for Large Numbers')
ax1.set_xlabel('X-axis')
ax1.set_ylabel('Y-axis')
ax1.legend()

ax2.plot(x, y2, label='how2matplotlib.com (Thousands)')
ax2.yaxis.set_major_formatter(StrMethodFormatter('{x:.0f}'))
ax2.set_title('StrMethodFormatter for Smaller Numbers')
ax2.set_xlabel('X-axis')
ax2.set_ylabel('Y-axis')
ax2.legend()

plt.tight_layout()
plt.show()
Output:
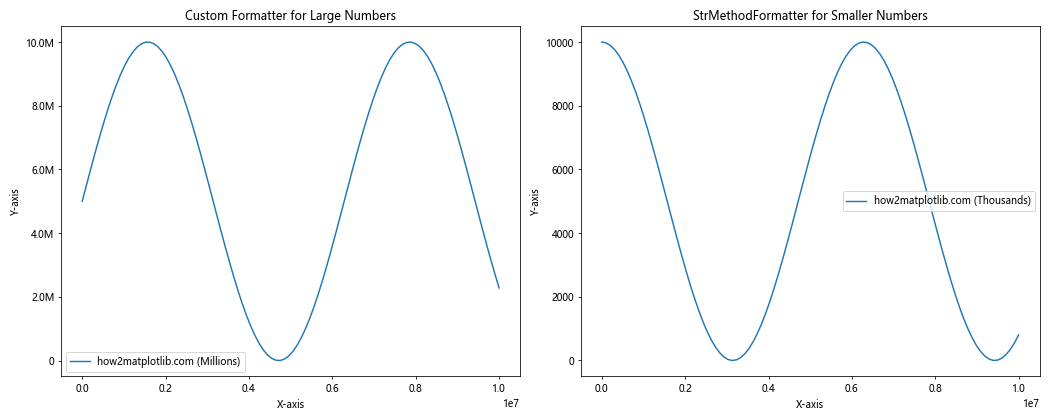
这个例子展示了如何在一个图表中使用两种不同的格式化方式。左侧的子图使用自定义格式化器来处理大数字,而右侧的子图使用StrMethodFormatter来格式化较小的数字。
4. 处理特殊情况
在某些情况下,我们可能需要处理一些特殊的格式化需求,比如处理负数、零值或者非常大的数字。
4.1 处理负数和零值
当处理包含负数和零值的数据时,我们需要特别注意格式化方式。以下是一个处理这种情况的例子:
import matplotlib.pyplot as plt
import numpy as np
from matplotlib.ticker import FuncFormatter

def format_with_sign(x, pos):
    if x == 0:
        return '0'
    elif abs(x) >= 1e6:
        return f'{x/1e6:+.1f}M'
    elif abs(x) >= 1e3:
        return f'{x/1e3:+.1f}K'
    else:
        return f'{x:+.0f}'

fig, ax = plt.subplots(figsize=(10, 6))
x = np.linspace(-1e7, 1e7, 100)
y = np.sin(x/1e6) * 5e6

ax.plot(x, y, label='how2matplotlib.com')
ax.yaxis.set_major_formatter(FuncFormatter(format_with_sign))
ax.set_title('Handling Negative Numbers and Zero')
ax.set_xlabel('X-axis')
ax.set_ylabel('Y-axis')
ax.legend()
plt.show()
Output:
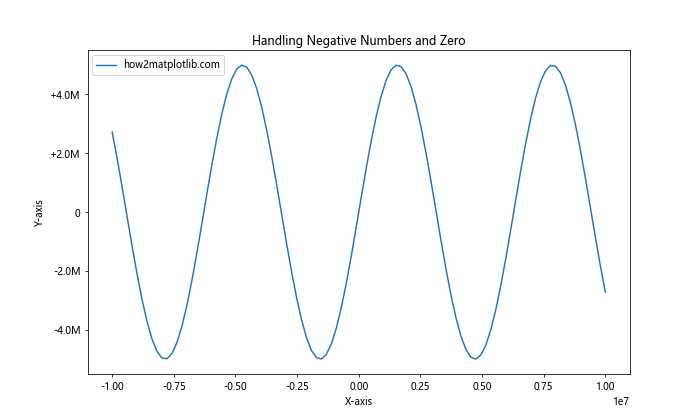
这个例子中的格式化函数特别处理了零值,并为所有非零值添加了正负号。这种方法在处理包含正负值的数据集时特别有用。
4.2 处理非常大的数字
当处理非常大的数字时,我们可能需要使用更高级的单位,如十亿(B)或万亿(T)。以下是一个处理这种情况的例子:
import matplotlib.pyplot as plt
import numpy as np
from matplotlib.ticker import FuncFormatter

def format_large_numbers(x, pos):
    if abs(x) >= 1e12:
        return f'{x/1e12:.1f}T'
    elif abs(x) >= 1e9:
        return f'{x/1e9:.1f}B'
    elif abs(x) >= 1e6:
        return f'{x/1e6:.1f}M'
    elif abs(x) >= 1e3:
        return f'{x/1e3:.1f}K'
    else:
        return f'{x:.0f}'

fig, ax = plt.subplots(figsize=(10, 6))
x = np.logspace(0, 15, 100)
y = x**2

ax.plot(x, y, label='how2matplotlib.com')
ax.set_xscale('log')
ax.set_yscale('log')
ax.xaxis.set_major_formatter(FuncFormatter(format_large_numbers))
ax.yaxis.set_major_formatter(FuncFormatter(format_large_numbers))
ax.set_title('Handling Very Large Numbers')
ax.set_xlabel('X-axis')
ax.set_ylabel('Y-axis')
ax.legend()
plt.show()
Output:
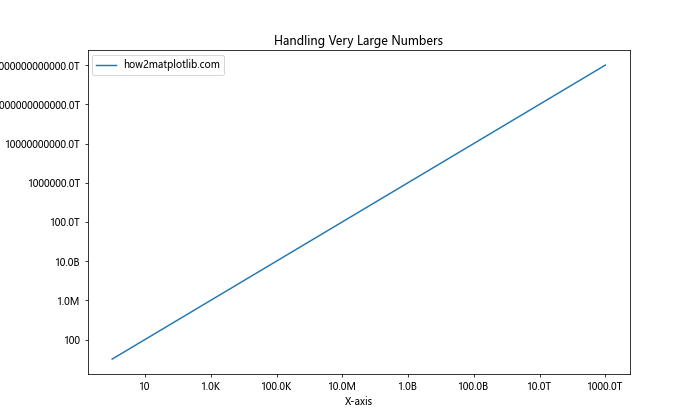
这个例子展示了如何处理从千位到万亿级别的大数字。格式化函数根据数值的大小自动选择合适的单位,使得图表更易读。
5. 结合其他Matplotlib功能
格式化轴刻度标签通常需要与其他Matplotlib功能结合使用,以创建更加信息丰富和美观的图表。
5.1 使用双轴图
有时,我们可能需要在同一个图表中显示不同尺度的数据。这时可以使用双轴图,并为每个轴设置不同的格式化器:
import matplotlib.pyplot as plt
import numpy as np
from matplotlib.ticker import FuncFormatter

def format_thousands(x, pos):
    return f'{x/1000:.1f}K'

def format_millions(x, pos):
    return f'{x/1e6:.1f}M'

fig, ax1 = plt.subplots(figsize=(10, 6))
x = np.linspace(0, 100, 100)
y1 = np.exp(x/10) * 1000
y2 = np.sin(x/10) * 5e6 + 5e6

color = 'tab:red'
ax1.set_xlabel('X-axis')
ax1.set_ylabel('Y1 (Thousands)', color=color)
ax1.plot(x, y1, color=color, label='how2matplotlib.com (Y1)')
ax1.tick_params(axis='y', labelcolor=color)
ax1.yaxis.set_major_formatter(FuncFormatter(format_thousands))

ax2 = ax1.twinx()  # 创建共享x轴的第二个y轴
color = 'tab:blue'
ax2.set_ylabel('Y2 (Millions)', color=color)
ax2.plot(x, y2, color=color, label='how2matplotlib.com (Y2)')
ax2.tick_params(axis='y', labelcolor=color)
ax2.yaxis.set_major_formatter(FuncFormatter(format_millions))

fig.tight_layout()
plt.title('Dual Axis with Different Formatters')
fig.legend(loc='upper left', bbox_to_anchor=(0.1, 0.9))
plt.show()
Output:
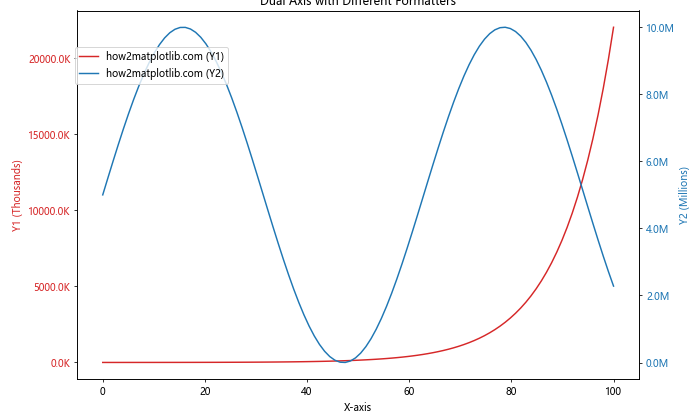
这个例子展示了如何创建一个双轴图,其中左侧y轴以千位格式显示,右侧y轴以百万位格式显示。这种方法允许我们在同一个图表中比较不同尺度的数据。
5.2 结合颜色映射
我们还可以将格式化的轴刻度标签与颜色映射结合使用,以创建更加丰富的可视化效果:
import matplotlib.pyplot as plt
import numpy as np
from matplotlib.ticker import FuncFormatter

def format_millions(x, pos):
    return f'{x/1e6:.1f}M'

fig, ax = plt.subplots(figsize=(10, 6))
x = np.linspace(0, 10, 100)
y = np.linspace(0, 10, 100)
X, Y = np.meshgrid(x, y)
Z = np.sin(X) * np.cos(Y) * 1e6

c = ax.pcolormesh(X, Y, Z, cmap='viridis', shading='auto')
ax.set_title('Combining Formatted Labels with Colormap')
ax.set_xlabel('X-axis')
ax.set_ylabel('Y-axis')

cbar = fig.colorbar(c, ax=ax)
cbar.set_label('Values (Millions)')
cbar.formatter = FuncFormatter(format_millions)
cbar.update_ticks()

plt.text(5, -1, 'how2matplotlib.com', ha='center', va='center')
plt.show()
Output:
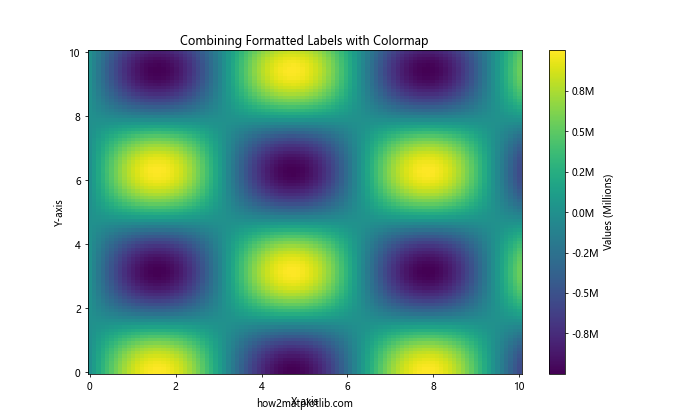
在这个例子中,我们创建了一个热图,并使用自定义格式化器来格式化颜色条的刻度标签。这种方法可以帮助读者更直观地理解数据的量级。
6. 处理时间序列数据
在处理时间序列数据时,格式化日期和时间标签也是一个常见的需求。Matplotlib提供了专门的工具来处理这种情况。
6.1 使用DateFormatter
DateFormatter是一个专门用于格式化日期和时间的工具。以下是一个使用DateFormatter的例子:
import matplotlib.pyplot as plt
import numpy as np
from matplotlib.dates import DateFormatter
import datetime

start_date = datetime.datetime(2023, 1, 1)
dates = [start_date + datetime.timedelta(days=i) for i in range(365)]
values = np.cumsum(np.random.randn(365)) * 1e6 + 5e6

fig, ax = plt.subplots(figsize=(12, 6))
ax.plot(dates, values, label='how2matplotlib.com')

ax.xaxis.set_major_formatter(DateFormatter('%Y-%m-%d'))
plt.gcf().autofmt_xdate()  # 自动格式化x轴日期标签

ax.yaxis.set_major_formatter(plt.FuncFormatter(lambda x, p: f'{x/1e6:.1f}M'))

ax.set_title('Time Series Data with Formatted Date and Value Labels')
ax.set_xlabel('Date')
ax.set_ylabel('Value (Millions)')
ax.legend()

plt.show()
Output:
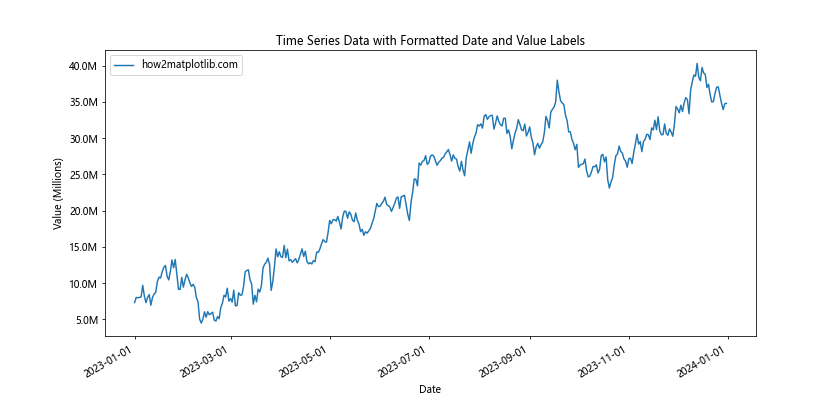
这个例子展示了如何格式化x轴的日期标签和y轴的数值标签。DateFormatter用于格式化日期,而自定义的FuncFormatter用于格式化y轴的百万位数值。
6.2 处理不同时间尺度
当处理跨越不同时间尺度的数据时,我们可能需要根据数据的时间跨度动态调整日期格式:
import matplotlib.pyplot as plt
import numpy as np
from matplotlib.dates import DateFormatter, AutoDateLocator
import datetime

def create_time_series(start, end, freq):
    dates = pd.date_range(start, end, freq=freq)
    values = np.cumsum(np.random.randn(len(dates))) * 1e6 + 5e6
    return dates, values

fig, (ax1, ax2) = plt.subplots(2, 1, figsize=(12, 10))

# 日尺度数据
dates1, values1 = create_time_series('2023-01-01', '2023-12-31', 'D')
ax1.plot(dates1, values1, label='how2matplotlib.com (Daily)')
ax1.xaxis.set_major_formatter(DateFormatter('%Y-%m-%d'))
ax1.xaxis.set_major_locator(AutoDateLocator())

# 年尺度数据
dates2, values2 = create_time_series('2000-01-01', '2023-12-31', 'Y')
ax2.plot(dates2, values2, label='how2matplotlib.com (Yearly)')
ax2.xaxis.set_major_formatter(DateFormatter('%Y'))
ax2.xaxis.set_major_locator(AutoDateLocator())

for ax in (ax1, ax2):
    ax.yaxis.set_major_formatter(plt.FuncFormatter(lambda x, p: f'{x/1e6:.1f}M'))
    ax.set_ylabel('Value (Millions)')
    ax.legend()

ax1.set_title('Daily Time Series')
ax2.set_title('Yearly Time Series')

plt.gcf().autofmt_xdate()
plt.tight_layout()
plt.show()
这个例子展示了如何处理不同时间尺度的数据。上面的子图显示日尺度的数据,使用”%Y-%m-%d”格式;下面的子图显示年尺度的数据,仅使用”%Y”格式。AutoDateLocator用于自动选择合适的日期间隔。
7. 高级自定义技巧
对于一些特殊的可视化需求,我们可能需要更高级的自定义技巧。
7.1 动态调整格式
有时,我们可能需要根据数据的范围动态调整格式。以下是一个根据数据范围动态选择单位的例子:
import matplotlib.pyplot as plt
import numpy as np
from matplotlib.ticker import FuncFormatter

def dynamic_formatter(x, pos):
    if abs(x) >= 1e9:
        return f'{x/1e9:.1f}B'
    elif abs(x) >= 1e6:
        return f'{x/1e6:.1f}M'
    elif abs(x) >= 1e3:
        return f'{x/1e3:.1f}K'
    else:
        return f'{x:.0f}'

fig, (ax1, ax2) = plt.subplots(1, 2, figsize=(15, 6))

# 较小范围的数据
x1 = np.linspace(0, 1e5, 100)
y1 = np.sin(x1/1e4) * 5e4 + 5e4
ax1.plot(x1, y1, label='how2matplotlib.com (Small Range)')
ax1.yaxis.set_major_formatter(FuncFormatter(dynamic_formatter))
ax1.set_title('Dynamic Formatting (Small Range)')
ax1.set_xlabel('X-axis')
ax1.set_ylabel('Y-axis')
ax1.legend()

# 较大范围的数据
x2 = np.linspace(0, 1e9, 100)
y2 = np.sin(x2/1e8) * 5e8 + 5e8
ax2.plot(x2, y2, label='how2matplotlib.com (Large Range)')
ax2.yaxis.set_major_formatter(FuncFormatter(dynamic_formatter))
ax2.set_title('Dynamic Formatting (Large Range)')
ax2.set_xlabel('X-axis')
ax2.set_ylabel('Y-axis')
ax2.legend()

plt.tight_layout()
plt.show()
Output:
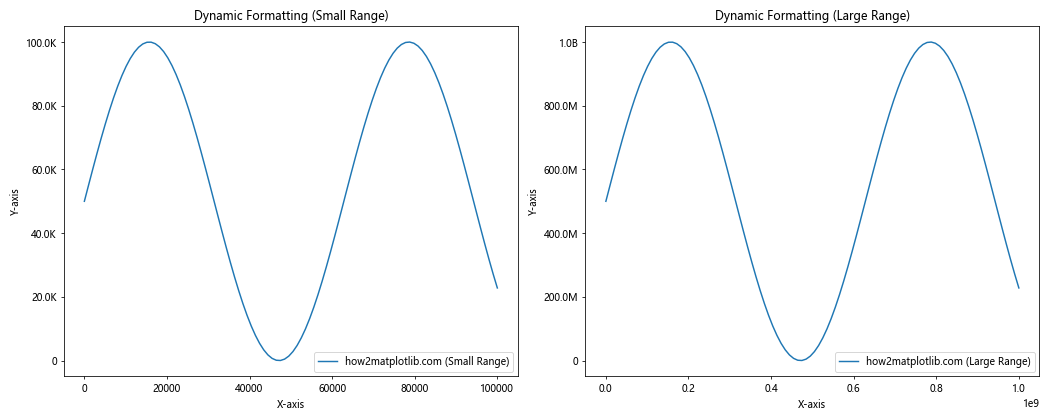
这个例子展示了如何创建一个动态格式化器,它可以根据数据的范围自动选择合适的单位(K、M或B)。这种方法在处理不同量级的数据时特别有用。
7.2 自定义刻度位置
除了格式化刻度标签,我们还可以自定义刻度的位置:
import matplotlib.pyplot as plt
import numpy as np
from matplotlib.ticker import FuncFormatter, FixedLocator

def custom_formatter(x, pos):
    if x >= 1e6:
        return f'{x/1e6:.1f}M'
    elif x >= 1e3:
        return f'{x/1e3:.1f}K'
    else:
        return f'{x:.0f}'

fig, ax = plt.subplots(figsize=(10, 6))
x = np.linspace(0, 1e7, 100)
y = np.sin(x/1e6) * 5e6 + 5e6

ax.plot(x, y, label='how2matplotlib.com')
ax.yaxis.set_major_formatter(FuncFormatter(custom_formatter))

# 自定义刻度位置
custom_ticks = [0, 2e6, 5e6, 7e6, 1e7]
ax.yaxis.set_major_locator(FixedLocator(custom_ticks))

ax.set_title('Custom Tick Positions and Formatting')
ax.set_xlabel('X-axis')
ax.set_ylabel('Y-axis')
ax.legend()

plt.show()
Output:
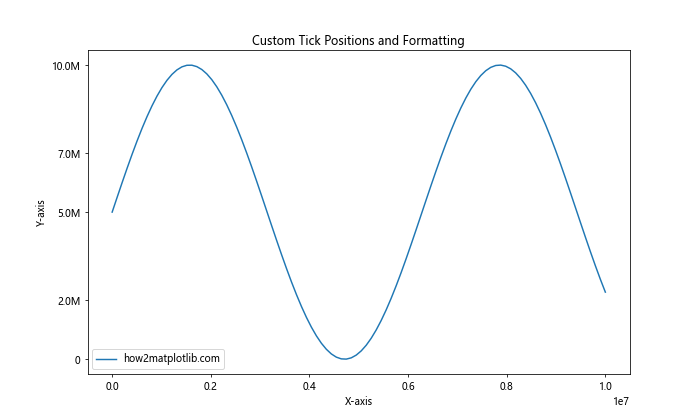
这个例子展示了如何使用FixedLocator来设置自定义的刻度位置,同时使用自定义格式化器来格式化这些刻度的标签。
8. 最佳实践和注意事项
在使用Matplotlib进行轴刻度标签格式化时,有一些最佳实践和注意事项需要考虑:
- 保持一致性:在整个图表或一系列相关图表中保持格式的一致性,这有助于读者更容易理解和比较数据。
-
避免过度格式化:虽然格式化可以提高可读性,但过度格式化可能会分散读者对数据本身的注意力。保持简洁和清晰是关键。
-
考虑数据范围:选择合适的格式化方式时,要考虑数据的范围。对于跨越多个数量级的数据,使用动态格式化可能更合适。
-
注意性能:对于大量数据点的图表,复杂的格式化函数可能会影响渲染性能。在这种情况下,可以考虑使用更简单的格式化方法或减少刻度的数量。
-
适应不同的输出格式:如果图表需要以不同的格式(如打印、屏幕显示、网页嵌入等)输出,确保选择的格式化方式在所有情况下都清晰可读。
-
处理特殊值:在格式化时要考虑如何处理特殊值,如零、负数或极端值。
-
国际化考虑:如果图表将用于国际受众,考虑使用适合不同地区的数字格式(如使用逗号或点作为千位分隔符)。
-
结合其他可视化元素:格式化应该与图表的其他元素(如标题、图例、注释等)协调一致,共同提高图表的整体可读性。
9. 总结
Matplotlib提供了丰富的工具和方法来格式化轴刻度标签,从简单的内置函数到高度自定义的格式化器。通过合理使用这些工具,我们可以大大提高数据可视化的清晰度和可读性。
本文详细介绍了从基本的数字格式化到处理千位、百万位甚至更大数值的各种技术。我们探讨了如何使用内置函数、创建自定义格式化器、处理特殊情况,以及如何将格式化技术与其他Matplotlib功能结合使用。
关键点包括:
– 使用FuncFormatter和ScalarFormatter进行基本格式化
– 创建自定义格式化器以满足特定需求
– 处理负数、零值和非常大的数字
– 结合其他Matplotlib功能,如双轴图和颜色映射
– 处理时间序列数据的特殊格式化需求
– 动态调整格式以适应不同范围的数据
– 自定义刻度位置以优化数据展示
通过掌握这些技术,数据科学家和可视化专家可以创建更加清晰、专业和信息丰富的图表,有效地传达复杂的数据信息。记住,好的数据可视化不仅仅是展示数据,更是讲述数据背后的故事。通过适当的轴刻度标签格式化,我们可以确保这个故事被清晰而准确地讲述出来。
 极客笔记
极客笔记