Matplotlib fmt errorbar
参考:fmt errorbar
在matplotlib中,errorbar是一种用来展示数据集中的不确定性的图表类型。它通过在数据点周围绘制误差线来表示数据的误差范围。而fmt参数可以用来指定误差线的样式,例如颜色、线型和标记。在本文中,我们将详细介绍如何使用fmt参数来自定义errorbar的样式。
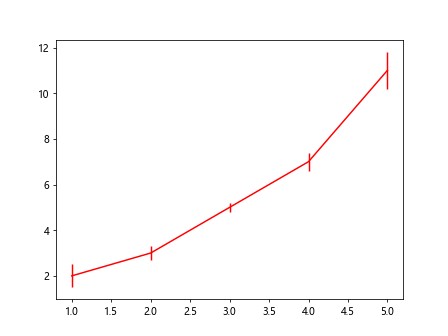
示例1:设置误差线的颜色
import matplotlib.pyplot as plt

x = [1, 2, 3, 4, 5]
y = [2, 3, 5, 7, 11]
yerr = [0.5, 0.3, 0.2, 0.4, 0.8]

plt.errorbar(x, y, yerr=yerr, fmt='r')  # 设置误差线颜色为红色
plt.show()
Output:
示例2:设置误差线的线型
import matplotlib.pyplot as plt

x = [1, 2, 3, 4, 5]
y = [2, 3, 5, 7, 11]
yerr = [0.5, 0.3, 0.2, 0.4, 0.8]

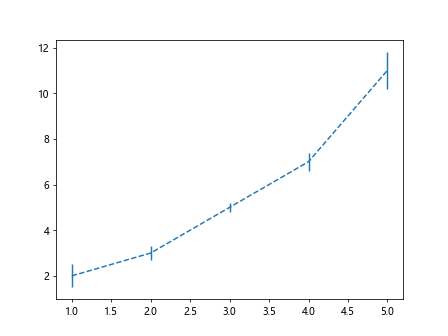
plt.errorbar(x, y, yerr=yerr, fmt='--')  # 设置误差线线型为虚线
plt.show()
Output:
示例3:设置误差线的标记
import matplotlib.pyplot as plt

x = [1, 2, 3, 4, 5]
y = [2, 3, 5, 7, 11]
yerr = [0.5, 0.3, 0.2, 0.4, 0.8]

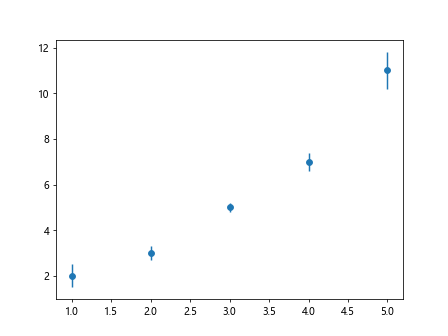
plt.errorbar(x, y, yerr=yerr, fmt='o')  # 设置误差线标记为圆形
plt.show()
Output:
示例4:结合颜色、线型和标记
import matplotlib.pyplot as plt

x = [1, 2, 3, 4, 5]
y = [2, 3, 5, 7, 11]
yerr = [0.5, 0.3, 0.2, 0.4, 0.8]

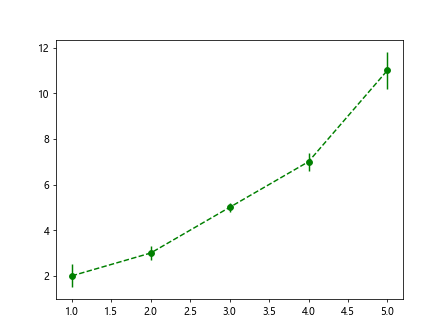
plt.errorbar(x, y, yerr=yerr, fmt='g--o')  # 设置误差线颜色为绿色,线型为虚线,标记为圆形
plt.show()
Output:
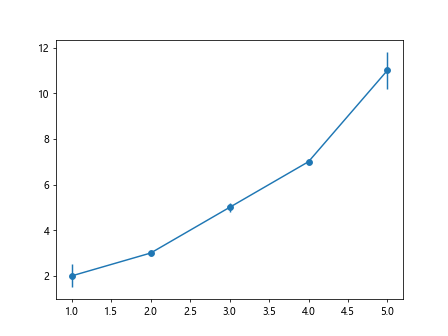
示例5:隐藏误差线的标记
import matplotlib.pyplot as plt

x = [1, 2, 3, 4, 5]
y = [2, 3, 5, 7, 11]
yerr = [0.5, 0.3, 0.2, 0.4, 0.8]

plt.errorbar(x, y, yerr=yerr, fmt='-o', errorevery=2)  # 设置误差线标记为实线,每隔2个数据点显示一个标记
plt.show()
Output:
示例6:设置误差线的宽度
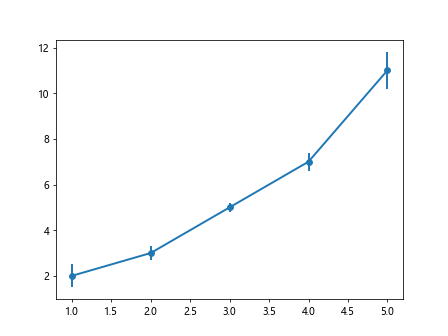
import matplotlib.pyplot as plt

x = [1, 2, 3, 4, 5]
y = [2, 3, 5, 7, 11]
yerr = [0.5, 0.3, 0.2, 0.4, 0.8]

plt.errorbar(x, y, yerr=yerr, fmt='-o', linewidth=2)  # 设置误差线宽度为2
plt.show()
Output:
示例7:自定义误差线的标记大小
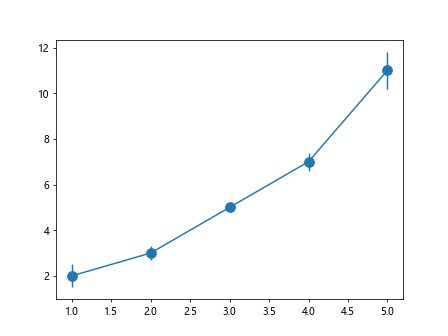
import matplotlib.pyplot as plt

x = [1, 2, 3, 4, 5]
y = [2, 3, 5, 7, 11]
yerr = [0.5, 0.3, 0.2, 0.4, 0.8]

plt.errorbar(x, y, yerr=yerr, fmt='-o', markersize=10)  # 设置误差线标记大小为10
plt.show()
Output:
示例8:使用标记线类型
import matplotlib.pyplot as plt

x = [1, 2, 3, 4, 5]
y = [2, 3, 5, 7, 11]
yerr = [0.5, 0.3, 0.2, 0.4, 0.8]

plt.errorbar(x, y, yerr=yerr, fmt='-o', marker='x')  # 使用叉叉标记
plt.show()
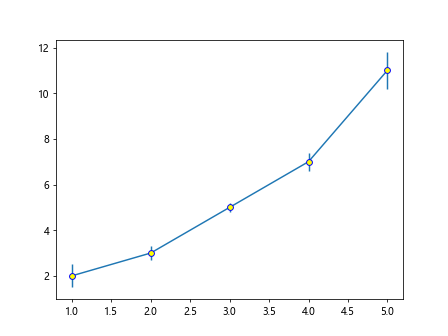
示例9:自定义误差线的标记边缘颜色和填充颜色
import matplotlib.pyplot as plt

x = [1, 2, 3, 4, 5]
y = [2, 3, 5, 7, 11]
yerr = [0.5, 0.3, 0.2, 0.4, 0.8]

plt.errorbar(x, y, yerr=yerr, fmt='-o', markeredgecolor='blue', markerfacecolor='yellow')  # 设置误差线标记边缘颜色为蓝色,填充颜色为黄色
plt.show()
Output:
示例10:自定义误差线的标记形状
import matplotlib.pyplot as plt

x = [1, 2, 3, 4, 5]
y = [2, 3, 5, 7, 11]
yerr = [0.5, 0.3, 0.2, 0.4, 0.8]

plt.errorbar(x, y, yerr=yerr, fmt='-s')  # 设置误差线标记为方形
plt.show()
Output:
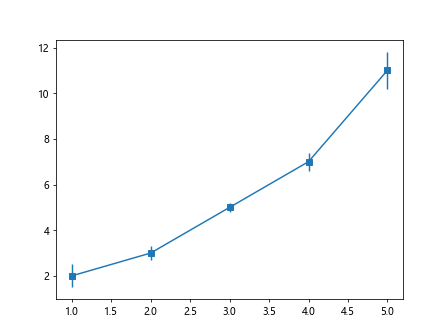
通过以上示例代码,我们可以看到如何使用fmt参数来自定义errorbar的样式。通过调整颜色、线型、标记等参数,我们可以根据自己的需求来定制不同风格的误差线图表。
 极客笔记
极客笔记