使用Matplotlib在Python中绘制非结构化三角网格等高线图
参考:Draw contours on an unstructured triangular grid in Python using Matplotlib
非结构化三角网格是一种常用于数值模拟和科学计算的网格类型。在这种网格上绘制等高线可以帮助我们直观地理解数据分布和变化趋势。本文将详细介绍如何使用Python的Matplotlib库在非结构化三角网格上绘制等高线图。我们将从基础概念开始,逐步深入到高级技巧,帮助读者全面掌握这一绘图技术。
1. 非结构化三角网格简介
非结构化三角网格是由不规则分布的点和连接这些点的三角形单元组成的网格。与结构化网格相比,非结构化网格具有更好的灵活性,可以更好地适应复杂的几何形状和边界条件。
1.1 非结构化三角网格的特点
- 灵活性:可以适应复杂的几何形状
- 局部加密:可以在感兴趣的区域增加网格密度
- 不规则性:节点分布和单元形状不规则
1.2 创建简单的非结构化三角网格
让我们从一个简单的例子开始,创建一个基本的非结构化三角网格:
import numpy as np
import matplotlib.pyplot as plt
from matplotlib.tri import Triangulation

# 创建随机点
np.random.seed(42)
x = np.random.rand(20)
y = np.random.rand(20)

# 创建三角剖分
tri = Triangulation(x, y)

# 绘制三角网格
plt.figure(figsize=(8, 6))
plt.triplot(tri, 'bo-')
plt.title('Simple Unstructured Triangular Grid - how2matplotlib.com')
plt.xlabel('X')
plt.ylabel('Y')
plt.show()
Output:
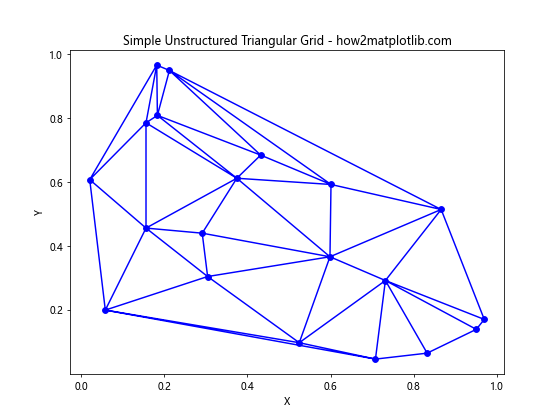
在这个例子中,我们首先创建了20个随机点,然后使用Matplotlib的Triangulation类自动生成三角剖分。triplot函数用于绘制三角网格,其中’bo-‘参数指定了绘图样式(蓝色圆点和线条)。
2. 在非结构化三角网格上生成数据
为了绘制等高线,我们需要在网格上定义一个函数值。通常,这些值来自实际测量或数值模拟。在这个例子中,我们将创建一个简单的二维函数来生成数据。
2.1 创建示例函数
让我们定义一个简单的二维高斯函数:
import numpy as np
import matplotlib.pyplot as plt
from matplotlib.tri import Triangulation

def gaussian_2d(x, y, x0, y0, sigma):
    return np.exp(-((x - x0)**2 + (y - y0)**2) / (2 * sigma**2))

# 创建网格点
np.random.seed(42)
x = np.random.rand(100)
y = np.random.rand(100)

# 计算函数值
z = gaussian_2d(x, y, 0.5, 0.5, 0.2)

# 创建三角剖分
tri = Triangulation(x, y)

# 绘制散点图
plt.figure(figsize=(8, 6))
plt.scatter(x, y, c=z, cmap='viridis')
plt.colorbar(label='Z Value')
plt.title('2D Gaussian Function on Unstructured Grid - how2matplotlib.com')
plt.xlabel('X')
plt.ylabel('Y')
plt.show()
Output:
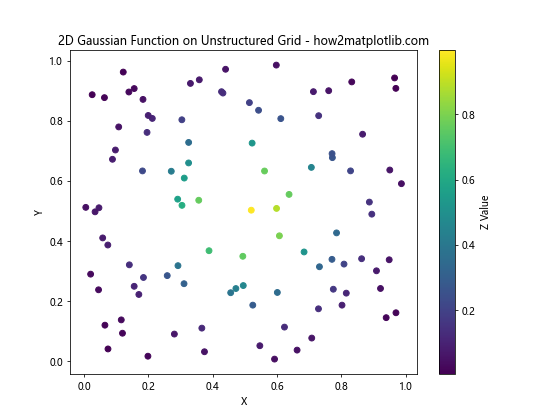
在这个例子中,我们定义了一个二维高斯函数,并在随机生成的100个点上计算了函数值。我们使用散点图来可视化这些点,颜色表示函数值的大小。
3. 绘制基本等高线图
现在我们有了网格和数据,可以开始绘制等高线图了。Matplotlib提供了tricontour和tricontourf函数,分别用于绘制线条等高线和填充等高线。
3.1 使用tricontour绘制线条等高线
import numpy as np
import matplotlib.pyplot as plt
from matplotlib.tri import Triangulation

def gaussian_2d(x, y, x0, y0, sigma):
    return np.exp(-((x - x0)**2 + (y - y0)**2) / (2 * sigma**2))

np.random.seed(42)
x = np.random.rand(100)
y = np.random.rand(100)
z = gaussian_2d(x, y, 0.5, 0.5, 0.2)

tri = Triangulation(x, y)

plt.figure(figsize=(8, 6))
contour = plt.tricontour(tri, z, levels=10, colors='k')
plt.clabel(contour, inline=True, fontsize=8)
plt.title('Contour Lines on Unstructured Grid - how2matplotlib.com')
plt.xlabel('X')
plt.ylabel('Y')
plt.colorbar(contour, label='Z Value')
plt.show()
Output:
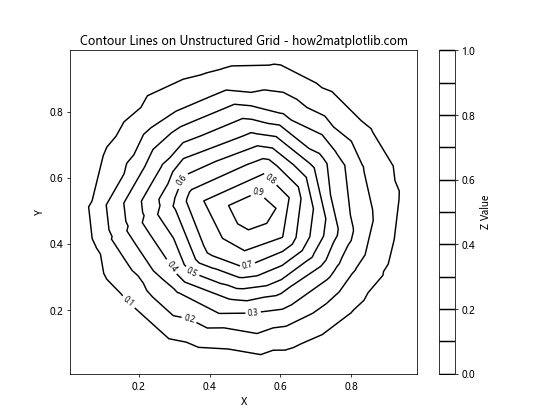
在这个例子中,我们使用tricontour函数绘制了10条等高线。colors='k'参数指定等高线为黑色。clabel函数用于在等高线上添加标签。
3.2 使用tricontourf绘制填充等高线
import numpy as np
import matplotlib.pyplot as plt
from matplotlib.tri import Triangulation

def gaussian_2d(x, y, x0, y0, sigma):
    return np.exp(-((x - x0)**2 + (y - y0)**2) / (2 * sigma**2))

np.random.seed(42)
x = np.random.rand(100)
y = np.random.rand(100)
z = gaussian_2d(x, y, 0.5, 0.5, 0.2)

tri = Triangulation(x, y)

plt.figure(figsize=(8, 6))
contourf = plt.tricontourf(tri, z, levels=20, cmap='viridis')
plt.title('Filled Contours on Unstructured Grid - how2matplotlib.com')
plt.xlabel('X')
plt.ylabel('Y')
plt.colorbar(contourf, label='Z Value')
plt.show()
Output:
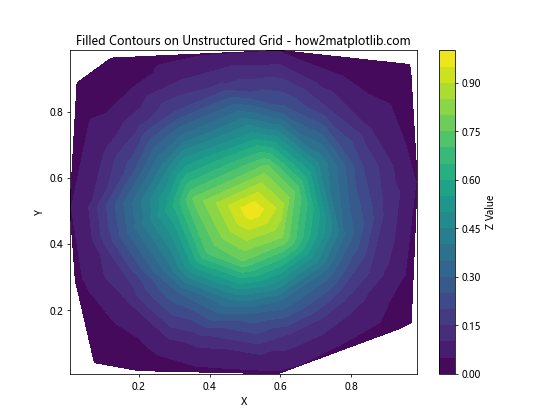
这个例子使用tricontourf函数绘制了填充等高线。levels=20参数指定了20个等高线级别,cmap='viridis'指定了颜色映射。
4. 自定义等高线图
我们可以通过调整各种参数来自定义等高线图的外观和风格。
4.1 自定义等高线级别
import numpy as np
import matplotlib.pyplot as plt
from matplotlib.tri import Triangulation

def gaussian_2d(x, y, x0, y0, sigma):
    return np.exp(-((x - x0)**2 + (y - y0)**2) / (2 * sigma**2))

np.random.seed(42)
x = np.random.rand(100)
y = np.random.rand(100)
z = gaussian_2d(x, y, 0.5, 0.5, 0.2)

tri = Triangulation(x, y)

plt.figure(figsize=(8, 6))
levels = [0.1, 0.3, 0.5, 0.7, 0.9]
contour = plt.tricontour(tri, z, levels=levels, colors='k')
plt.clabel(contour, inline=True, fontsize=8, fmt='%.2f')
plt.title('Custom Contour Levels - how2matplotlib.com')
plt.xlabel('X')
plt.ylabel('Y')
plt.colorbar(contour, label='Z Value')
plt.show()
Output:
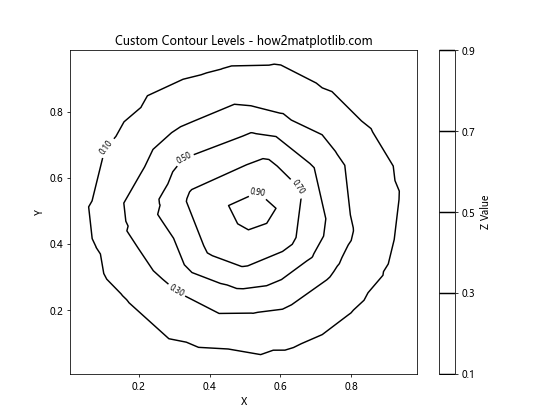
在这个例子中,我们通过levels参数指定了自定义的等高线级别。fmt='%.2f'参数用于控制等高线标签的格式。
4.2 自定义等高线颜色和样式
import numpy as np
import matplotlib.pyplot as plt
from matplotlib.tri import Triangulation

def gaussian_2d(x, y, x0, y0, sigma):
    return np.exp(-((x - x0)**2 + (y - y0)**2) / (2 * sigma**2))

np.random.seed(42)
x = np.random.rand(100)
y = np.random.rand(100)
z = gaussian_2d(x, y, 0.5, 0.5, 0.2)

tri = Triangulation(x, y)

plt.figure(figsize=(8, 6))
levels = [0.1, 0.3, 0.5, 0.7, 0.9]
colors = ['blue', 'green', 'yellow', 'orange', 'red']
linestyles = ['solid', 'dashed', 'dashdot', 'dotted', 'solid']

contour = plt.tricontour(tri, z, levels=levels, colors=colors, linestyles=linestyles, linewidths=2)
plt.clabel(contour, inline=True, fontsize=8, fmt='%.2f')
plt.title('Custom Contour Colors and Styles - how2matplotlib.com')
plt.xlabel('X')
plt.ylabel('Y')
plt.colorbar(contour, label='Z Value')
plt.show()
Output:
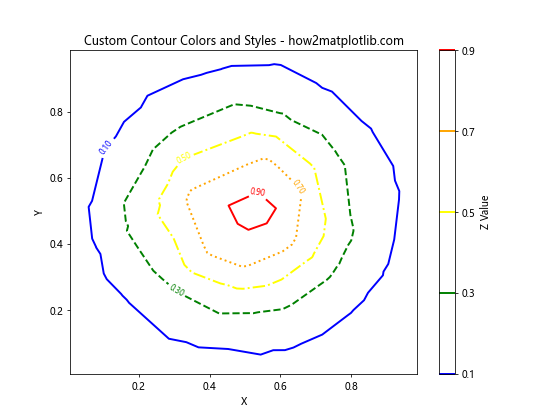
这个例子展示了如何为不同的等高线级别指定不同的颜色和线型。linewidths参数用于设置线条宽度。
5. 结合等高线和其他绘图元素
等高线图通常与其他绘图元素结合使用,以提供更多信息或增强可视化效果。
5.1 结合等高线和散点图
import numpy as np
import matplotlib.pyplot as plt
from matplotlib.tri import Triangulation

def gaussian_2d(x, y, x0, y0, sigma):
    return np.exp(-((x - x0)**2 + (y - y0)**2) / (2 * sigma**2))

np.random.seed(42)
x = np.random.rand(100)
y = np.random.rand(100)
z = gaussian_2d(x, y, 0.5, 0.5, 0.2)

tri = Triangulation(x, y)

plt.figure(figsize=(8, 6))
contourf = plt.tricontourf(tri, z, levels=20, cmap='viridis', alpha=0.7)
plt.scatter(x, y, c='red', s=10, alpha=0.5)
plt.title('Contours with Scatter Plot - how2matplotlib.com')
plt.xlabel('X')
plt.ylabel('Y')
plt.colorbar(contourf, label='Z Value')
plt.show()
Output:
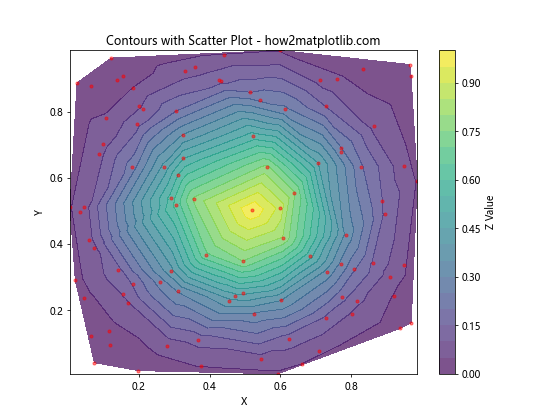
在这个例子中,我们在填充等高线图上叠加了一个散点图,以显示原始数据点的位置。alpha参数用于调整透明度。
5.2 结合等高线和向量场
import numpy as np
import matplotlib.pyplot as plt
from matplotlib.tri import Triangulation

def gaussian_2d(x, y, x0, y0, sigma):
    return np.exp(-((x - x0)**2 + (y - y0)**2) / (2 * sigma**2))

np.random.seed(42)
x = np.random.rand(50)
y = np.random.rand(50)
z = gaussian_2d(x, y, 0.5, 0.5, 0.2)

# 计算梯度作为向量场
dx = -2 * (x - 0.5) * z / 0.2**2
dy = -2 * (y - 0.5) * z / 0.2**2

tri = Triangulation(x, y)

plt.figure(figsize=(8, 6))
contour = plt.tricontour(tri, z, levels=10, colors='k', linewidths=0.5)
plt.quiver(x, y, dx, dy, scale=20, color='red', alpha=0.7)
plt.title('Contours with Vector Field - how2matplotlib.com')
plt.xlabel('X')
plt.ylabel('Y')
plt.colorbar(contour, label='Z Value')
plt.show()
Output:
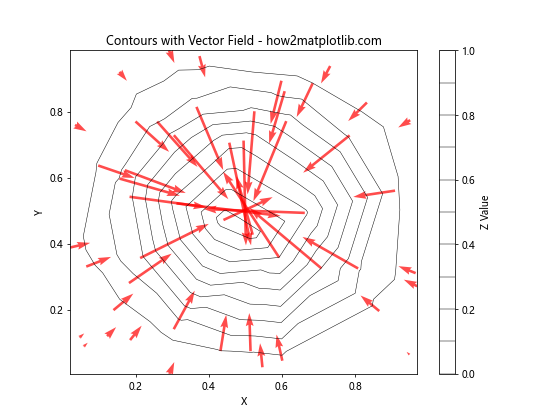
这个例子展示了如何在等高线图上叠加向量场。我们使用高斯函数的梯度作为向量场,quiver函数用于绘制箭头。
6. 处理不规则边界
在实际应用中,我们可能需要处理具有不规则边界的区域。Matplotlib提供了一些工具来处理这种情况。
6.1 使用掩码处理不规则边界
import numpy as np
import matplotlib.pyplot as plt
from matplotlib.tri import Triangulation

def gaussian_2d(x, y, x0, y0, sigma):
    return np.exp(-((x - x0)**2 + (y - y0)**2) / (2 * sigma**2))

np.random.seed(42)
x = np.random.rand(200)
y = np.random.rand(200)
z = gaussian_2d(x, y, 0.5, 0.5, 0.2)

tri = Triangulation(x, y)

# 创建一个圆形掩码
mask = (x - 0.5)**2 + (y - 0.5)**2 > 0.2**2
tri.set_mask(mask)

plt.figure(figsize=(8, 6))
contourf = plt.tricontourf(tri, z, levels=20, cmap='viridis')
plt.triplot(tri, 'k-', lw=0.5, alpha=0.3)
plt.title('Contours with Irregular Boundary - how2matplotlib.com')
plt.xlabel('X')
plt.ylabel('Y')
plt.colorbar(contourf, label='Z Value')
plt.show()
在这个例子中,我们创建了一个圆形掩码来模拟不规则边界。set_mask方法用于应用掩码到三角剖分上。
6.2 使用多边形边界
6.2 使用多边形边界
有时,我们可能需要在一个具有复杂多边形边界的区域内绘制等高线。以下是一个示例:
import numpy as np
import matplotlib.pyplot as plt
from matplotlib.tri import Triangulation
from matplotlib.path import Path

def gaussian_2d(x, y, x0, y0, sigma):
    return np.exp(-((x - x0)**2 + (y - y0)**2) / (2 * sigma**2))

# 定义多边形边界
boundary = np.array([(0, 0), (1, 0), (1, 1), (0.5, 0.8), (0, 1)])
path = Path(boundary)

# 生成点并过滤
np.random.seed(42)
x = np.random.rand(500)
y = np.random.rand(500)
points = np.column_stack((x, y))
mask = path.contains_points(points)
x, y = x[mask], y[mask]

z = gaussian_2d(x, y, 0.5, 0.5, 0.2)

tri = Triangulation(x, y)

plt.figure(figsize=(8, 6))
contourf = plt.tricontourf(tri, z, levels=20, cmap='viridis')
plt.plot(*boundary.T, 'r-', lw=2)
plt.title('Contours within Polygon Boundary - how2matplotlib.com')
plt.xlabel('X')
plt.ylabel('Y')
plt.colorbar(contourf, label='Z Value')
plt.show()
Output:
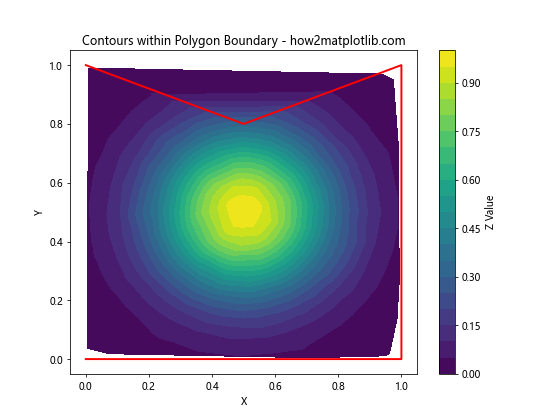
在这个例子中,我们首先定义了一个多边形边界,然后使用Path.contains_points方法来过滤出位于边界内的点。这样我们就可以在任意形状的区域内绘制等高线了。
7. 高级技巧
7.1 插值到更细的网格
有时,我们可能希望在更细的网格上绘制等高线,以获得更平滑的结果。我们可以使用插值技术来实现这一点:
import numpy as np
import matplotlib.pyplot as plt
from matplotlib.tri import Triangulation, LinearTriInterpolator
from scipy.interpolate import griddata

def gaussian_2d(x, y, x0, y0, sigma):
    return np.exp(-((x - x0)**2 + (y - y0)**2) / (2 * sigma**2))

np.random.seed(42)
x = np.random.rand(100)
y = np.random.rand(100)
z = gaussian_2d(x, y, 0.5, 0.5, 0.2)

# 创建更细的网格
xi = np.linspace(0, 1, 200)
yi = np.linspace(0, 1, 200)
xi, yi = np.meshgrid(xi, yi)

# 使用griddata进行插值
zi = griddata((x, y), z, (xi, yi), method='cubic')

plt.figure(figsize=(12, 5))

# 原始数据的等高线图
plt.subplot(121)
tri = Triangulation(x, y)
plt.tricontourf(tri, z, levels=20, cmap='viridis')
plt.title('Original Contours - how2matplotlib.com')
plt.xlabel('X')
plt.ylabel('Y')

# 插值后的等高线图
plt.subplot(122)
plt.contourf(xi, yi, zi, levels=20, cmap='viridis')
plt.title('Interpolated Contours - how2matplotlib.com')
plt.xlabel('X')
plt.ylabel('Y')

plt.tight_layout()
plt.show()
Output:
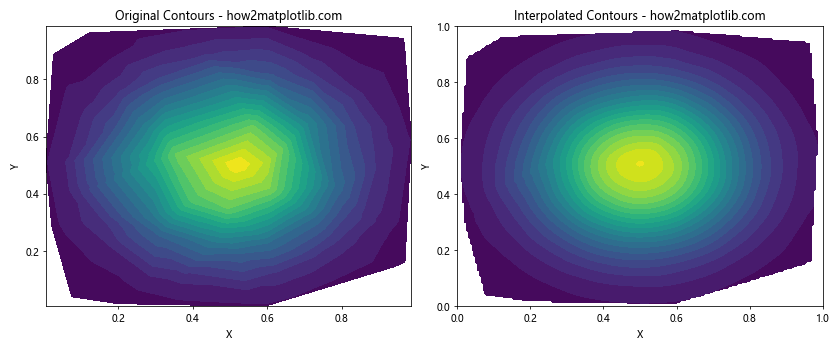
这个例子展示了如何使用scipy.interpolate.griddata函数将非结构化网格数据插值到规则网格上,从而获得更平滑的等高线图。
7.2 添加阴影效果
为了增强等高线图的视觉效果,我们可以添加阴影来模拟光照效果:
import numpy as np
import matplotlib.pyplot as plt
from matplotlib.tri import Triangulation
from matplotlib.colors import LightSource

def gaussian_2d(x, y, x0, y0, sigma):
    return np.exp(-((x - x0)**2 + (y - y0)**2) / (2 * sigma**2))

np.random.seed(42)
x = np.random.rand(500)
y = np.random.rand(500)
z = gaussian_2d(x, y, 0.5, 0.5, 0.2)

tri = Triangulation(x, y)

# 创建光源
ls = LightSource(azdeg=315, altdeg=45)

plt.figure(figsize=(8, 6))
rgb = ls.shade(z, plt.cm.viridis)
plt.tripcolor(tri, z, shading='gouraud', facecolors=rgb)
plt.tricontour(tri, z, levels=10, colors='k', linewidths=0.5, alpha=0.5)
plt.title('Contours with Shading - how2matplotlib.com')
plt.xlabel('X')
plt.ylabel('Y')
plt.colorbar(label='Z Value')
plt.show()
在这个例子中,我们使用LightSource类来创建光照效果,然后将其应用到颜色映射上。这种技术可以帮助突出数据的三维结构。
8. 处理大规模数据
当处理大规模数据时,直接绘制所有点可能会导致性能问题。在这种情况下,我们可以采用一些策略来优化绘图过程。
8.1 数据抽样
对于大型数据集,我们可以通过随机抽样来减少点的数量:
import numpy as np
import matplotlib.pyplot as plt
from matplotlib.tri import Triangulation

def gaussian_2d(x, y, x0, y0, sigma):
    return np.exp(-((x - x0)**2 + (y - y0)**2) / (2 * sigma**2))

np.random.seed(42)
x = np.random.rand(10000)
y = np.random.rand(10000)
z = gaussian_2d(x, y, 0.5, 0.5, 0.2)

# 随机抽样
sample_size = 1000
indices = np.random.choice(len(x), sample_size, replace=False)
x_sample, y_sample, z_sample = x[indices], y[indices], z[indices]

tri = Triangulation(x_sample, y_sample)

plt.figure(figsize=(8, 6))
contourf = plt.tricontourf(tri, z_sample, levels=20, cmap='viridis')
plt.title('Contours with Sampled Data - how2matplotlib.com')
plt.xlabel('X')
plt.ylabel('Y')
plt.colorbar(contourf, label='Z Value')
plt.show()
Output:
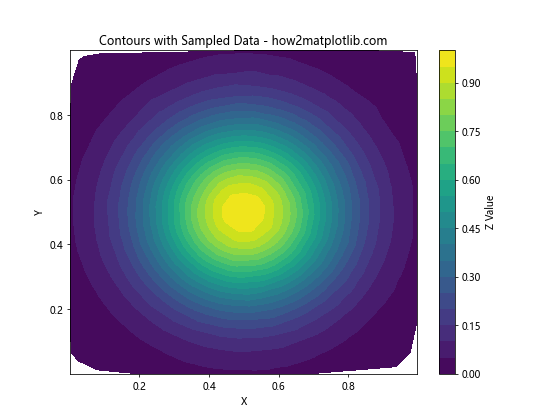
这个例子展示了如何从大型数据集中随机抽样,以减少计算量并加快绘图速度。
8.2 使用四叉树简化
对于非常大的数据集,我们可以使用四叉树来简化数据:
import numpy as np
import matplotlib.pyplot as plt
from matplotlib.tri import Triangulation
from scipy.spatial import cKDTree

def gaussian_2d(x, y, x0, y0, sigma):
    return np.exp(-((x - x0)**2 + (y - y0)**2) / (2 * sigma**2))

np.random.seed(42)
x = np.random.rand(100000)
y = np.random.rand(100000)
z = gaussian_2d(x, y, 0.5, 0.5, 0.2)

# 使用四叉树简化数据
points = np.column_stack((x, y))
tree = cKDTree(points)
simplified_points = tree.query_ball_point([0.5, 0.5], r=1, p=np.inf)
simplified_points = np.array(simplified_points)

x_simplified = x[simplified_points]
y_simplified = y[simplified_points]
z_simplified = z[simplified_points]

tri = Triangulation(x_simplified, y_simplified)

plt.figure(figsize=(8, 6))
contourf = plt.tricontourf(tri, z_simplified, levels=20, cmap='viridis')
plt.title('Contours with Quadtree Simplification - how2matplotlib.com')
plt.xlabel('X')
plt.ylabel('Y')
plt.colorbar(contourf, label='Z Value')
plt.show()
Output:
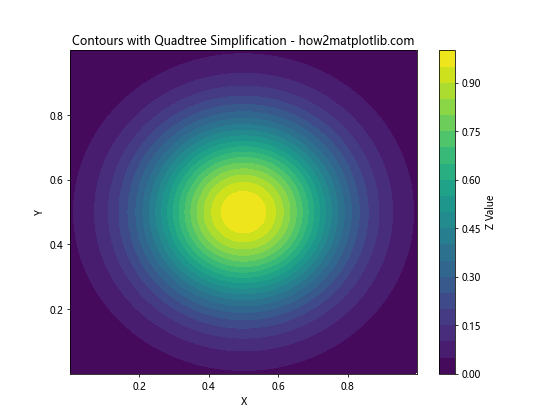
这个例子使用scipy.spatial.cKDTree来实现四叉树简化。我们选择了中心点周围的一个正方形区域内的点,这样可以大大减少需要处理的数据量。
9. 动态等高线图
在某些应用中,我们可能需要创建动态的等高线图,例如显示随时间变化的数据。
9.1 使用动画创建时变等高线图
import numpy as np
import matplotlib.pyplot as plt
from matplotlib.tri import Triangulation
from matplotlib.animation import FuncAnimation

def gaussian_2d(x, y, x0, y0, sigma):
    return np.exp(-((x - x0)**2 + (y - y0)**2) / (2 * sigma**2))

np.random.seed(42)
x = np.random.rand(500)
y = np.random.rand(500)

tri = Triangulation(x, y)

fig, ax = plt.subplots(figsize=(8, 6))

def update(frame):
    ax.clear()
    z = gaussian_2d(x, y, 0.5 + 0.3 * np.sin(frame / 10), 0.5, 0.2)
    contourf = ax.tricontourf(tri, z, levels=20, cmap='viridis')
    ax.set_title(f'Dynamic Contours - Frame {frame} - how2matplotlib.com')
    ax.set_xlabel('X')
    ax.set_ylabel('Y')
    return contourf,

ani = FuncAnimation(fig, update, frames=100, interval=50, blit=False)
plt.show()
Output:
这个例子创建了一个动画,展示了高斯函数中心随时间移动的等高线图。FuncAnimation类用于创建动画,update函数在每一帧被调用以更新图像。
10. 结合其他可视化技术
等高线图可以与其他可视化技术结合,以提供更丰富的信息。
10.1 等高线图与3D表面图结合
import numpy as np
import matplotlib.pyplot as plt
from mpl_toolkits.mplot3d import Axes3D
from matplotlib.tri import Triangulation

def gaussian_2d(x, y, x0, y0, sigma):
    return np.exp(-((x - x0)**2 + (y - y0)**2) / (2 * sigma**2))

np.random.seed(42)
x = np.random.rand(500)
y = np.random.rand(500)
z = gaussian_2d(x, y, 0.5, 0.5, 0.2)

tri = Triangulation(x, y)

fig = plt.figure(figsize=(12, 5))

# 2D等高线图
ax1 = fig.add_subplot(121)
contourf = ax1.tricontourf(tri, z, levels=20, cmap='viridis')
ax1.set_title('2D Contour Plot - how2matplotlib.com')
ax1.set_xlabel('X')
ax1.set_ylabel('Y')
fig.colorbar(contourf, ax=ax1, label='Z Value')

# 3D表面图
ax2 = fig.add_subplot(122, projection='3d')
surf = ax2.plot_trisurf(x, y, z, triangles=tri.triangles, cmap='viridis')
ax2.set_title('3D Surface Plot - how2matplotlib.com')
ax2.set_xlabel('X')
ax2.set_ylabel('Y')
ax2.set_zlabel('Z')
fig.colorbar(surf, ax=ax2, label='Z Value')

plt.tight_layout()
plt.show()
Output:
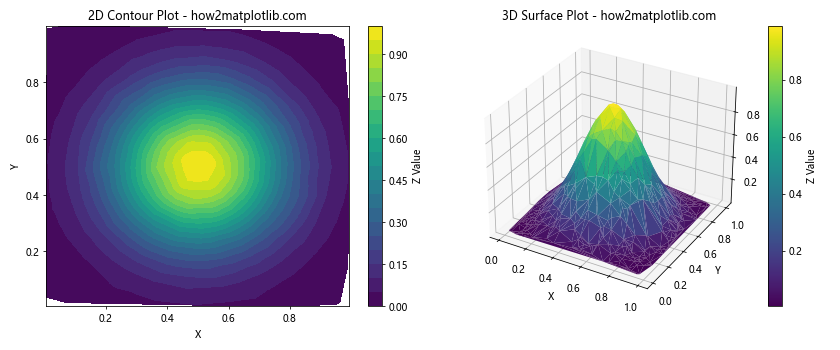
这个例子展示了如何将2D等高线图与3D表面图并排显示,以提供数据的不同视角。
结论
本文详细介绍了如何使用Matplotlib在Python中绘制非结构化三角网格等高线图。我们从基本概念开始,逐步深入到高级技巧,涵盖了创建基本等高线图、自定义样式、处理不规则边界、大规模数据处理、动态可视化等多个方面。通过这些技术,读者应该能够创建出适合各种应用场景的高质量等高线图。
在实际应用中,等高线图是一种强大的可视化工具,可以帮助我们理解复杂的二维数据分布。无论是在地理信息系统、气象学、工程设计还是数据科学中,掌握这些技术都将大大提升数据分析和可视化的能力。
 极客笔记
极客笔记