Matplotlib中如何调整图形的x轴或y轴间隔
参考:Change the x or y interval of a Matplotlib figure
Matplotlib是Python中最流行的数据可视化库之一,它提供了丰富的功能来创建各种类型的图表和图形。在使用Matplotlib绘制图形时,我们经常需要调整x轴或y轴的间隔,以便更好地展示数据或提高图形的可读性。本文将详细介绍如何在Matplotlib中改变图形的x轴或y轴间隔,包括设置刻度位置、刻度标签、刻度间隔等多个方面。
1. 基本概念
在开始介绍具体的调整方法之前,我们需要了解一些基本概念:
- 刻度(Ticks):指的是轴上的标记点。
- 刻度位置(Tick Locations):刻度在轴上的具体位置。
- 刻度标签(Tick Labels):与刻度对应的文本标签。
- 刻度间隔(Tick Interval):相邻刻度之间的距离。
了解这些概念有助于我们更好地理解和使用Matplotlib提供的各种方法来调整轴的间隔。
2. 使用set_xticks()和set_yticks()方法
set_xticks()和set_yticks()方法是调整x轴和y轴刻度位置的最直接方法。这两个方法允许我们明确指定刻度应该出现在哪些位置。
示例代码:
import matplotlib.pyplot as plt
import numpy as np

# 创建数据
x = np.linspace(0, 10, 100)
y = np.sin(x)

# 创建图形
plt.figure(figsize=(10, 6))
plt.plot(x, y)

# 设置x轴刻度
plt.xticks([0, 2, 4, 6, 8, 10])

# 设置y轴刻度
plt.yticks([-1, -0.5, 0, 0.5, 1])

plt.title("How to set ticks - how2matplotlib.com")
plt.xlabel("X axis")
plt.ylabel("Y axis")

plt.show()
Output:
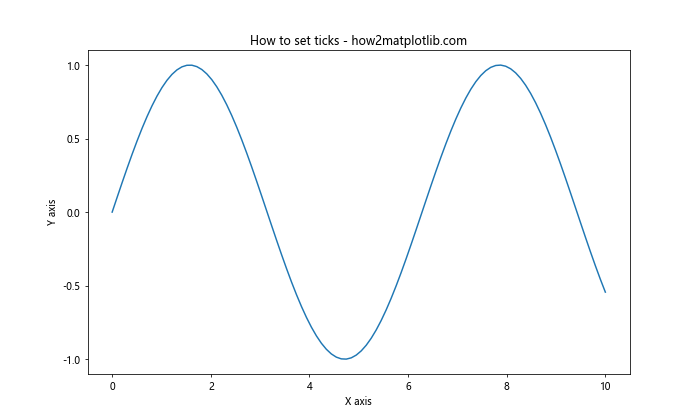
在这个例子中,我们使用plt.xticks()和plt.yticks()方法分别设置了x轴和y轴的刻度位置。对于x轴,我们设置了0到10之间的偶数刻度;对于y轴,我们设置了-1到1之间的0.5间隔的刻度。这种方法给了我们精确控制刻度位置的能力。
3. 使用set_xticklabels()和set_yticklabels()方法
有时候,我们可能想要自定义刻度标签的文本。这时可以使用set_xticklabels()和set_yticklabels()方法。
示例代码:
import matplotlib.pyplot as plt
import numpy as np

# 创建数据
x = np.arange(5)
y = x ** 2

# 创建图形
fig, ax = plt.subplots(figsize=(10, 6))
ax.plot(x, y)

# 设置x轴刻度和标签
ax.set_xticks(x)
ax.set_xticklabels(['A', 'B', 'C', 'D', 'E'])

# 设置y轴刻度和标签
ax.set_yticks([0, 5, 10, 15, 20])
ax.set_yticklabels(['Low', 'Medium-Low', 'Medium', 'Medium-High', 'High'])

ax.set_title("Custom tick labels - how2matplotlib.com")
ax.set_xlabel("Categories")
ax.set_ylabel("Values")

plt.show()
Output:
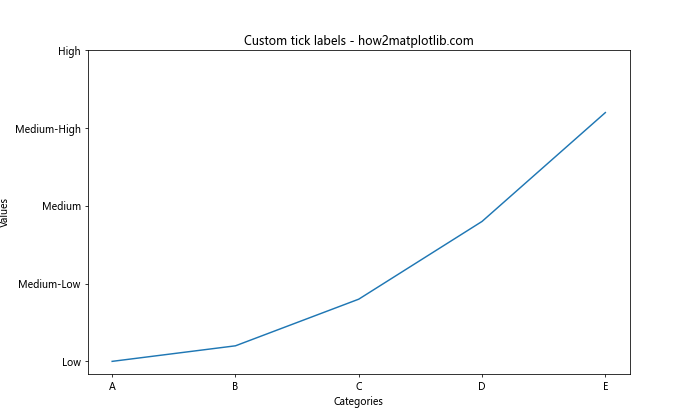
在这个例子中,我们首先使用set_xticks()和set_yticks()设置了刻度位置,然后使用set_xticklabels()和set_yticklabels()自定义了刻度标签。这种方法允许我们为刻度设置任意文本标签,非常适合用于分类数据或者需要特殊标记的情况。
4. 使用MultipleLocator设置固定间隔
如果我们想要以固定的间隔设置刻度,可以使用matplotlib.ticker模块中的MultipleLocator类。
示例代码:
import matplotlib.pyplot as plt
import numpy as np
from matplotlib.ticker import MultipleLocator

# 创建数据
x = np.linspace(0, 10, 100)
y = np.sin(x)

# 创建图形
fig, ax = plt.subplots(figsize=(10, 6))
ax.plot(x, y)

# 设置x轴主刻度间隔为2
ax.xaxis.set_major_locator(MultipleLocator(2))

# 设置y轴主刻度间隔为0.5
ax.yaxis.set_major_locator(MultipleLocator(0.5))

ax.set_title("Fixed interval ticks - how2matplotlib.com")
ax.set_xlabel("X axis")
ax.set_ylabel("Y axis")

plt.show()
Output:
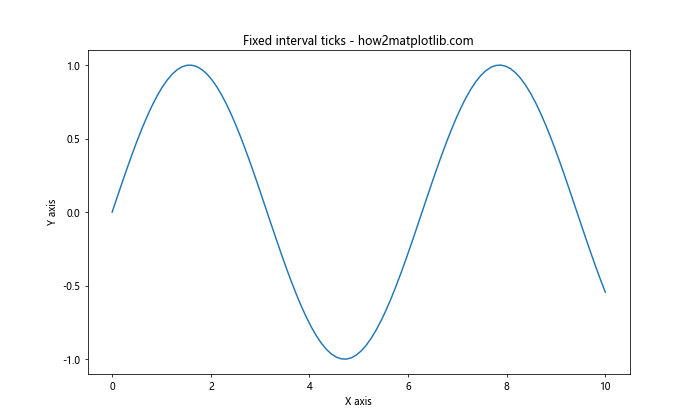
在这个例子中,我们使用MultipleLocator(2)设置x轴的主刻度间隔为2,使用MultipleLocator(0.5)设置y轴的主刻度间隔为0.5。这种方法非常适合需要均匀分布刻度的情况。
5. 使用MaxNLocator限制刻度数量
有时候,我们可能不想指定具体的刻度间隔,而是希望Matplotlib自动选择合适的刻度,同时限制刻度的数量。这时可以使用MaxNLocator。
示例代码:
import matplotlib.pyplot as plt
import numpy as np
from matplotlib.ticker import MaxNLocator

# 创建数据
x = np.linspace(0, 20, 100)
y = x ** 2

# 创建图形
fig, ax = plt.subplots(figsize=(10, 6))
ax.plot(x, y)

# 设置x轴最多有5个刻度
ax.xaxis.set_major_locator(MaxNLocator(5))

# 设置y轴最多有10个刻度
ax.yaxis.set_major_locator(MaxNLocator(10))

ax.set_title("Limited number of ticks - how2matplotlib.com")
ax.set_xlabel("X axis")
ax.set_ylabel("Y axis")

plt.show()
Output:
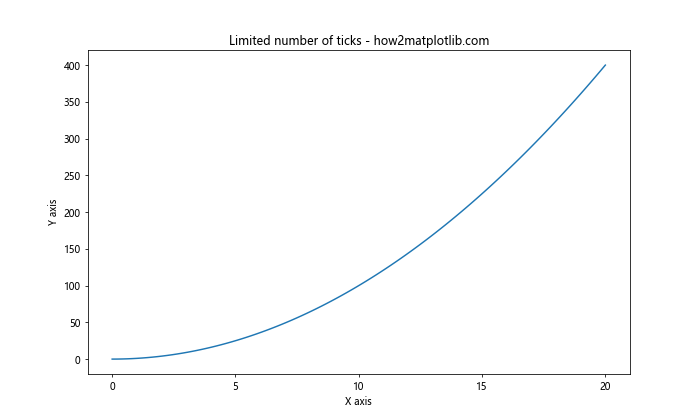
在这个例子中,我们使用MaxNLocator(5)限制x轴最多有5个刻度,使用MaxNLocator(10)限制y轴最多有10个刻度。Matplotlib会自动选择合适的刻度位置,同时确保刻度数量不超过指定的限制。
6. 使用LogLocator设置对数刻度
对于跨越多个数量级的数据,使用对数刻度可能更合适。我们可以使用LogLocator来设置对数刻度。
示例代码:
import matplotlib.pyplot as plt
import numpy as np
from matplotlib.ticker import LogLocator

# 创建数据
x = np.logspace(0, 5, 100)
y = x ** 2

# 创建图形
fig, ax = plt.subplots(figsize=(10, 6))
ax.plot(x, y)

# 设置x轴和y轴为对数刻度
ax.set_xscale('log')
ax.set_yscale('log')

# 使用LogLocator设置刻度
ax.xaxis.set_major_locator(LogLocator(base=10))
ax.yaxis.set_major_locator(LogLocator(base=10))

ax.set_title("Logarithmic scale - how2matplotlib.com")
ax.set_xlabel("X axis (log scale)")
ax.set_ylabel("Y axis (log scale)")

plt.show()
Output:
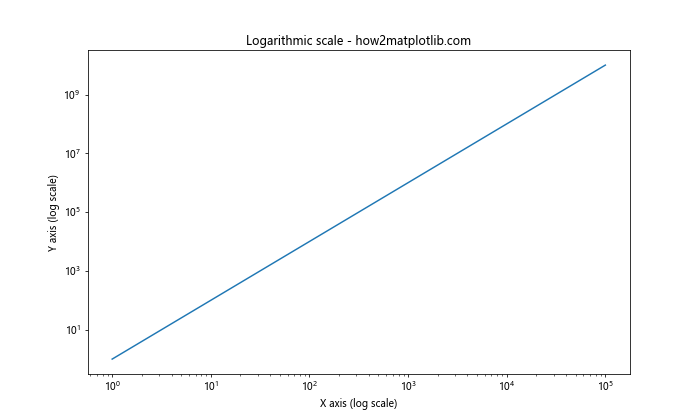
在这个例子中,我们首先使用set_xscale(‘log’)和set_yscale(‘log’)将x轴和y轴设置为对数刻度,然后使用LogLocator(base=10)设置以10为底的对数刻度。这种方法非常适合展示跨越多个数量级的数据。
7. 使用AutoLocator自动选择刻度
如果我们希望Matplotlib自动选择最合适的刻度,可以使用AutoLocator。这是Matplotlib的默认行为,但有时我们可能需要显式地使用它。
示例代码:
import matplotlib.pyplot as plt
import numpy as np
from matplotlib.ticker import AutoLocator

# 创建数据
x = np.linspace(0, 10, 100)
y = np.sin(x) * np.exp(-x/10)

# 创建图形
fig, ax = plt.subplots(figsize=(10, 6))
ax.plot(x, y)

# 使用AutoLocator
ax.xaxis.set_major_locator(AutoLocator())
ax.yaxis.set_major_locator(AutoLocator())

ax.set_title("Auto-selected ticks - how2matplotlib.com")
ax.set_xlabel("X axis")
ax.set_ylabel("Y axis")

plt.show()
Output:
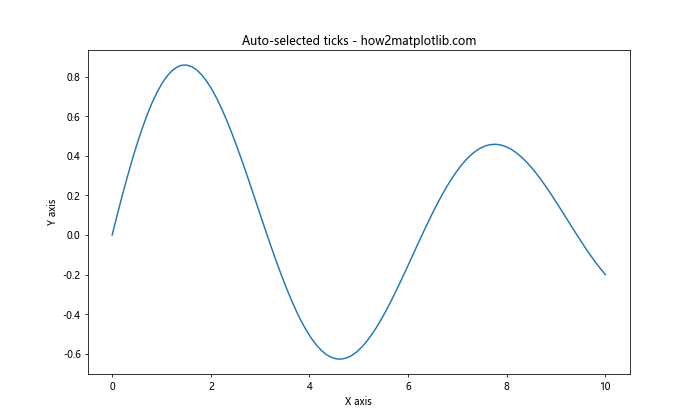
在这个例子中,我们使用AutoLocator()让Matplotlib自动选择最合适的刻度。这种方法适用于大多数情况,特别是当我们不确定数据范围或者希望图形能够自适应不同的数据时。
8. 使用IndexLocator设置索引刻度
对于一些数据集,我们可能想要使用数据点的索引作为刻度。这时可以使用IndexLocator。
示例代码:
import matplotlib.pyplot as plt
import numpy as np
from matplotlib.ticker import IndexLocator

# 创建数据
y = np.random.rand(10)

# 创建图形
fig, ax = plt.subplots(figsize=(10, 6))
ax.plot(y, 'o-')

# 使用IndexLocator
ax.xaxis.set_major_locator(IndexLocator(base=1, offset=0.5))

ax.set_title("Index-based ticks - how2matplotlib.com")
ax.set_xlabel("Index")
ax.set_ylabel("Value")

plt.show()
Output:
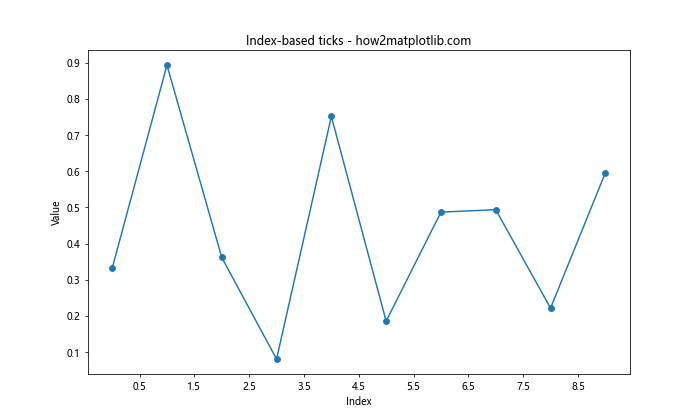
在这个例子中,我们使用IndexLocator(base=1, offset=0.5)设置x轴的刻度。base参数指定了刻度之间的间隔,offset参数指定了刻度的偏移量。这种方法特别适用于展示离散的数据点。
9. 使用FixedLocator设置固定位置的刻度
如果我们想要在特定的位置设置刻度,可以使用FixedLocator。
示例代码:
import matplotlib.pyplot as plt
import numpy as np
from matplotlib.ticker import FixedLocator

# 创建数据
x = np.linspace(0, 10, 100)
y = np.sin(x)

# 创建图形
fig, ax = plt.subplots(figsize=(10, 6))
ax.plot(x, y)

# 使用FixedLocator
ax.xaxis.set_major_locator(FixedLocator([0, np.pi, 2*np.pi, 3*np.pi]))
ax.set_xticklabels(['0', 'π', '2π', '3π'])

ax.set_title("Fixed position ticks - how2matplotlib.com")
ax.set_xlabel("X axis")
ax.set_ylabel("Y axis")

plt.show()
Output:
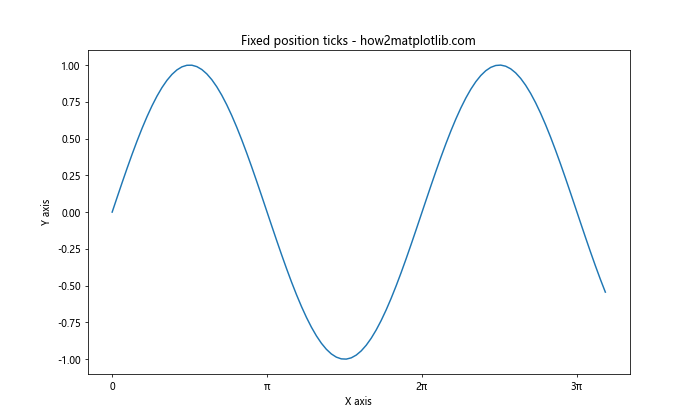
在这个例子中,我们使用FixedLocator([0, np.pi, 2np.pi, 3np.pi])在x轴的0、π、2π和3π位置设置刻度,然后使用set_xticklabels()设置相应的标签。这种方法适用于我们需要在特定位置设置刻度的情况。
10. 使用FuncFormatter自定义刻度标签格式
有时我们可能需要对刻度标签进行特殊的格式化。这时可以使用FuncFormatter。
示例代码:
import matplotlib.pyplot as plt
import numpy as np
from matplotlib.ticker import FuncFormatter

def currency_formatter(x, p):
    return f"${x:,.2f}"

# 创建数据
x = np.linspace(0, 10000, 11)
y = x ** 2

# 创建图形
fig, ax = plt.subplots(figsize=(10, 6))
ax.plot(x, y)

# 使用FuncFormatter
ax.yaxis.set_major_formatter(FuncFormatter(currency_formatter))

ax.set_title("Custom formatted ticks - how2matplotlib.com")
ax.set_xlabel("X axis")
ax.set_ylabel("Y axis (USD)")

plt.show()
Output:
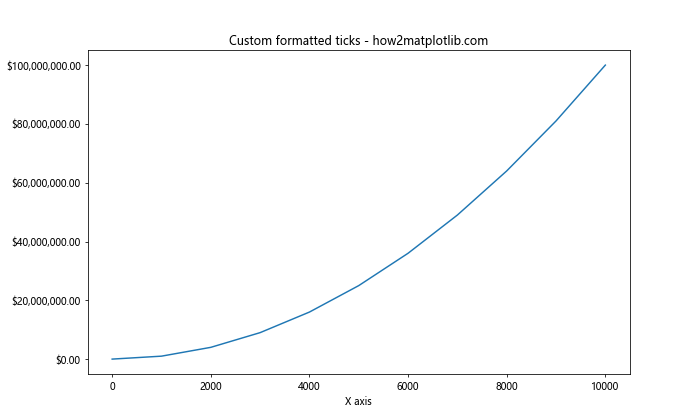
在这个例子中,我们定义了一个currency_formatter函数来将数值格式化为美元形式,然后使用FuncFormatter(currency_formatter)应用到y轴上。这种方法允许我们对刻度标签进行任意的自定义格式化。
11. 使用LinearLocator设置固定数量的刻度
如果我们想要在轴上均匀分布固定数量的刻度,可以使用LinearLocator。
示例代码:
import matplotlib.pyplot as plt
import numpy as np
from matplotlib.ticker import LinearLocator

# 创建数据
x = np.linspace(0, 10, 100)
y = np.sin(x)

# 创建图形
fig, ax = plt.subplots(figsize=(10, 6))
ax.plot(x, y)

# 使用LinearLocator
ax.xaxis.set_major_locator(LinearLocator(numticks=6))
ax.yaxis.set_major_locator(LinearLocator(numticks=5))

ax.set_title("Evenly spaced ticks - how2matplotlib.com")
ax.set_xlabel("X axis")
ax.set_ylabel("Y axis")

plt.show()
Output:
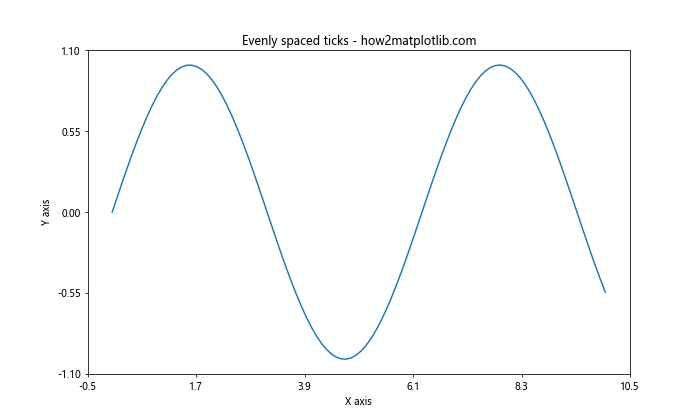
在这个例子中,我们使用LinearLocator(numticks=6)在x轴上均匀分布6个刻度,使用LinearLocator(numticks=5)在y轴上均匀分布5个刻度。这种方法适用于我们希望在轴上有固定数量的均匀分布刻度的情况。
12. 使用SymmetricalLogLocator设置对称对数刻度
对于包含正负值的数据,有时使用对称对数刻度可能更合适。我们可以使用SymmetricalLogLocator来实现这一点。
示例代码:
import matplotlib.pyplot as plt
import numpy as np
from matplotlib.ticker import SymmetricalLogLocator

# 创建数据
x = np.linspace(-1000, 1000, 1000)
y = x ** 3

# 创建图形
fig, ax = plt.subplots(figsize=(10, 6))
ax.plot(x, y)

# 设置对称对数刻度
ax.set_yscale('symlog')
ax.yaxis.set_major_locator(SymmetricalLogLocator(base=10))

ax.set_title("Symmetrical log scale - how2matplotlib.com")
ax.set_xlabel("X axis")
ax.set_ylabel("Y axis (symlog scale)")

plt.show()
在这个例子中,我们首先使用set_yscale(‘symlog’)将y轴设置为对称对数刻度,然后使用SymmetricalLogLocator(base=10)设置刻度。这种方法特别适用于需要在同一轴上显示大范围正负值的情况。
13. 使用MinorLocator设置次要刻度
除了主要刻度,我们还可以设置次要刻度来增加图形的精度。可以使用MinorLocator来实现这一点。
示例代码:
import matplotlib.pyplot as plt
import numpy as np
from matplotlib.ticker import MultipleLocator, AutoMinorLocator

# 创建数据
x = np.linspace(0, 10, 100)
y = np.sin(x)

# 创建图形
fig, ax = plt.subplots(figsize=(10, 6))
ax.plot(x, y)

# 设置主要刻度和次要刻度
ax.xaxis.set_major_locator(MultipleLocator(2))
ax.xaxis.set_minor_locator(AutoMinorLocator())
ax.yaxis.set_major_locator(MultipleLocator(0.5))
ax.yaxis.set_minor_locator(AutoMinorLocator())

# 显示网格线
ax.grid(which='major', linestyle='-', linewidth='0.5', color='red')
ax.grid(which='minor', linestyle=':', linewidth='0.5', color='black')

ax.set_title("Major and minor ticks - how2matplotlib.com")
ax.set_xlabel("X axis")
ax.set_ylabel("Y axis")

plt.show()
Output:
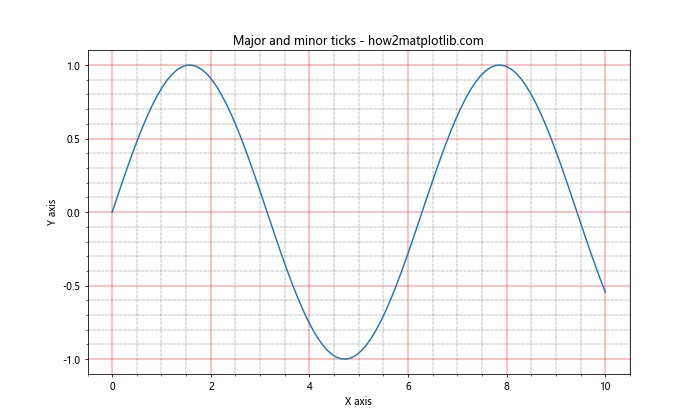
在这个例子中,我们使用MultipleLocator设置主要刻度,使用AutoMinorLocator()自动设置次要刻度。我们还添加了网格线来突出显示主要和次要刻度的位置。这种方法可以增加图形的精度和可读性。
14. 使用ScalarFormatter控制刻度标签的格式
ScalarFormatter允许我们控制刻度标签的格式,例如小数位数、是否使用科学记数法等。
示例代码:
import matplotlib.pyplot as plt
import numpy as np
from matplotlib.ticker import ScalarFormatter

# 创建数据
x = np.linspace(0, 1, 10)
y = x ** 2

# 创建图形
fig, ax = plt.subplots(figsize=(10, 6))
ax.plot(x, y)

# 设置ScalarFormatter
formatter = ScalarFormatter(useMathText=True)
formatter.set_scientific(True)
formatter.set_powerlimits((-1,1))

ax.yaxis.set_major_formatter(formatter)

ax.set_title("Formatted tick labels - how2matplotlib.com")
ax.set_xlabel("X axis")
ax.set_ylabel("Y axis")

plt.show()
Output:
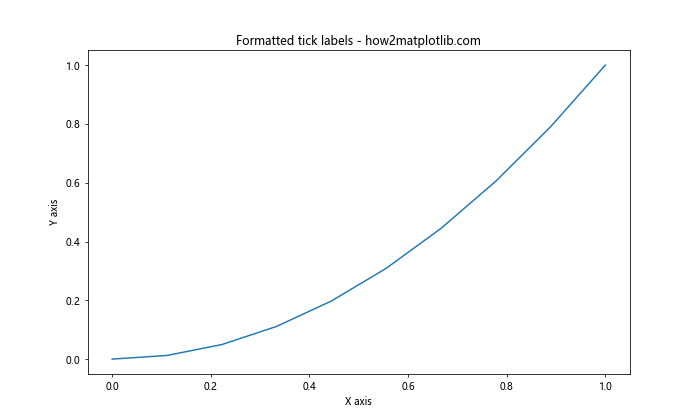
在这个例子中,我们创建了一个ScalarFormatter实例,设置了使用数学文本、启用科学记数法,并设置了幂限制。这种方法可以帮助我们更好地控制刻度标签的显示方式,特别是对于非常大或非常小的数值。
15. 使用FormatStrFormatter设置固定格式的刻度标签
如果我们想要以固定的格式显示刻度标签,可以使用FormatStrFormatter。
示例代码:
import matplotlib.pyplot as plt
import numpy as np
from matplotlib.ticker import FormatStrFormatter

# 创建数据
x = np.linspace(0, 5, 10)
y = x ** 2

# 创建图形
fig, ax = plt.subplots(figsize=(10, 6))
ax.plot(x, y)

# 设置FormatStrFormatter
ax.xaxis.set_major_formatter(FormatStrFormatter('%.1f'))
ax.yaxis.set_major_formatter(FormatStrFormatter('%.2f'))

ax.set_title("Fixed format tick labels - how2matplotlib.com")
ax.set_xlabel("X axis")
ax.set_ylabel("Y axis")

plt.show()
Output:
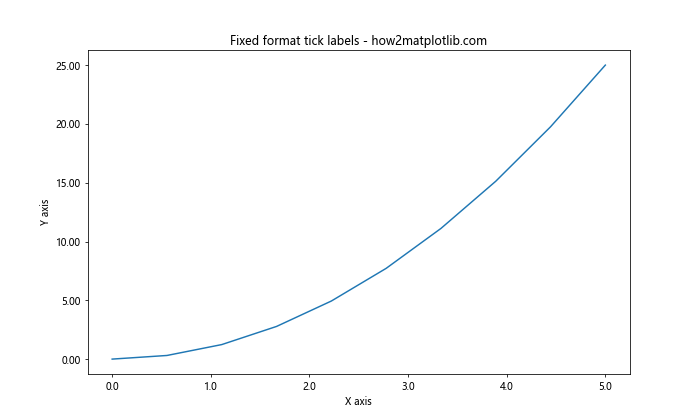
在这个例子中,我们使用FormatStrFormatter(‘%.1f’)将x轴的刻度标签设置为一位小数,使用FormatStrFormatter(‘%.2f’)将y轴的刻度标签设置为两位小数。这种方法适用于我们需要以特定格式显示刻度标签的情况。
16. 使用MultipleLocator和FuncFormatter组合自定义刻度和标签
我们可以组合使用MultipleLocator和FuncFormatter来同时自定义刻度位置和标签格式。
示例代码:
import matplotlib.pyplot as plt
import numpy as np
from matplotlib.ticker import MultipleLocator, FuncFormatter

def date_formatter(x, pos):
    return f"2023-{int(x):02d}-01"

# 创建数据
x = np.arange(1, 13)
y = np.random.rand(12)

# 创建图形
fig, ax = plt.subplots(figsize=(12, 6))
ax.plot(x, y)

# 设置刻度和格式
ax.xaxis.set_major_locator(MultipleLocator(1))
ax.xaxis.set_major_formatter(FuncFormatter(date_formatter))

ax.set_title("Custom ticks and labels - how2matplotlib.com")
ax.set_xlabel("Date")
ax.set_ylabel("Value")

plt.xticks(rotation=45)
plt.tight_layout()
plt.show()
Output:
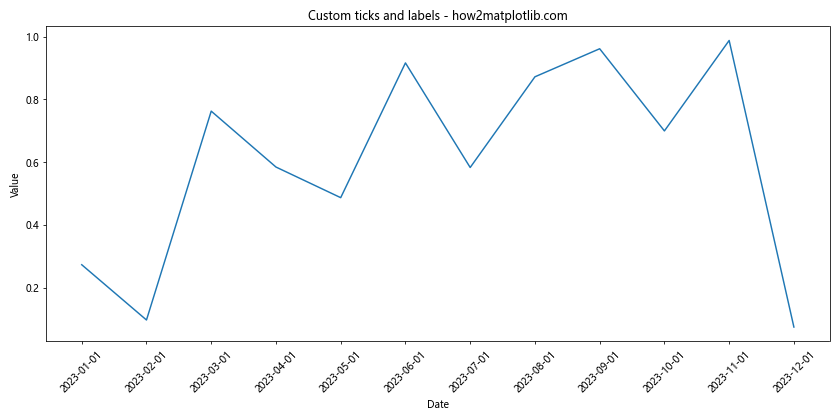
在这个例子中,我们使用MultipleLocator(1)设置x轴的刻度间隔为1,然后使用自定义的date_formatter函数将刻度值转换为日期格式。这种组合方法允许我们精确控制刻度的位置和显示格式。
17. 使用LogLocator和LogFormatter设置对数刻度
对于跨越多个数量级的数据,使用对数刻度可能更合适。我们可以结合使用LogLocator和LogFormatter来设置对数刻度。
示例代码:
import matplotlib.pyplot as plt
import numpy as np
from matplotlib.ticker import LogLocator, LogFormatter

# 创建数据
x = np.logspace(0, 5, 100)
y = x ** 2

# 创建图形
fig, ax = plt.subplots(figsize=(10, 6))
ax.plot(x, y)

# 设置对数刻度
ax.set_xscale('log')
ax.set_yscale('log')

# 设置LogLocator和LogFormatter
ax.xaxis.set_major_locator(LogLocator(base=10))
ax.xaxis.set_major_formatter(LogFormatter(base=10, labelOnlyBase=False))
ax.yaxis.set_major_locator(LogLocator(base=10))
ax.yaxis.set_major_formatter(LogFormatter(base=10, labelOnlyBase=False))

ax.set_title("Logarithmic scale with custom formatting - how2matplotlib.com")
ax.set_xlabel("X axis (log scale)")
ax.set_ylabel("Y axis (log scale)")

plt.show()
Output:
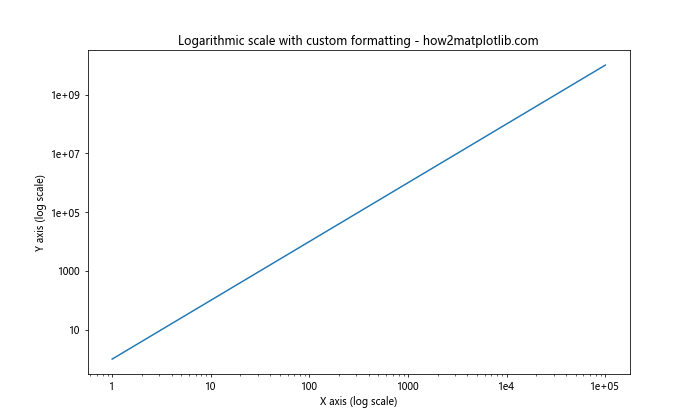
在这个例子中,我们首先使用set_xscale(‘log’)和set_yscale(‘log’)将x轴和y轴设置为对数刻度。然后,我们使用LogLocator(base=10)设置以10为底的对数刻度,并使用LogFormatter(base=10, labelOnlyBase=False)设置刻度标签的格式。这种方法可以更精细地控制对数刻度的显示方式。
总结
调整Matplotlib图形的x轴或y轴间隔是数据可视化过程中的一个重要步骤。通过本文介绍的各种方法,我们可以根据不同的需求和数据特性来自定义刻度的位置、间隔和标签格式。这些技巧可以帮助我们创建更加清晰、准确和美观的图表。
在实际应用中,我们可能需要根据具体情况组合使用多种方法。例如,我们可能需要同时调整主要刻度和次要刻度,或者在对数刻度上应用自定义的格式化函数。通过灵活运用这些技巧,我们可以充分发挥Matplotlib的强大功能,创建出既能准确传达数据信息,又具有良好视觉效果的图表。
最后,需要注意的是,虽然我们有多种方法可以调整轴的间隔,但最重要的是要确保图表能够清晰、准确地传达数据信息。过度复杂的刻度设置可能会影响图表的可读性,因此在调整时要权衡美观性和实用性,选择最适合数据和受众的方式。
通过掌握这些技巧,我们可以更好地控制Matplotlib图形的细节,创建出更加专业和有说服力的数据可视化作品。无论是进行数据分析、科学研究还是商业报告,这些技能都将大大提升我们的数据展示能力。
 极客笔记
极客笔记