Matplotlib中使用facecolor更改图例背景:全面指南
参考:Change Legend background using facecolor in MatplotLib
Matplotlib是Python中强大的数据可视化库,它提供了丰富的功能来创建各种类型的图表和绘图。在数据可视化中,图例(Legend)是一个重要的组成部分,它帮助读者理解图表中不同元素的含义。本文将深入探讨如何在Matplotlib中使用facecolor属性来更改图例的背景颜色,以增强图表的可读性和美观性。
1. 图例背景的重要性
图例背景色的选择对于整体图表的视觉效果和可读性至关重要。适当的背景色可以:
- 提高图例与图表其他部分的对比度
- 突出显示重要信息
- 与整体图表设计风格保持一致
- 改善图表在不同显示设备上的可读性
让我们从一个基本的示例开始,展示如何创建一个简单的图表并添加图例:
import matplotlib.pyplot as plt

# 创建数据
x = [1, 2, 3, 4, 5]
y1 = [2, 4, 6, 8, 10]
y2 = [1, 3, 5, 7, 9]

# 创建图表
plt.figure(figsize=(8, 6))
plt.plot(x, y1, label='Line 1')
plt.plot(x, y2, label='Line 2')

# 添加图例
plt.legend()

# 添加标题
plt.title('How to change legend background in Matplotlib - how2matplotlib.com')

# 显示图表
plt.show()
Output:
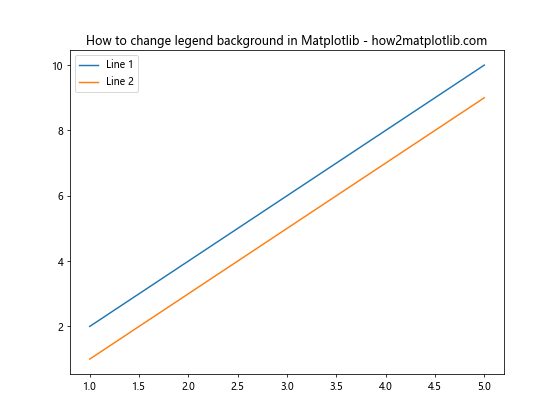
在这个基本示例中,我们创建了两条线并添加了一个默认的图例。接下来,我们将探讨如何自定义图例的背景色。
2. 使用facecolor更改图例背景
Matplotlib提供了facecolor参数来设置图例的背景颜色。这个参数可以在创建图例时直接指定,也可以通过后续的方法调用来修改。以下是一个简单的示例:
import matplotlib.pyplot as plt

# 创建数据
x = [1, 2, 3, 4, 5]
y1 = [2, 4, 6, 8, 10]
y2 = [1, 3, 5, 7, 9]

# 创建图表
plt.figure(figsize=(8, 6))
plt.plot(x, y1, label='Line 1')
plt.plot(x, y2, label='Line 2')

# 添加图例并设置背景色
plt.legend(facecolor='lightblue')

# 添加标题
plt.title('Legend with custom background - how2matplotlib.com')

# 显示图表
plt.show()
Output:
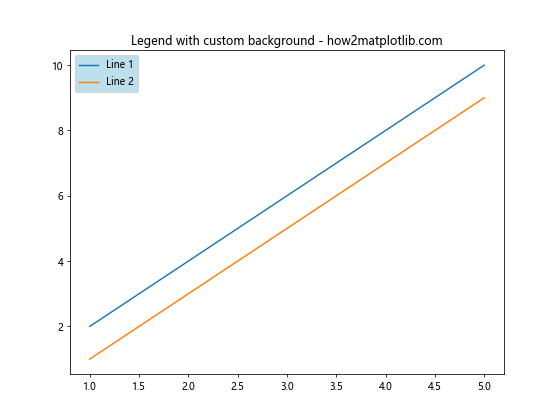
在这个示例中,我们使用facecolor='lightblue'参数将图例的背景色设置为浅蓝色。这种方法简单直接,适用于大多数基本场景。
3. 使用RGB和RGBA值设置背景色
除了使用预定义的颜色名称,我们还可以使用RGB(红绿蓝)或RGBA(红绿蓝透明度)值来精确控制背景色。这种方法提供了更大的灵活性:
import matplotlib.pyplot as plt

# 创建数据
x = [1, 2, 3, 4, 5]
y1 = [2, 4, 6, 8, 10]
y2 = [1, 3, 5, 7, 9]

# 创建图表
plt.figure(figsize=(8, 6))
plt.plot(x, y1, label='Line 1')
plt.plot(x, y2, label='Line 2')

# 使用RGB值设置背景色
plt.legend(facecolor=(0.9, 0.9, 0.8))  # 浅米色

# 添加标题
plt.title('Legend with RGB background - how2matplotlib.com')

# 显示图表
plt.show()
Output:
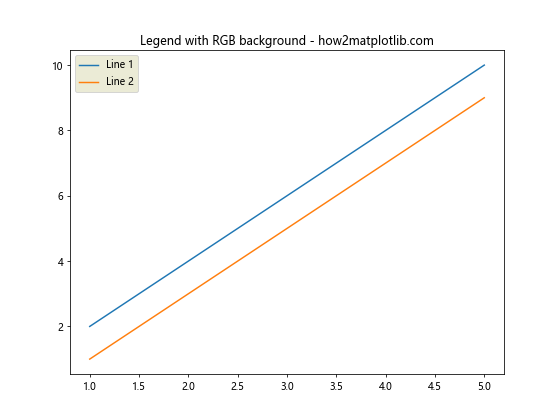
在这个示例中,我们使用RGB值(0.9, 0.9, 0.8)来设置一个浅米色的背景。RGB值的范围是0到1,分别代表红、绿、蓝三种颜色的强度。
如果我们想要添加透明度,可以使用RGBA值:
import matplotlib.pyplot as plt

# 创建数据
x = [1, 2, 3, 4, 5]
y1 = [2, 4, 6, 8, 10]
y2 = [1, 3, 5, 7, 9]

# 创建图表
plt.figure(figsize=(8, 6))
plt.plot(x, y1, label='Line 1')
plt.plot(x, y2, label='Line 2')

# 使用RGBA值设置背景色
plt.legend(facecolor=(0.9, 0.9, 0.8, 0.5))  # 半透明浅米色

# 添加标题
plt.title('Legend with RGBA background - how2matplotlib.com')

# 显示图表
plt.show()
Output:
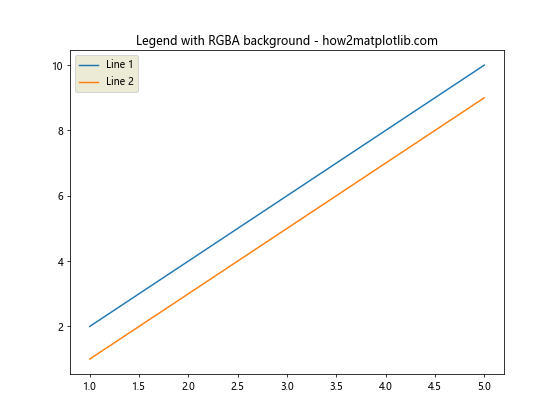
在这个示例中,我们添加了第四个值0.5来控制透明度。0表示完全透明,1表示完全不透明。
4. 使用颜色映射(Colormap)设置背景色
Matplotlib提供了丰富的颜色映射,我们可以利用这些映射来设置更复杂的背景色:
import matplotlib.pyplot as plt
import matplotlib.colors as mcolors

# 创建数据
x = [1, 2, 3, 4, 5]
y1 = [2, 4, 6, 8, 10]
y2 = [1, 3, 5, 7, 9]

# 创建图表
plt.figure(figsize=(8, 6))
plt.plot(x, y1, label='Line 1')
plt.plot(x, y2, label='Line 2')

# 使用颜色映射设置背景色
cmap = plt.get_cmap('coolwarm')
plt.legend(facecolor=cmap(0.2))

# 添加标题
plt.title('Legend with colormap background - how2matplotlib.com')

# 显示图表
plt.show()
Output:
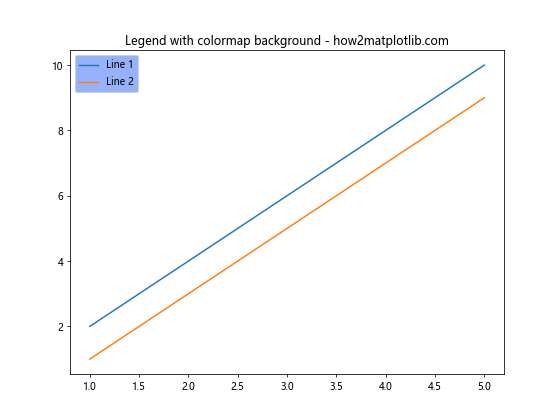
在这个示例中,我们使用’coolwarm’颜色映射,并选择了映射中20%位置的颜色作为背景色。这种方法允许我们从预定义的颜色范围中选择颜色,为图例背景提供更多样化的选择。
5. 动态调整图例背景色
有时,我们可能需要根据数据或其他条件动态调整图例的背景色。以下是一个根据数据值动态设置背景色的示例:
import matplotlib.pyplot as plt
import numpy as np

# 创建数据
x = np.linspace(0, 10, 100)
y1 = np.sin(x)
y2 = np.cos(x)

# 创建图表
plt.figure(figsize=(10, 6))
plt.plot(x, y1, label='sin(x)')
plt.plot(x, y2, label='cos(x)')

# 计算平均值并据此设置背景色
mean_value = (np.mean(y1) + np.mean(y2)) / 2
background_color = plt.cm.RdYlBu(mean_value)

# 添加图例并设置背景色
plt.legend(facecolor=background_color)

# 添加标题
plt.title('Dynamic legend background - how2matplotlib.com')

# 显示图表
plt.show()
Output:
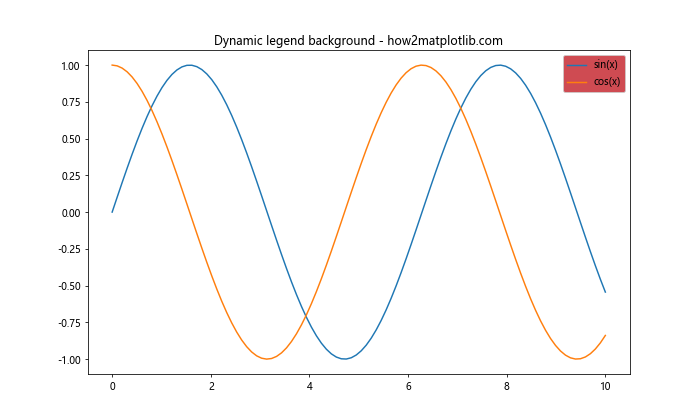
在这个示例中,我们根据两条曲线的平均值来动态设置图例的背景色。这种方法可以使图例的背景色反映数据的某些特征,增加图表的信息量。
6. 自定义图例样式
除了背景色,我们还可以自定义图例的其他样式属性,如边框颜色、透明度等:
import matplotlib.pyplot as plt

# 创建数据
x = [1, 2, 3, 4, 5]
y1 = [2, 4, 6, 8, 10]
y2 = [1, 3, 5, 7, 9]

# 创建图表
plt.figure(figsize=(8, 6))
plt.plot(x, y1, label='Line 1')
plt.plot(x, y2, label='Line 2')

# 添加自定义样式的图例
plt.legend(facecolor='lightyellow', edgecolor='red', framealpha=0.8,
           title='Custom Legend', title_fontsize='large')

# 添加标题
plt.title('Legend with custom style - how2matplotlib.com')

# 显示图表
plt.show()
Output:
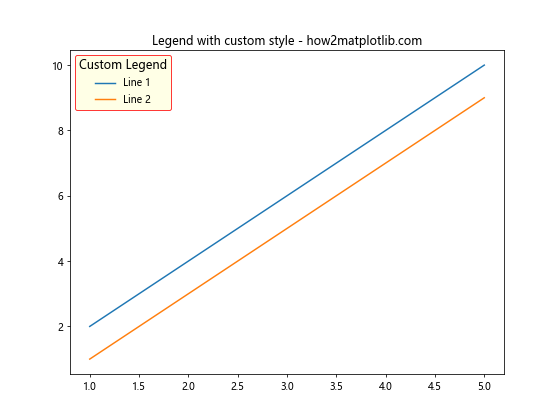
在这个示例中,我们不仅设置了背景色,还自定义了边框颜色、透明度,并添加了图例标题。这些额外的样式选项可以帮助我们创建更加个性化和信息丰富的图例。
7. 多图例的背景色设置
在某些情况下,我们可能需要在一个图表中使用多个图例。每个图例可以有不同的背景色:
import matplotlib.pyplot as plt

# 创建数据
x = [1, 2, 3, 4, 5]
y1 = [2, 4, 6, 8, 10]
y2 = [1, 3, 5, 7, 9]
y3 = [5, 4, 3, 2, 1]

# 创建图表
fig, ax = plt.subplots(figsize=(10, 6))
line1 = ax.plot(x, y1, label='Line 1')
line2 = ax.plot(x, y2, label='Line 2')
line3 = ax.plot(x, y3, label='Line 3')

# 添加多个图例
legend1 = ax.legend(handles=[line1[0], line2[0]], loc='upper left', facecolor='lightblue')
ax.add_artist(legend1)
ax.legend(handles=[line3[0]], loc='lower right', facecolor='lightgreen')

# 添加标题
plt.title('Multiple legends with different backgrounds - how2matplotlib.com')

# 显示图表
plt.show()
Output:
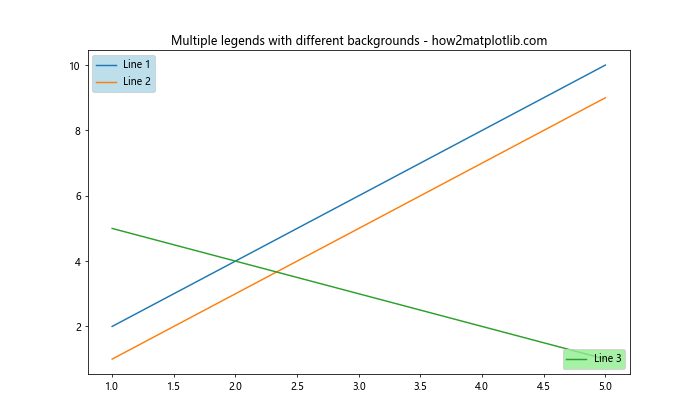
在这个示例中,我们创建了两个独立的图例,分别位于图表的左上角和右下角,并为它们设置了不同的背景色。这种方法在需要分组显示图例信息时特别有用。
8. 图例背景渐变色
为了创建更吸引眼球的图例,我们可以使用渐变色作为背景。以下是一个使用线性渐变作为图例背景的示例:
import matplotlib.pyplot as plt
import matplotlib.patches as patches
import matplotlib.colors as mcolors

# 创建数据
x = [1, 2, 3, 4, 5]
y1 = [2, 4, 6, 8, 10]
y2 = [1, 3, 5, 7, 9]

# 创建图表
fig, ax = plt.subplots(figsize=(8, 6))
ax.plot(x, y1, label='Line 1')
ax.plot(x, y2, label='Line 2')

# 创建渐变色
gradient = mcolors.LinearSegmentedColormap.from_list("", ["lightblue", "lightyellow"])
gradient_array = gradient(np.linspace(0, 1, 256))

# 创建自定义图例
legend = ax.legend()
frame = legend.get_frame()
frame.set_facecolor('none')
frame.set_edgecolor('none')

# 添加渐变背景
bbox = legend.get_bbox_to_anchor().transformed(ax.transAxes.inverted())
rect = patches.Rectangle((bbox.x0, bbox.y0), bbox.width, bbox.height,
                         transform=ax.transAxes, zorder=0,
                         facecolor=gradient_array)
ax.add_patch(rect)

# 添加标题
plt.title('Legend with gradient background - how2matplotlib.com')

# 显示图表
plt.show()
在这个示例中,我们创建了一个从浅蓝色到浅黄色的线性渐变,并将其应用为图例的背景。这种方法可以创建更加独特和吸引人的图例样式。
9. 根据主题动态调整图例背景
在某些情况下,我们可能希望图例的背景色能够根据整体图表的主题或样式自动调整。以下是一个根据图表背景色自动调整图例背景的示例:
import matplotlib.pyplot as plt
import matplotlib.colors as mcolors

def adjust_legend_background(ax, lightness_threshold=0.7):
    # 获取图表背景色
    bg_color = ax.get_facecolor()

    # 将RGB转换为HSL
    h, l, s = mcolors.rgb_to_hls(*mcolors.to_rgb(bg_color))

    # 根据背景亮度调整图例背景色
    if l > lightness_threshold:
        legend_bg = 'lightgray'
    else:
        legend_bg = 'white'

    return legend_bg

# 创建数据
x = [1, 2, 3, 4, 5]
y1 = [2, 4, 6, 8, 10]
y2 = [1, 3, 5, 7, 9]

# 创建图表
fig, (ax1, ax2) = plt.subplots(1, 2, figsize=(12, 5))

# 第一个子图 - 浅色背景
ax1.set_facecolor('lightblue')
ax1.plot(x, y1, label='Line 1')
ax1.plot(x, y2, label='Line 2')
legend_bg1 = adjust_legend_background(ax1)
ax1.legend(facecolor=legend_bg1)
ax1ax1.set_title('Light background - how2matplotlib.com')

# 第二个子图 - 深色背景
ax2.set_facecolor('darkblue')
ax2.plot(x, y1, label='Line 1', color='yellow')
ax2.plot(x, y2, label='Line 2', color='orange')
legend_bg2 = adjust_legend_background(ax2)
ax2.legend(facecolor=legend_bg2)
ax2.set_title('Dark background - how2matplotlib.com')

plt.tight_layout()
plt.show()
在这个示例中,我们定义了一个函数adjust_legend_background,它根据图表的背景色来决定图例的背景色。这种方法可以确保图例在不同背景下都具有良好的可读性。
10. 图例背景与数据关联
有时,我们可能希望图例的背景色能够反映数据的某些特征。以下是一个根据数据范围设置图例背景色的示例:
import matplotlib.pyplot as plt
import numpy as np

def get_background_color(data):
    mean = np.mean(data)
    std = np.std(data)
    if mean > 0:
        return plt.cm.Reds((std / mean) * 0.5)
    else:
        return plt.cm.Blues((-std / mean) * 0.5)

# 创建数据
x = np.linspace(0, 10, 100)
y1 = np.sin(x) + np.random.normal(0, 0.1, 100)
y2 = np.cos(x) + np.random.normal(0, 0.2, 100)

# 创建图表
fig, ax = plt.subplots(figsize=(10, 6))
ax.plot(x, y1, label='Sin')
ax.plot(x, y2, label='Cos')

# 设置图例背景色
legend = ax.legend()
for i, line in enumerate([y1, y2]):
    legend.get_texts()[i].set_backgroundcolor(get_background_color(line))

# 添加标题
plt.title('Legend background based on data characteristics - how2matplotlib.com')

# 显示图表
plt.show()
Output:
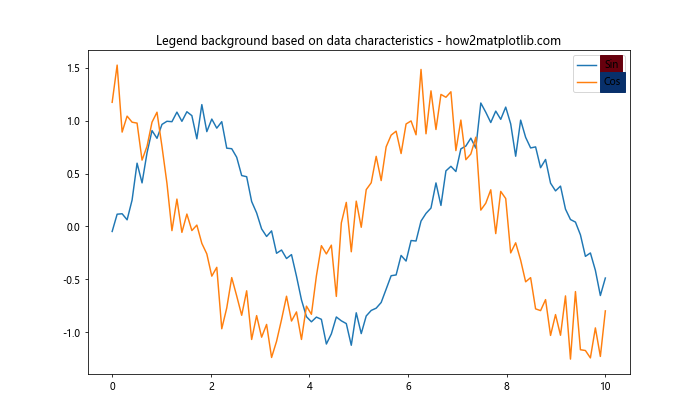
在这个示例中,我们定义了一个函数get_background_color,它根据数据的均值和标准差来决定背景色。这种方法可以直观地反映数据的分布特征。
11. 交互式调整图例背景色
在某些情况下,我们可能希望能够交互式地调整图例的背景色。虽然Matplotlib本身不提供直接的交互式功能,但我们可以结合使用ipywidgets(在Jupyter环境中)来实现这一功能:
import matplotlib.pyplot as plt
import ipywidgets as widgets
from IPython.display import display

# 创建数据
x = [1, 2, 3, 4, 5]
y1 = [2, 4, 6, 8, 10]
y2 = [1, 3, 5, 7, 9]

# 创建图表
fig, ax = plt.subplots(figsize=(8, 6))
ax.plot(x, y1, label='Line 1')
ax.plot(x, y2, label='Line 2')
legend = ax.legend()

# 创建颜色选择器
color_picker = widgets.ColorPicker(
    description='Legend Background',
    value='#ffffff',
    concise=False
)

# 更新图例背景色的函数
def update_legend_color(change):
    legend.get_frame().set_facecolor(change['new'])
    fig.canvas.draw_idle()

# 连接颜色选择器到更新函数
color_picker.observe(update_legend_color, names='value')

# 显示颜色选择器和图表
display(color_picker)
plt.title('Interactive legend background - how2matplotlib.com')
plt.show()
这个示例需要在Jupyter环境中运行。它创建了一个颜色选择器,允许用户实时更改图例的背景色。
12. 图例背景与图表主题集成
当使用Matplotlib的样式或主题时,我们可能希望图例的背景能够自动适应当前的主题。以下是一个示例,展示如何在不同的主题下调整图例背景:
import matplotlib.pyplot as plt

# 创建数据
x = [1, 2, 3, 4, 5]
y1 = [2, 4, 6, 8, 10]
y2 = [1, 3, 5, 7, 9]

# 创建多个子图,每个使用不同的样式
fig, axs = plt.subplots(2, 2, figsize=(12, 10))
styles = ['default', 'seaborn', 'ggplot', 'dark_background']

for ax, style in zip(axs.flat, styles):
    with plt.style.context(style):
        ax.plot(x, y1, label='Line 1')
        ax.plot(x, y2, label='Line 2')
        legend = ax.legend()

        # 根据样式调整图例背景
        if style == 'dark_background':
            legend.get_frame().set_facecolor('gray')
            legend.get_frame().set_alpha(0.5)
        else:
            legend.get_frame().set_facecolor('white')
            legend.get_frame().set_alpha(0.8)

        ax.set_title(f'{style.capitalize()} style - how2matplotlib.com')

plt.tight_layout()
plt.show()
这个示例展示了如何在不同的Matplotlib样式下调整图例背景,以确保图例在各种主题下都能保持良好的可读性。
13. 自定义图例背景形状
除了改变背景色,我们还可以自定义图例的背景形状。以下是一个创建圆角矩形背景的示例:
import matplotlib.pyplot as plt
import matplotlib.patches as patches

# 创建数据
x = [1, 2, 3, 4, 5]
y1 = [2, 4, 6, 8, 10]
y2 = [1, 3, 5, 7, 9]

# 创建图表
fig, ax = plt.subplots(figsize=(8, 6))
ax.plot(x, y1, label='Line 1')
ax.plot(x, y2, label='Line 2')

# 创建自定义图例
legend = ax.legend(frameon=False)
frame = legend.get_frame()

# 创建圆角矩形背景
bbox = legend.get_bbox_to_anchor().transformed(ax.transAxes.inverted())
rect = patches.FancyBboxPatch((bbox.x0, bbox.y0), bbox.width, bbox.height,
                              boxstyle='round,pad=0.1', facecolor='lightblue',
                              alpha=0.5, transform=ax.transAxes, zorder=0)
ax.add_patch(rect)

# 添加标题
plt.title('Legend with custom background shape - how2matplotlib.com')

# 显示图表
plt.show()
Output:
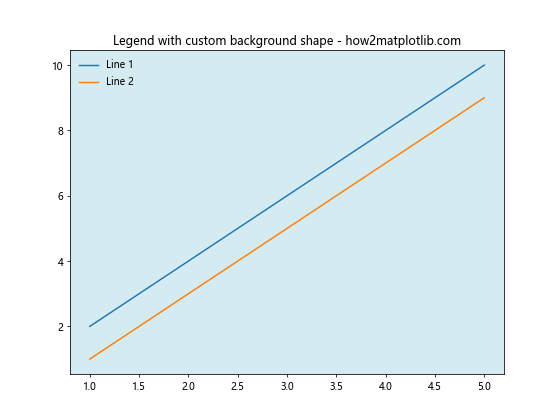
这个示例使用FancyBboxPatch创建了一个圆角矩形作为图例的背景,提供了更加独特的视觉效果。
14. 图例背景与数据点颜色协调
为了使图例更加协调,我们可以让图例的背景色与数据点的颜色相关联:
import matplotlib.pyplot as plt
import numpy as np

# 创建数据
x = np.linspace(0, 10, 100)
y1 = np.sin(x)
y2 = np.cos(x)

# 创建图表
fig, ax = plt.subplots(figsize=(10, 6))

# 绘制数据并获取颜色
line1 = ax.plot(x, y1, label='Sin')[0]
line2 = ax.plot(x, y2, label='Cos')[0]

# 创建图例
legend = ax.legend()

# 设置图例背景色为数据点颜色的浅色版本
for text, line in zip(legend.get_texts(), [line1, line2]):
    color = line.get_color()
    rgb = plt.cm.colors.to_rgb(color)
    light_rgb = [min(1, c + 0.3) for c in rgb]  # 使颜色变浅
    text.set_backgroundcolor(light_rgb)

# 添加标题
plt.title('Legend background coordinated with data colors - how2matplotlib.com')

# 显示图表
plt.show()
Output:
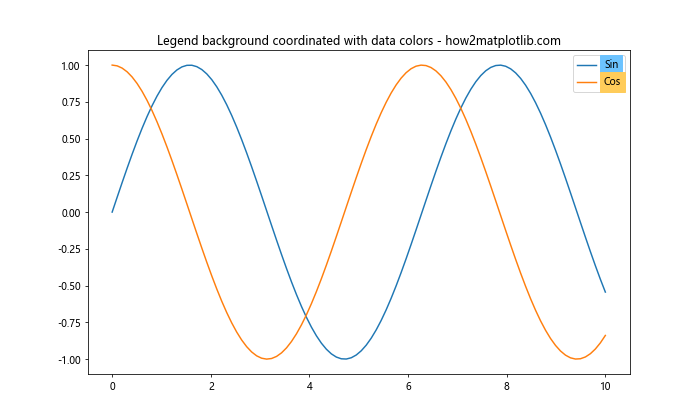
这个示例将每个图例项的背景色设置为对应数据线颜色的浅色版本,创造出一种视觉上的连贯性。
15. 图例背景动画效果
虽然静态图表中不常见,但在某些交互式或动画场景中,我们可能希望图例背景有动画效果。以下是一个简单的示例,展示如何创建一个颜色渐变动画:
import matplotlib.pyplot as plt
import matplotlib.animation as animation
import numpy as np

# 创建数据
x = np.linspace(0, 10, 100)
y1 = np.sin(x)
y2 = np.cos(x)

# 创建图表
fig, ax = plt.subplots(figsize=(10, 6))
ax.plot(x, y1, label='Sin')
ax.plot(x, y2, label='Cos')
legend = ax.legend()

# 创建动画函数
def animate(frame):
    # 使用HSV颜色空间创建循环颜色变化
    hue = frame / 100
    color = plt.cm.hsv(hue)
    legend.get_frame().set_facecolor(color)
    return legend,

# 创建动画
anim = animation.FuncAnimation(fig, animate, frames=100, interval=50, blit=True)

# 添加标题
plt.title('Animated legend background - how2matplotlib.com')

# 显示动画
plt.show()
Output:
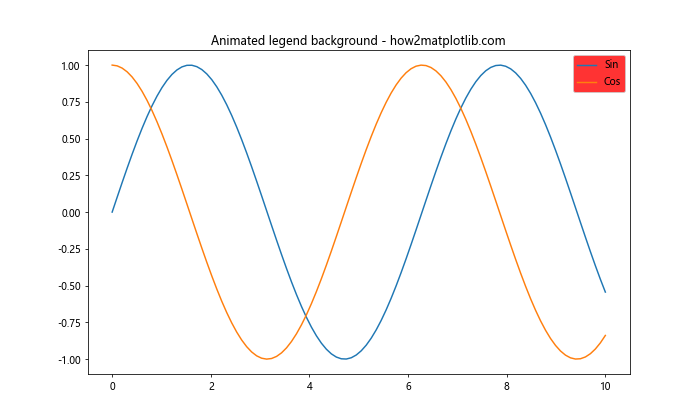
这个示例创建了一个图例背景颜色循环变化的动画效果。请注意,这种动画效果在大多数静态图表中并不适用,但在某些交互式应用或演示中可能会很有用。
结论
通过本文的详细探讨,我们了解了在Matplotlib中使用facecolor来更改图例背景的多种方法和技巧。从简单的颜色设置到复杂的动态调整,从单一背景色到渐变效果,我们展示了多种可以增强图表可读性和美观性的技巧。
这些技巧不仅可以应用于图例背景,还可以扩展到Matplotlib中的其他元素,如坐标轴、标题等。通过灵活运用这些方法,我们可以创建出既信息丰富又视觉吸引的数据可视化作品。
记住,在选择图例背景色时,始终要考虑整体图表的协调性、数据的清晰度以及目标受众的需求。适当的背景色选择可以大大提升图表的专业性和有效性。
最后,我们鼓励读者基于这些示例进行更多的实验和创新,以找到最适合自己特定需求的图例样式。数据可视化是一门既需要技术也需要创意的艺术,通过不断实践和探索,你将能够创造出更加出色的图表作品。
 极客笔记
极客笔记