在Matplotlib中更改网格间隔和指定刻度标签
参考: Change grid interval and specify tick labels in Matplotlib
在数据可视化过程中,调整图表的网格间隔和刻度标签是一项基本而重要的技能。Matplotlib作为Python中一个强大的绘图库,提供了丰富的接口来调整这些视觉元素,以帮助更好地展示数据。本文将详细介绍如何在Matplotlib中更改网格间隔和指定刻度标签,并通过多个示例代码展示如何实现。
更改网格间隔
在Matplotlib中,更改网格间隔通常涉及到调整轴的刻度位置。这可以通过设置Locator对象来实现,常用的Locator有MultipleLocator, FixedLocator, AutoLocator等。
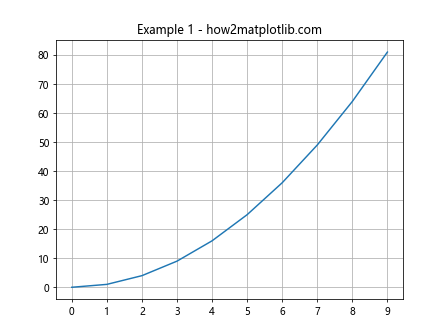
示例1:使用MultipleLocator设置固定的网格间隔
import matplotlib.pyplot as plt
from matplotlib.ticker import MultipleLocator

fig, ax = plt.subplots()
ax.plot(range(10), [x**2 for x in range(10)])
ax.xaxis.set_major_locator(MultipleLocator(1))
ax.yaxis.set_major_locator(MultipleLocator(10))
ax.grid(True)
plt.title("Example 1 - how2matplotlib.com")
plt.show()
Output:
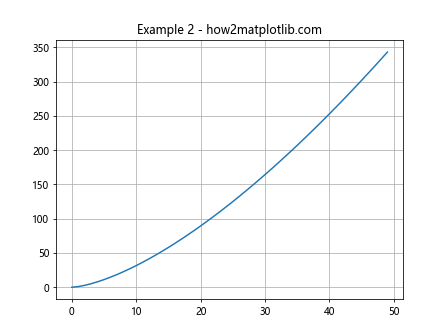
示例2:使用AutoLocator自动选择网格间隔
import matplotlib.pyplot as plt
from matplotlib.ticker import AutoLocator

fig, ax = plt.subplots()
ax.plot(range(50), [x**1.5 for x in range(50)])
ax.xaxis.set_major_locator(AutoLocator())
ax.yaxis.set_major_locator(AutoLocator())
ax.grid(True)
plt.title("Example 2 - how2matplotlib.com")
plt.show()
Output:
指定刻度标签
指定刻度标签可以通过设置Formatter对象来实现。常用的Formatter有FormatStrFormatter, FuncFormatter等。
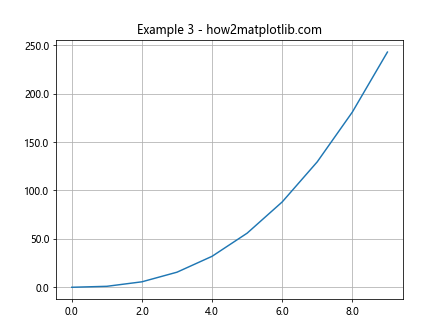
示例3:使用FormatStrFormatter自定义刻度格式
import matplotlib.pyplot as plt
from matplotlib.ticker import FormatStrFormatter

fig, ax = plt.subplots()
ax.plot(range(10), [x**2.5 for x in range(10)])
ax.xaxis.set_major_formatter(FormatStrFormatter('%0.1f'))
ax.yaxis.set_major_formatter(FormatStrFormatter('%0.1f'))
ax.grid(True)
plt.title("Example 3 - how2matplotlib.com")
plt.show()
Output:
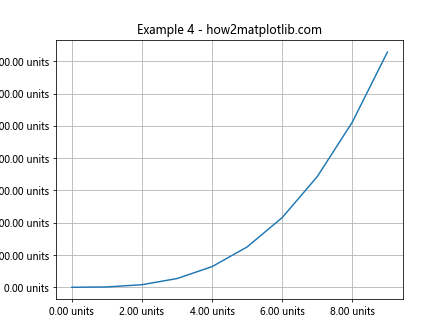
示例4:使用FuncFormatter进行更复杂的刻度格式定义
import matplotlib.pyplot as plt
from matplotlib.ticker import FuncFormatter

def custom_format(x, pos):
    return f'{x:.2f} units'

fig, ax = plt.subplots()
ax.plot(range(10), [x**3 for x in range(10)])
ax.xaxis.set_major_formatter(FuncFormatter(custom_format))
ax.yaxis.set_major_formatter(FuncFormatter(custom_format))
ax.grid(True)
plt.title("Example 4 - how2matplotlib.com")
plt.show()
Output:
结合网格间隔和刻度标签的调整
在实际应用中,我们经常需要同时调整网格间隔和刻度标签,以达到最佳的视觉效果。
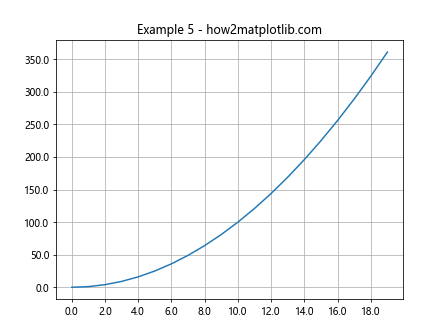
示例5:结合使用MultipleLocator和FormatStrFormatter
import matplotlib.pyplot as plt
from matplotlib.ticker import MultipleLocator, FormatStrFormatter

fig, ax = plt.subplots()
ax.plot(range(20), [x**2 for x in range(20)])
ax.xaxis.set_major_locator(MultipleLocator(2))
ax.yaxis.set_major_locator(MultipleLocator(50))
ax.xaxis.set_major_formatter(FormatStrFormatter('%0.1f'))
ax.yaxis.set_major_formatter(FormatStrFormatter('%0.1f'))
ax.grid(True)
plt.title("Example 5 - how2matplotlib.com")
plt.show()
Output:
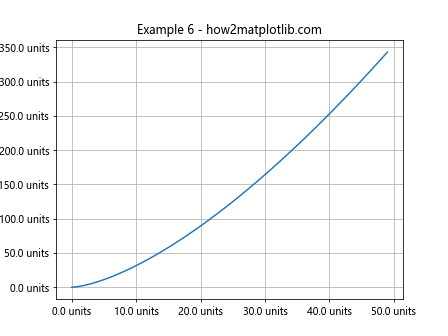
示例6:结合使用AutoLocator和FuncFormatter
import matplotlib.pyplot as plt
from matplotlib.ticker import AutoLocator, FuncFormatter

def custom_format(x, pos):
    return f'{x:.1f} units'

fig, ax = plt.subplots()
ax.plot(range(50), [x**1.5 for x in range(50)])
ax.xaxis.set_major_locator(AutoLocator())
ax.yaxis.set_major_locator(AutoLocator())
ax.xaxis.set_major_formatter(FuncFormatter(custom_format))
ax.yaxis.set_major_formatter(FuncFormatter(custom_format))
ax.grid(True)
plt.title("Example 6 - how2matplotlib.com")
plt.show()
Output:
总结
通过上述示例,我们可以看到在Matplotlib中调整网格间隔和刻度标签是相对直接的。通过合理使用Locator和Formatter,可以有效地控制图表的视觉呈现,使得数据展示更加清晰和直观。在实际的数据分析和可视化工作中,这些技能是非常有用的,值得深入学习和掌握。
 极客笔记
极客笔记