Axes Set Title 使用指南
在数据可视化的过程中,为图表添加标题是一个常见的需求,它可以帮助观众快速理解图表所表达的信息。在Matplotlib库中,set_title 方法是用来设置图表标题的主要方式。本文将详细介绍如何在Matplotlib中使用 set_title 方法来设置图表的标题,并通过多个示例展示不同的使用场景。
1. 基本用法
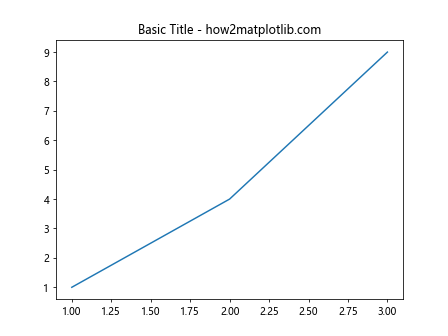
在Matplotlib中,set_title 方法属于 Axes 对象。首先,我们需要创建一个图表和轴,然后使用 set_title 方法来添加或修改标题。
示例代码 1:设置基本标题
import matplotlib.pyplot as plt

fig, ax = plt.subplots()
ax.plot([1, 2, 3], [1, 4, 9])
ax.set_title('Basic Title - how2matplotlib.com')
plt.show()
Output:
2. 标题样式定制
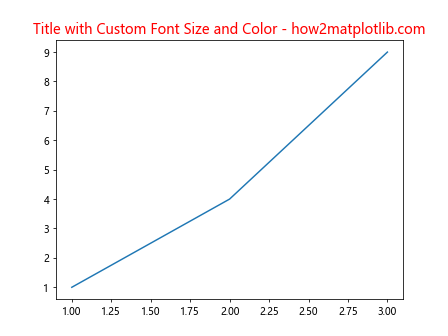
Matplotlib允许用户定制标题的样式,包括字体大小、字体颜色以及位置等。
示例代码 2:设置标题的字体大小和颜色
import matplotlib.pyplot as plt

fig, ax = plt.subplots()
ax.plot([1, 2, 3], [1, 4, 9])
ax.set_title('Title with Custom Font Size and Color - how2matplotlib.com', fontsize=14, color='red')
plt.show()
Output:
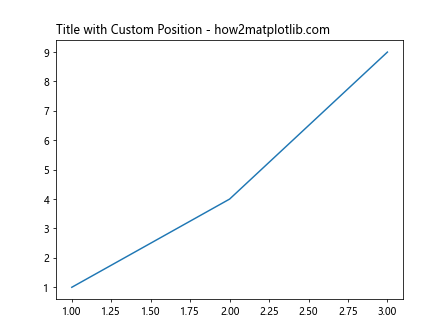
示例代码 3:设置标题的位置
import matplotlib.pyplot as plt

fig, ax = plt.subplots()
ax.plot([1, 2, 3], [1, 4, 9])
ax.set_title('Title with Custom Position - how2matplotlib.com', loc='left')
plt.show()
Output:
3. 使用字体属性
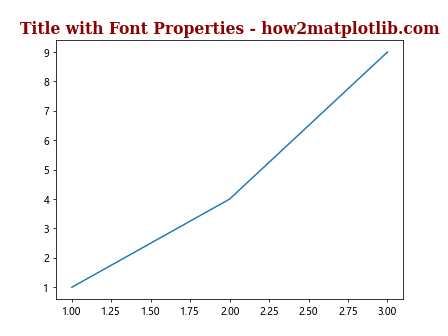
除了可以直接设置字体大小和颜色,Matplotlib还允许通过字体属性来进一步定制标题。
示例代码 4:使用字体属性字典
import matplotlib.pyplot as plt

fig, ax = plt.subplots()
ax.plot([1, 2, 3], [1, 4, 9])
title_font = {'family': 'serif', 'color': 'darkred', 'weight': 'bold', 'size': 16}
ax.set_title('Title with Font Properties - how2matplotlib.com', fontdict=title_font)
plt.show()
Output:
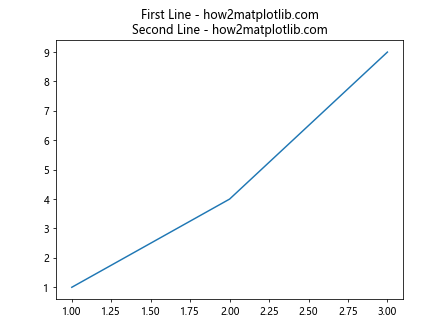
4. 多行标题
有时候,标题内容较多,需要分多行显示,可以通过在字符串中添加换行符来实现。
示例代码 5:设置多行标题
import matplotlib.pyplot as plt

fig, ax = plt.subplots()
ax.plot([1, 2, 3], [1, 4, 9])
ax.set_title('First Line - how2matplotlib.com\nSecond Line - how2matplotlib.com')
plt.show()
Output:
5. 添加副标题
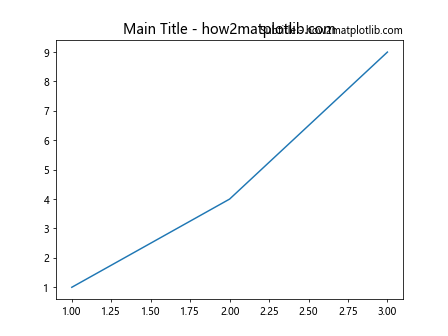
除了主标题外,有时还需要添加副标题,可以通过额外的 set_title 调用,并通过位置参数进行区分。
示例代码 6:添加副标题
import matplotlib.pyplot as plt

fig, ax = plt.subplots()
ax.plot([1, 2, 3], [1, 4, 9])
ax.set_title('Main Title - how2matplotlib.com', fontsize=14)
ax.set_title('Subtitle - how2matplotlib.com', fontsize=10, loc='right')
plt.show()
Output:
6. 标题内嵌数学表达式
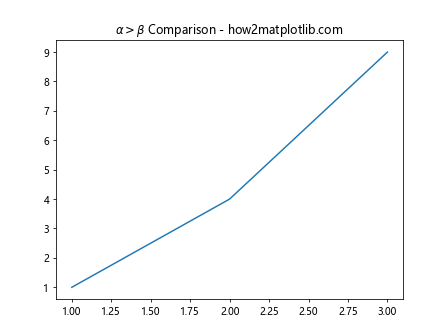
Matplotlib支持在标题中添加LaTeX数学表达式,这对于科学绘图非常有用。
示例代码 7:标题中使用数学表达式
import matplotlib.pyplot as plt

fig, ax = plt.subplots()
ax.plot([1, 2, 3], [1, 4, 9])
ax.set_title(r'\alpha>\beta Comparison - how2matplotlib.com')
plt.show()
Output:
7. 调整标题与图表的距离
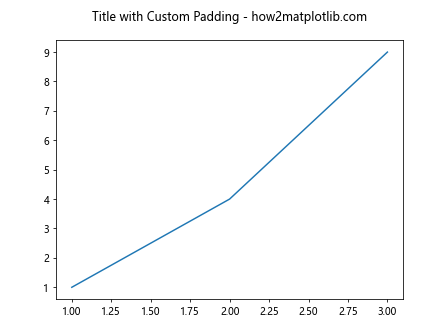
有时候,默认的标题和图表之间的距离可能不是很理想,可以通过 pad 参数来调整。
示例代码 8:调整标题距离
import matplotlib.pyplot as plt

fig, ax = plt.subplots()
ax.plot([1, 2, 3], [1, 4, 9])
ax.set_title('Title with Custom Padding - how2matplotlib.com', pad=20)
plt.show()
Output:
8. 使用不同的字体样式
通过设置不同的字体样式,可以使图表看起来更加美观和专业。
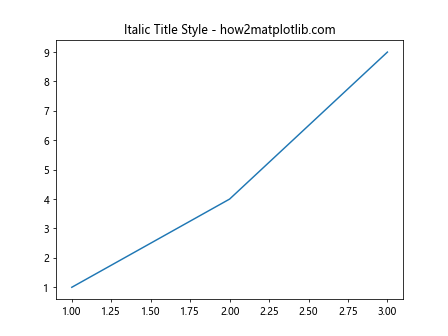
示例代码 9:使用斜体字体样式
import matplotlib.pyplot as plt

fig, ax = plt.subplots()
ax.plot([1, 2, 3], [1, 4, 9])
ax.set_title('Italic Title Style - how2matplotlib.com', style='italic')
plt.show()
Output:
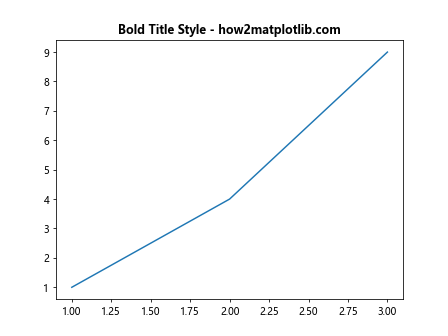
示例代码 10:使用粗体字体样式
import matplotlib.pyplot as plt

fig, ax = plt.subplots()
ax.plot([1, 2, 3], [1, 4, 9])
ax.set_title('Bold Title Style - how2matplotlib.com', weight='bold')
plt.show()
Output:
以上是在Matplotlib中设置图表标题的一些常见用法和技巧。通过这些示例,你可以学会如何为你的图表添加和定制标题,使得你的数据可视化更加清晰和有吸引力。
 极客笔记
极客笔记