Matplotlib ax title subplot
在使用Matplotlib绘制图表时,我们经常需要添加坐标轴的标题和子图的标题。本文将详细介绍如何在Matplotlib中使用ax.set_title()方法来为坐标轴添加标题,并使用fig.suptitle()方法为整个图表添加标题。
1. 为坐标轴添加标题
我们可以使用ax.set_title()方法为坐标轴添加标题,该方法需要传入要添加的标题字符串作为参数。下面是一个简单的示例:
import matplotlib.pyplot as plt

fig, ax = plt.subplots()
ax.plot([1, 2, 3, 4], [1, 4, 9, 16])

ax.set_title('Example Plot with Title')

plt.show()
Output:
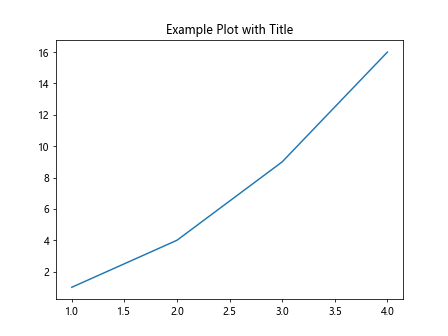
运行以上代码,我们会得到一张带有标题的简单折线图。
2. 为整个图表添加标题
除了为坐标轴添加标题外,我们还可以为整个图表添加一个标题。我们可以使用fig.suptitle()方法来实现这一点。下面是一个示例:
import matplotlib.pyplot as plt

fig, ax = plt.subplots()
ax.plot([1, 2, 3, 4], [1, 4, 9, 16])

fig.suptitle('Example Figure with Title')

plt.show()
Output:
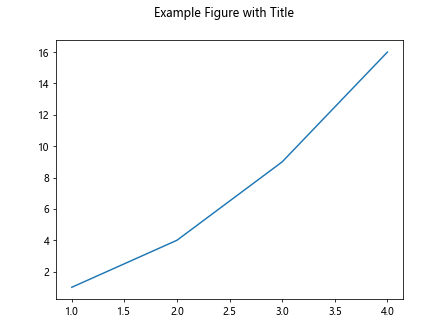
运行以上代码,我们会得到一张带有整个图表标题的折线图。
3. 在多个子图中添加标题
当我们绘制包含多个子图的图表时,可以为每个子图添加独立的标题。下面是一个示例,其中创建了一个包含两个子图的图表,并为每个子图添加了标题:
import matplotlib.pyplot as plt

fig, axs = plt.subplots(1, 2, figsize=(10, 4))
axs[0].plot([1, 2, 3, 4], [1, 4, 9, 16])
axs[0].set_title('Subplot 1')

axs[1].plot([1, 2, 3, 4], [1, 8, 27, 64])
axs[1].set_title('Subplot 2')

plt.show()
Output:
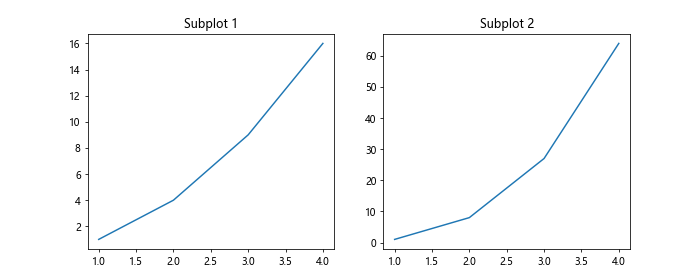
运行以上代码,我们会得到一个包含两个子图的图表,每个子图均有独立的标题。
4. 设置标题的位置和样式
除了传入标题字符串外,ax.set_title()和fig.suptitle()方法还支持设置标题的位置和样式。下面是一个示例,其中设置了标题的位置和字体大小:
import matplotlib.pyplot as plt

fig, ax = plt.subplots()
ax.plot([1, 2, 3, 4], [1, 4, 9, 16])

ax.set_title('Example Plot with Custom Title', loc='right', fontsize=14)

plt.show()
Output:
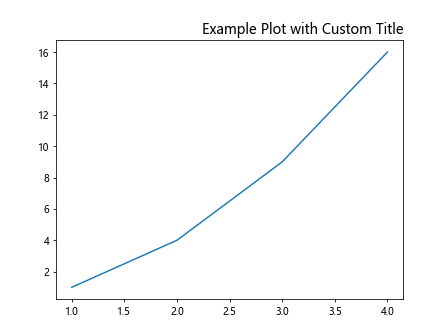
在上述示例中,我们将标题的位置设置为右侧,字体大小设置为14。
5. 在子图中设置标题的位置和样式
同样地,我们可以在子图中设置标题的位置和样式。下面是一个示例,其中设置了子图标题的位置和字体样式:
import matplotlib.pyplot as plt

fig, axs = plt.subplots(1, 2, figsize=(10, 4))
axs[0].plot([1, 2, 3, 4], [1, 4, 9, 16])
axs[0].set_title('Subplot 1', loc='left', fontsize=12)

axs[1].plot([1, 2, 3, 4], [1, 8, 27, 64])
axs[1].set_title('Subplot 2', loc='center', fontsize=16)

plt.show()
Output:
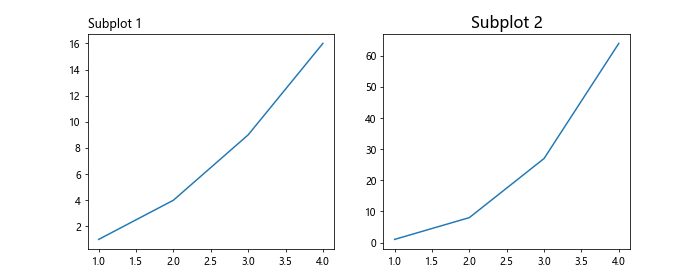
在上述示例中,我们将第一个子图的标题位置设置为左侧,字体大小设置为12,将第二个子图的标题位置设置为居中,字体大小设置为16。
6. 改变标题的颜色
在Matplotlib中,我们也可以改变标题的颜色。下面是一个示例,其中将坐标轴标题和整个图表标题的颜色设置为红色:
import matplotlib.pyplot as plt

fig, ax = plt.subplots()
ax.plot([1, 2, 3, 4], [1, 4, 9, 16])

ax.set_title('Example Plot with Red Title', color='red')
fig.suptitle('Figure with Red Title', color='red')

plt.show()
Output:
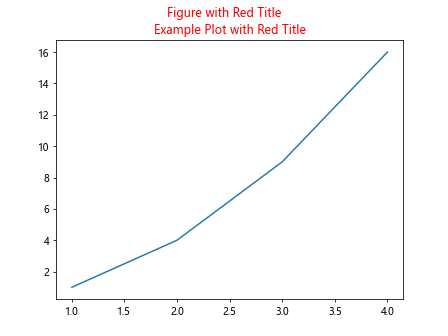
在上述示例中,我们将坐标轴标题和整个图表标题的颜色均设置为红色。
7. 使用不同的字体样式
除了设置标题的颜色外,我们还可以使用不同的字体样式。下面是一个示例,其中将坐标轴标题的字体样式设置为斜体:
import matplotlib.pyplot as plt

fig, ax = plt.subplots()
ax.plot([1, 2, 3, 4], [1, 4, 9, 16])

ax.set_title('Example Plot with Italic Title', fontstyle='italic')

plt.show()
Output:
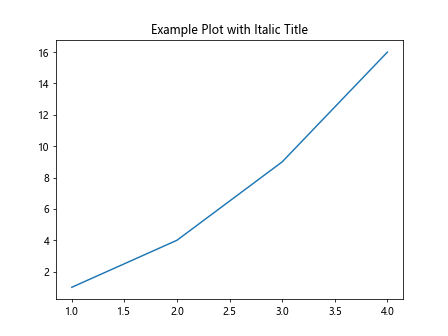
在上述示例中,我们将坐标轴标题的字体样式设置为斜体。
8. 在主标题和子标题之间添加间距
有时候我们需要在主标题和子标题之间添加一定的间距。我们可以通过设置fig.subplots_adjust()方法中的参数来实现这一点。下面是一个示例,其中添加了主标题和子标题之间的间距:
import matplotlib.pyplot as plt

fig, axs = plt.subplots(1, 2, figsize=(10, 4))
axs[0].plot([1, 2, 3, 4], [1, 4, 9, 16])
axs[0].set_title('Subplot 1')

axs[1].plot([1, 2, 3, 4], [1, 8, 27, 64])
axs[1].set_title('Subplot 2')

plt.subplots_adjust(top=0.8)

plt.show()
Output:
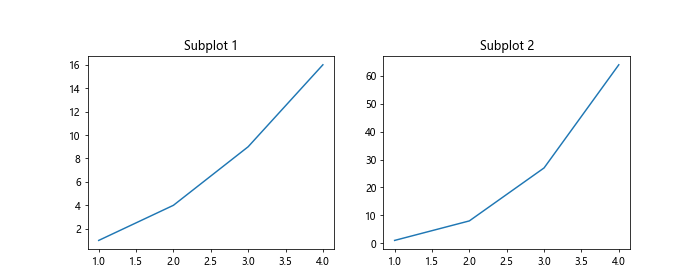
在上述示例中,我们通过plt.subplots_adjust(top=0.8)来设置主标题和子标题之间的间距为0.8。
9. 在子图之间添加间距
除了在主标题和子标题之间添加间距外,我们还可以在不同的子图之间添加间距。下面是一个示例,其中在两个子图之间添加了间距:
import matplotlib.pyplot as plt

fig, axs = plt.subplots(1, 2, figsize=(10, 4))
axs[0].plot([1, 2, 3, 4], [1, 4, 9, 16])
axs[0].set_title('Subplot 1')

axs[1].plot([1, 2, 3, 4], [1, 8, 27, 64])
axs[1].set_title('Subplot 2')

plt.subplots_adjust(wspace=0.5)

plt.show()
Output:
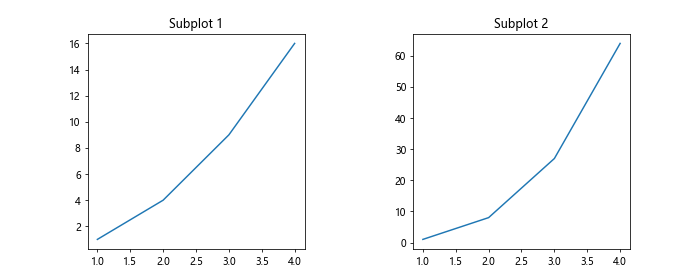
在上述示例中,我们通过plt.subplots_adjust(wspace=0.5)来设置两个子图之间的间距为0.5。
10. 改变标题的对齐方式
在Matplotlib中,我们还可以改## 11. 垂直对齐标题
我们可以通过plt.subplots_adjust()方法来调整主标题和子标题的垂直对齐方式。下面是一个示例,其中将主标题和子标题垂直居中对齐:
import matplotlib.pyplot as plt

fig, axs = plt.subplots(1, 2, figsize=(10, 4))
axs[0].plot([1, 2, 3, 4], [1, 4, 9, 16])
axs[0].set_title('Subplot 1')

axs[1].plot([1, 2, 3, 4], [1, 8, 27, 64])
axs[1].set_title('Subplot 2')

plt.subplots_adjust(top=0.8, wspace=0.5, hspace=0.5)

plt.show()
Output:
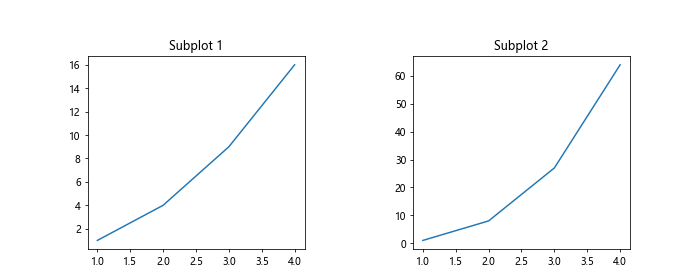
在上述示例中,我们通过plt.subplots_adjust(top=0.8, wspace=0.5, hspace=0.5)来设置主标题和子标题的垂直对齐方式为居中。
12. 隐藏标题
有时候我们可能需要隐藏标题,我们可以将标题字符串设置为空字符串来实现这一点。下面是一个示例,其中隐藏了坐标轴标题和图表标题:
import matplotlib.pyplot as plt

fig, ax = plt.subplots()
ax.plot([1, 2, 3, 4], [1, 4, 9, 16])

ax.set_title('')

fig.suptitle('')

plt.show()
Output:
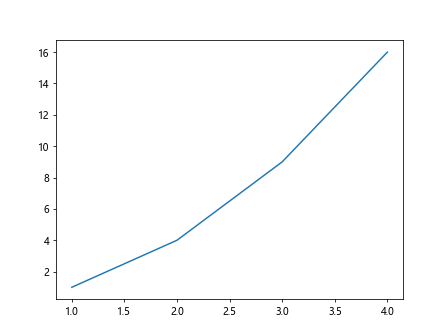
在上述示例中,我们将坐标轴标题和图表标题的字符串均设置为空字符串,从而达到隐藏标题的效果。
13. 动态更新标题
有时候我们需要根据图表数据动态更新标题。我们可以在绘制图表后通过ax.set_title()和fig.suptitle()方法动态更新标题。下面是一个示例,其中实现了动态更新图表标题的功能:
import matplotlib.pyplot as plt
import numpy as np

fig, ax = plt.subplots()

x = np.linspace(0, 10, 100)
y = np.sin(x)

line, = ax.plot(x, y)
ax.set_title('Sin Wave')

for i in range(10):
    line.set_ydata(np.sin(x + i/10))
    ax.set_title(f'Sin Wave with Phase Shift: {i}')
    plt.pause(0.5)

plt.show()
Output:
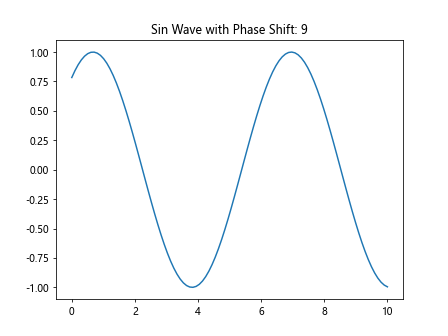
在上述示例中,我们绘制了一个正弦波图表,并在每次更新图表数据时动态更新标题。
14. 在图表中添加副标题
除了主标题和子标题外,我们还可以在图表中添加副标题。我们可以使用ax.text()方法在图表中的任意位置添加文本。下面是一个示例,其中在图表中添加了副标题:
import matplotlib.pyplot as plt

fig, ax = plt.subplots()
ax.plot([1, 2, 3, 4], [1, 4, 9, 16])

ax.text(2, 10, 'Additional Information', fontsize=12, color='blue')

plt.show()
Output:
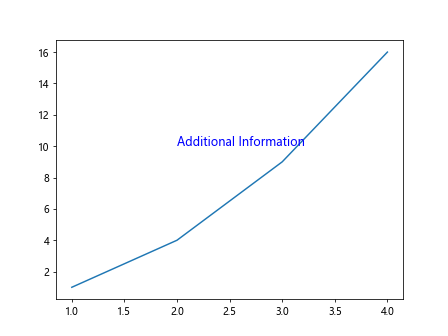
在上述示例中,我们在坐标(2, 10)的位置添加了一个副标题”Additional Information”,并设置了字体大小和颜色。
15. 在图表中添加标题框
有时候我们需要在标题周围添加一个框来突出标题。我们可以使用ax.title.set_bbox()方法来添加标题框。下面是一个示例,其中在主标题周围添加了一个标题框:
import matplotlib.pyplot as plt

fig, ax = plt.subplots()
ax.plot([1, 2, 3, 4], [1, 4, 9, 16])

ax.set_title('Example Plot with Box', fontsize=14)
ax.title.set_bbox({'facecolor': 'yellow', 'alpha': 0.5, 'pad': 10})

plt.show()
Output:
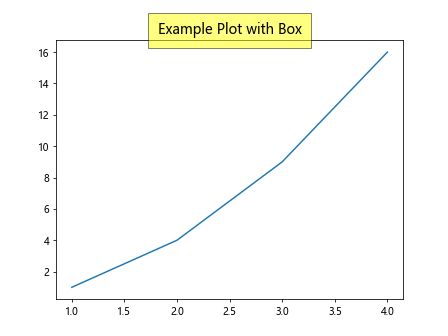
在上述示例中,我们在主标题周围添加了一个黄色的半透明标题框,设置了边距为10。
16. 添加多行标题
有时候我们需要在标题中包含换行符,以实现多行标题的效果。我们可以在标题字符串中使用\n来添加换行符。下面是一个示例,其中创建了一个包含多行标题的图表:
import matplotlib.pyplot as plt

fig, ax = plt.subplots()
ax.plot([1, 2, 3, 4], [1, 4, 9, 16])

ax.set_title('Multi\nLine\nTitle', fontsize=14)

plt.show()
Output:
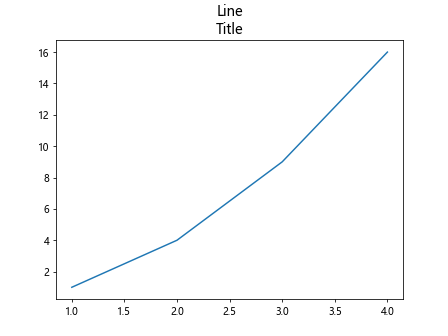
在上述示例中,我们在标题字符串中使用了\n来实现多行标题的效果。
17. 使用latex格式设置标题
Matplotlib支持使用latex格式来设置标题文本。我们可以在标题字符串中使用latex命令来实现特殊样式的标题。下面是一个示例,其中使用latex格式设置了标题:
import matplotlib.pyplot as plt

fig, ax = plt.subplots()
ax.plot([1, 2, 3, 4], [1, 4, 9, 16])

ax.set_title(r'\alpha-\beta: Example Plot')

plt.show()
Output:
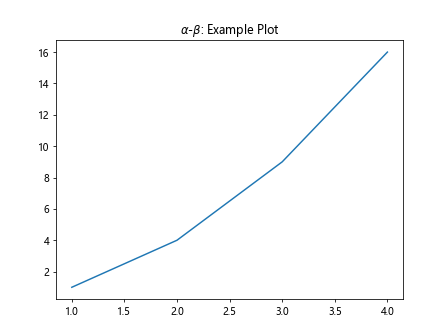
在上述示例中,我们使用了latex命令$\alpha$-$\beta$来设置标题,显示为”\alpha–\beta: Example Plot”。
18. 自定义标题样式
最后,我们可以通过设置ax.set_title()和fig.suptitle()方法的参数来进一步自定义标题样式。下面是一个示例,其中设置了标题的字体、颜色和对齐方式:
import matplotlib.pyplot as plt

fig, ax = plt.subplots()
ax.plot([1, 2, 3, 4], [1, 4, 9, 16])

ax.set_title('Custom Title', fontsize=16, color='green', fontweight='bold', loc='left')

plt.show()
Output:
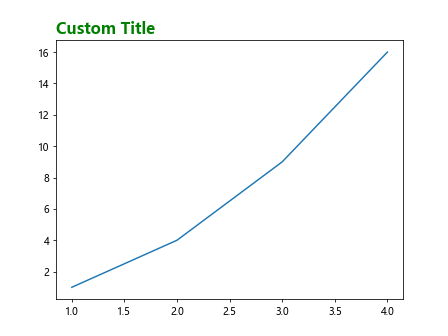
在上述示例中,我们自定义了标题的字体大小为16,颜色为绿色,加粗字体,并设置了标题的对齐方式为左侧。
 极客笔记
极客笔记