使用ax.annotate在Matplotlib中添加注释
参考:Ax Annotate
Matplotlib是一个Python绘图库,用于创建高质量的图表和数据可视化。在Matplotlib中,我们可以使用ax.annotate方法在图表中添加注释。本文将介绍如何使用ax.annotate在Matplotlib中添加注释,并提供详细的示例代码。
基本用法
首先,让我们看一个简单的例子,演示如何在Matplotlib中使用ax.annotate添加注释。
import matplotlib.pyplot as plt

x = [1, 2, 3, 4]
y = [1, 4, 9, 16]

fig, ax = plt.subplots()
ax.plot(x, y)

ax.annotate('Point 1', (1, 1), xytext=(1.5, 2),
            arrowprops=dict(facecolor='black', shrink=0.05))

plt.show()
Output:
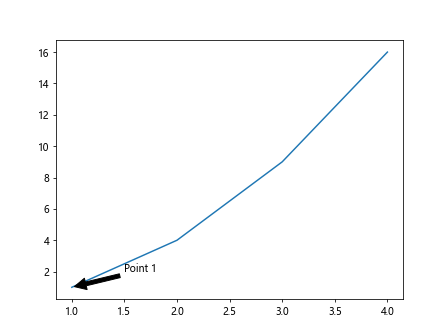
在这个例子中,我们首先创建了一个包含几个点的简单折线图。然后,我们使用ax.annotate在图表中添加了一个注释。参数(1, 1)表示注释的位置,xytext=(1.5, 2)表示注释文本的位置,arrowprops指定了箭头的样式。
指定注释文本和箭头的样式
在Matplotlib中,我们可以指定注释文本和箭头的样式,以使注释更具吸引力和可读性。
import matplotlib.pyplot as plt

x = [1, 2, 3, 4]
y = [1, 4, 9, 16]

fig, ax = plt.subplots()
ax.plot(x, y)

ax.annotate('Point 2', (2, 4), xytext=(2.5, 5),
            arrowprops=dict(arrowstyle='->', connectionstyle='angle,angleA=0,angleB=90,rad=10'))

plt.show()
Output:
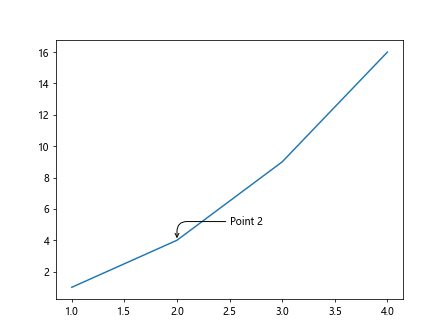
在这个例子中,我们指定了箭头的样式为'->',并使用connectionstyle参数来设置箭头的连接样式。
水平和垂直对齐注释文本
有时,我们希望注释文本可以水平或垂直对齐,以提高可读性。
import matplotlib.pyplot as plt

x = [1, 2, 3, 4]
y = [1, 4, 9, 16]

fig, ax = plt.subplots()
ax.plot(x, y)

ax.annotate('Point 3', (3, 9), xytext=(3.5, 10),
            arrowprops=dict(arrowstyle='-', connectionstyle='arc3,rad=-0.5'),
            horizontalalignment='right', verticalalignment='bottom')

plt.show()
Output:
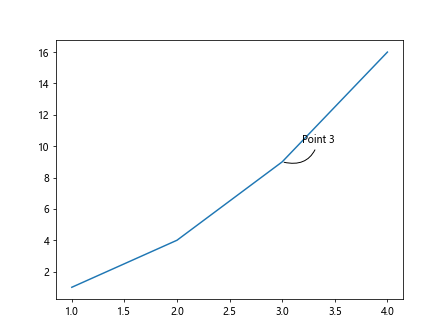
在这个例子中,我们使用horizontalalignment参数设置注释文本的水平对齐方式为'right',verticalalignment参数设置垂直对齐方式为'bottom'。
在指定区域内添加注释
有时,我们希望在图表的特定区域内添加注释。可以使用axins和add_patch来实现这一功能。
import matplotlib.pyplot as plt
from mpl_toolkits.axes_grid1.inset_locator import inset_axes

x = [1, 2, 3, 4]
y = [1, 4, 9, 16]

fig, ax = plt.subplots()
ax.plot(x, y)

axins = inset_axes(ax, width="30%", height="30%", loc='lower left')
axins.plot(x, y)
axins.annotate('Zoomed In', (2.5, 5), xytext=(3, 6),
               arrowprops=dict(arrowstyle='-', connectionstyle='arc3,rad=-0.5'))

plt.show()
Output:
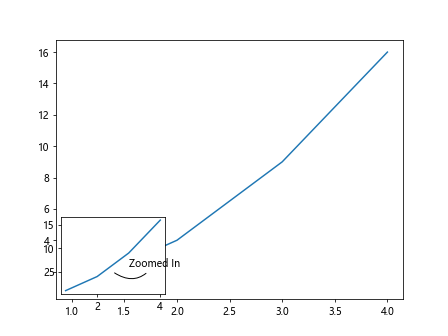
在这个例子中,我们首先创建一个包含多个点的折线图,然后在图表的特定区域内(使用axins指定)添加了一个缩放注释。
添加多个注释
在Matplotlib中,我们可以添加多个注释到图表中,以突出显示多个重要点。
import matplotlib.pyplot as plt

x = [1, 2, 3, 4]
y = [1, 4, 9, 16]

fig, ax = plt.subplots()
ax.plot(x, y)

annotations = [
    ('Point 1', (1, 1), (1.5, 2)),
    ('Point 2', (2, 4), (2.5, 5)),
    ('Point 3', (3, 9), (3.5, 10)),
    ('Point 4', (4, 16), (4.5, 17))
]

for label, coord, text_coord in annotations:
    ax.annotate(label, coord, xytext=text_coord,
                arrowprops=dict(arrowstyle='->'))

plt.show()
Output:
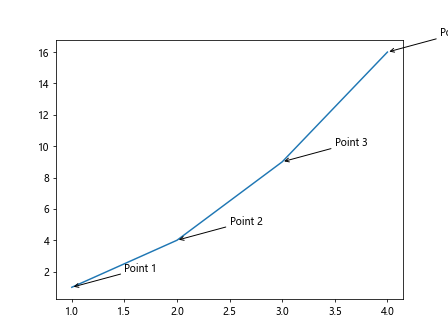
在这个例子中,我们使用一个包含多个注释的列表,在循环中依次添加每个注释到图表中。
自定义注释文本和箭头的样式
在Matplotlib中,我们可以自定义注释文本和箭头的样式,以使注释更符合我们的需求。
import matplotlib.pyplot as plt

x = [1, 2, 3, 4]
y = [1, 4, 9, 16]

fig, ax = plt.subplots()
ax.plot(x, y)

annotations = [
    ('Point 1', (1, 1), (1.5, 2), {'arrowstyle': '-|>', 'color': 'red'}),
    ('Point 2', (2, 4), (2.5, 5), {'arrowstyle': '->', 'color': 'blue'}),
    ('Point 3', (3, 9), (3.5, 10), {'arrowstyle': '-[', 'color': 'green'}),
]

for label, coord, text_coord, arrow_props in annotations:
    ax.annotate(label, coord, xytext=text_coord,
                arrowprops=arrow_props)

plt.show()
Output:
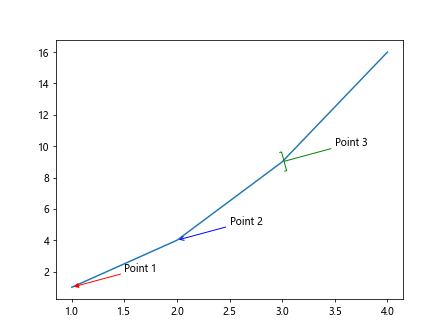
在这个例子中,我们使用字典来指定每个注释的自定义箭头样式和颜色。
使用bbox参数设置注释框的样式
在Matplotlib中,我们还可以使用bbox参数来设置注释框的样式,包括边框颜色、填充颜色等。
import matplotlib.pyplot as plt

x = [1, 2, 3, 4]
y = [1, 4, 9, 16]

fig, ax = plt.subplots()
ax.plot(x, y)

ax.annotate('Point 5', (1.5, 3), xytext=(2, 4),
            arrowprops=dict(arrowstyle='-', connectionstyle='angle,angleA=0,angleB=90,rad=10'),
            bbox=dict(boxstyle='round,pad=1', fc='yellow', ec='black'))

plt.show()
Output:
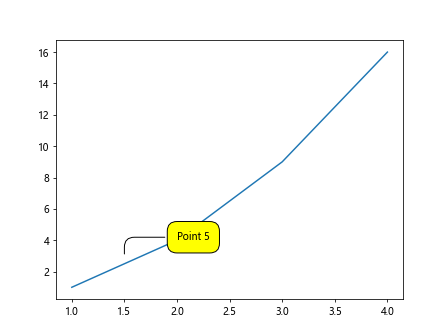
在这个例子中,我们使用bbox参数设置了注释框的风格,包括圆角矩形、填充颜色为黄色、边框颜色为黑色。
在图表中添加带有HTML格式的注释
在Matplotlib中,我们还可以使用丰富的HTML格式来定制注释文本,包括文本颜色、字体大小等。
import matplotlib.pyplot as plt

x = [1, 2, 3, 4]
y = [1, 4, 9, 16]

fig, ax = plt.subplots()
ax.plot(x, y)

html_text = '<b><font color="red">HTML Annotation</font></b>'

ax.annotate(html_text, (2, 5), xytext=(2.5, 6),
            arrowprops=dict(arrowstyle='-', connectionstyle='arc3,rad=-0.5'))

plt.show()
Output:
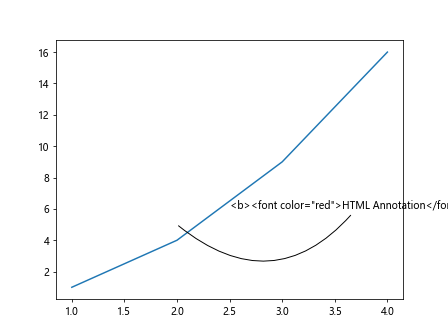
在这个例子中,我们使用HTML格式的注释文本,将文本设置为加粗、红色。
在图表中添加带有LaTeX格式的注释
Matplotlib还支持使用LaTeX格式的注释文本,这使得注释文本更加美观和专业。
import matplotlib.pyplot as plt

x = [1, 2, 3, 4]
y = [1, 4, 9, 16]

fig, ax = plt.subplots()
ax.plot(x, y)

latex_text = r'\alpha_i>\beta_i'

ax.annotate(latex_text, (3, 9), xytext=(3.5, 10),
            arrowprops=dict(arrowstyle='-', connectionstyle='arc3,rad=-0.5'))

plt.show()
Output:
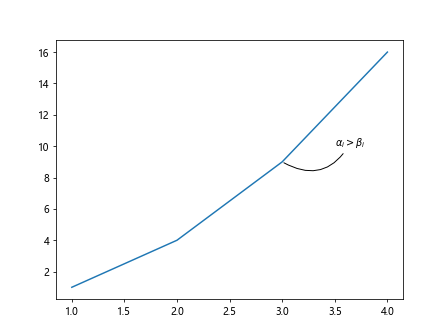
在这个例子中,我们使用LaTeX格式的注释文本,展示了一个数学公式。
在不同坐标系中添加注释
在Matplotlib中,我们可以在不同的坐标系中添加注释,包括数据坐标、轴坐标和图表坐标等。
import matplotlib.pyplot as plt

x = [1, 2, 3, 4]
y = [1, 4, 9, 16]

fig, ax = plt.subplots()
ax.plot(x, y)

# Add annotation in data coordinate
ax.annotate('Data Coord', (2, 4), xytext=(3, 8),
            arrowprops=dict(arrowstyle='-', connectionstyle='angle,angleA=0,angleB=90,rad=10'))

# Add annotation in axis coordinate
ax.annotate('Axis Coord', (0.5, 0.5), xytext=(0.2, 0.8),
            arrowprops=dict(arrowstyle='-', connectionstyle='arc3,rad=-0.5'),
            xycoords='axes fraction')

# Add annotation in figure coordinate
ax.annotate('Figure Coord', (0.2, 0.2), xytext=(0.6, 0.5),
            arrowprops=dict(arrowstyle='-', connectionstyle='angle,angleA=0,angleB=90,rad=10'),
            xycoords='figure fraction')

plt.show()
Output:
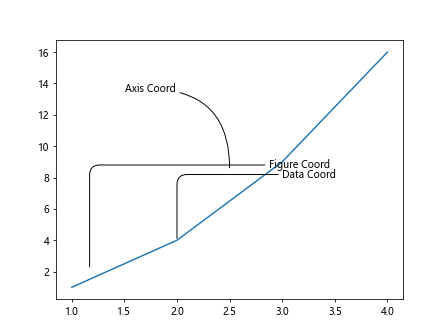
在这个例子中,我们展示了如何在数据坐标、轴坐标和图表坐标中添加注释。
结论
本文介绍了如何在Matplotlib中使用ax.annotate方法在图表中添加注释。通过示例代码展示了基本用法、指定注释文本和箭头的样式、水平和垂直对齐注释文本、在指定区域内添加注释、添加多个注释、自定义注释文本和箭头的样式、使用bbox参数设置注释框的样式、在图表中添加带有HTML格式的注释、在图表中添加带有LaTeX格式的注释、在不同坐标系中添加注释等。
 极客笔记
极客笔记