在Matplotlib图表中标注Pandas DataFrame的数据点
参考: Annotating points from a Pandas Dataframe in Matplotlib plot
在数据可视化的过程中,标注(Annotating)是一种增强图表信息表达的有效手段,它可以帮助观众更直接地看到数据点的具体值或描述。本文将详细介绍如何在使用Python的Matplotlib库绘图时,从Pandas DataFrame中标注数据点。我们将通过多个示例展示不同的标注技巧和方法。
1. 基础标注
首先,我们需要导入必要的库,并创建一个简单的DataFrame来作为我们的数据源。
示例代码 1:创建数据并进行基本的点标注
import matplotlib.pyplot as plt
import pandas as pd
import numpy as np

# 创建数据
data = pd.DataFrame({
    'x': np.random.rand(10),
    'y': np.random.rand(10),
    'label': ['point {}'.format(i) for i in range(10)]
})

# 绘图
fig, ax = plt.subplots()
ax.scatter(data['x'], data['y'])

# 标注
for i, txt in enumerate(data['label']):
    ax.annotate(txt, (data['x'][i], data['y'][i]))

plt.show()
Output:
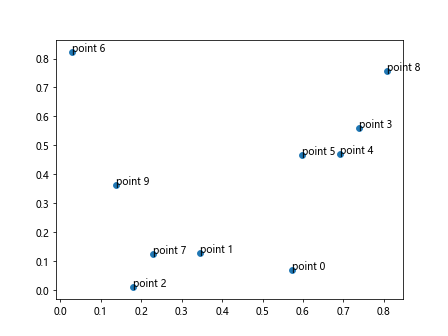
在这个例子中,我们首先生成了包含10个随机点的DataFrame。然后,我们使用scatter方法绘制点图,并通过annotate方法添加了每个点的标签。
2. 自定义标注样式
标注样式的自定义可以帮助我们根据图表的需求调整文字的大小、颜色等属性,使得标注更加符合整体的视觉效果。
示例代码 2:自定义标注样式
import matplotlib.pyplot as plt
import pandas as pd
import numpy as np

# 创建数据
data = pd.DataFrame({
    'x': np.random.rand(10),
    'y': np.random.rand(10),
    'label': ['point {}'.format(i) for i in range(10)]
})

# 绘图
fig, ax = plt.subplots()
ax.scatter(data['x'], data['y'], color='blue')

# 自定义标注样式
for i, txt in enumerate(data['label']):
    ax.annotate(txt, (data['x'][i], data['y'][i]),
                textcoords="offset points",
                xytext=(0,10),
                ha='center',
                fontsize=8,
                color='green')

plt.show()
Output:
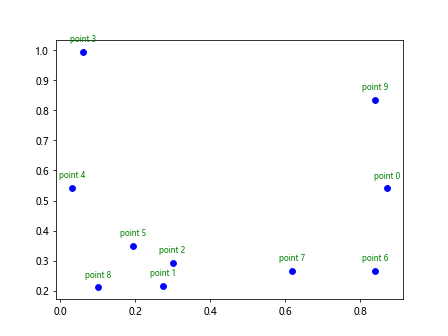
在这个例子中,我们通过textcoords设置标注文本的位置相对于点的偏移,xytext设置偏移量,ha设置水平对齐方式,以及通过fontsize和color自定义文字的大小和颜色。
3. 使用箭头连接标注
在某些情况下,直接在数据点旁边添加标注可能会导致图表看起来过于拥挤。使用箭头可以有效地将标注文本与对应的数据点连接起来,增强图表的可读性。
示例代码 3:使用箭头连接标注
import matplotlib.pyplot as plt
import pandas as pd
import numpy as np

# 创建数据
data = pd.DataFrame({
    'x': np.random.rand(10),
    'y': np.random.rand(10),
    'label': ['point {}'.format(i) for i in range(10)]
})

# 绘图
fig, ax = plt.subplots()
ax.scatter(data['x'], data['y'], color='blue')

# 使用箭头标注
for i, txt in enumerate(data['label']):
    ax.annotate(txt, (data['x'][i], data['y'][i]),
                textcoords="offset points",
                xytext=(0,10),
                arrowprops=dict(arrowstyle="->", connectionstyle="arc3,rad=.2"))

plt.show()
Output:
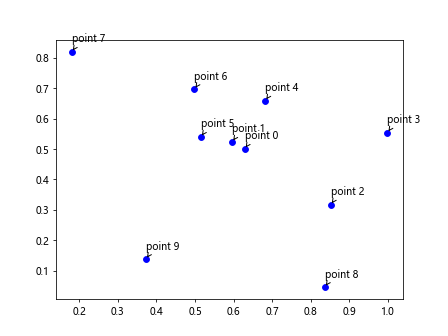
在这个例子中,我们通过arrowprops参数添加了箭头,并通过arrowstyle和connectionstyle自定义了箭头的样式和弯曲度。
4. 标注重要数据点
在实际应用中,我们可能只需要对部分重要的数据点进行标注。接下来的示例展示了如何筛选并标注重要的数据点。
示例代码 4:标注重要数据点
import matplotlib.pyplot as plt
import pandas as pd
import numpy as np

# 创建数据
data = pd.DataFrame({
    'x': np.random.rand(10),
    'y': np.random.rand(10),
    'label': ['point {}'.format(i) for i in range(10)]
})

# 假设我们只标注y值大于0.5的点
important_points = data[data['y'] > 0.5]

# 绘图
fig, ax = plt.subplots()
ax.scatter(data['x'], data['y'], color='blue')
ax.scatter(important_points['x'], important_points['y'], color='red')

# 标注重要点
for i, txt in enumerate(important_points['label']):
    ax.annotate(txt, (important_points['x'].iloc[i], important_points['y'].iloc[i]),
                textcoords="offset points",
                xytext=(0,10),
                ha='center',
                fontsize=8,
                color='darkred')

plt.show()
Output:
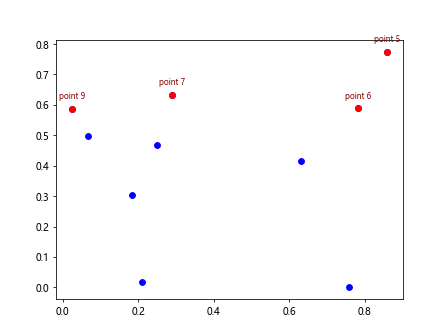
在这个例子中,我们首先筛选出了y值大于0.5的重要数据点,并用红色突出显示这些点。然后,我们只对这些重要的数据点进行了标注。
5. 结合不同类型的图表进行标注
在某些情况下,我们可能需要在不同类型的图表上进行数据点的标注,比如在柱状图上标注具体数值。接下来的示例展示了如何在柱状图上进行数据点的标注。
示例代码 5:在柱状图上进行数据点的标注
import matplotlib.pyplot as plt
import pandas as pd
import numpy as np

# 创建数据
data = pd.DataFrame({
    'category': ['A', 'B', 'C', 'D', 'E'],
    'value': np.random.randint(10, 100, size=5)
})

# 绘图
fig, ax = plt.subplots()
bars = ax.bar(data['category'], data['value'], color='lightblue')

# 标注
for bar in bars:
    yval = bar.get_height()
    ax.annotate('{}'.format(yval),
                (bar.get_x() + bar.get_width() / 2, yval),
                va='bottom',  # 垂直对齐
                ha='center',  # 水平对齐
                textcoords="offset points",
                xytext=(0, 10),  # 文本偏移
                fontsize=8)

plt.show()
Output:
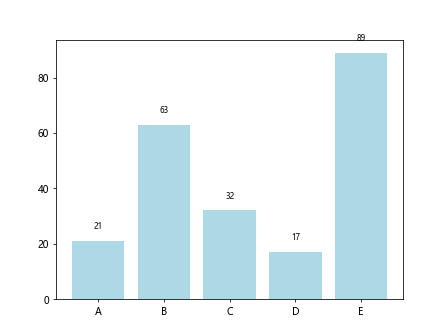
在这个例子中,我们首先绘制了一个柱状图,并通过遍历每个柱子,使用annotate在柱子顶部标注了具体的数值。
6. 结合函数绘图和数据点标注
在函数图像的绘制中,我们经常需要在特定的数据点上进行标注,以突出这些点的特殊意义。接下来的示例展示了如何在函数图像上标注特定的数据点。
示例代码 6:在函数图像上标注特定数据点
import matplotlib.pyplot as plt
import pandas as pd
import numpy as np

# 创建数据
x = np.linspace(0, 10, 100)
y = np.sin(x)
points = pd.DataFrame({
    'x': [3, 7],
    'y': [np.sin(3), np.sin(7)],
    'label': ['peak', 'valley']
})

# 绘图
fig, ax = plt.subplots()
ax.plot(x, y, label='sin(x)')
ax.scatter(points['x'], points['y'], color='red')  # 突出显示特定点

# 标注
for i, txt in enumerate(points['label']):
    ax.annotate(txt, (points['x'][i], points['y'][i]),
                textcoords="offset points",
                xytext=(0,10),
                ha='center')

plt.legend()
plt.show()
Output:
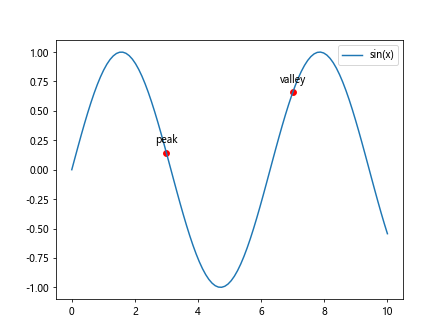
在这个例子中,我们首先绘制了sin(x)的函数图像,并突出显示了两个特定的数据点(一个峰值和一个谷值)。然后,我们使用annotate方法在这些特定点上添加了标注。
7. 在时间序列数据上进行标注
在处理时间序列数据时,标注可以帮助我们识别和突出显示特定的时间点或时间段。接下来的示例展示了如何在时间序列图上进行数据点的标注。
示例代码 7:在时间序列图上进行数据点的标注
import matplotlib.pyplot as plt
import pandas as pd
import numpy as np

# 创建时间序列数据
dates = pd.date_range(start='2023-01-01', periods=100)
values = np.random.rand(100).cumsum()
data = pd.DataFrame({'Date': dates, 'Value': values})

# 绘图
fig, ax = plt.subplots()
ax.plot(data['Date'], data['Value'], label='Value over Time')

# 假设我们标注最大值点
max_point = data[data['Value'] == data['Value'].max()]
ax.scatter(max_point['Date'], max_point['Value'], color='red')

# 标注
ax.annotate('Maximum', (max_point['Date'].values[0], max_point['Value'].values[0]),
            textcoords="offset points",
            xytext=(0,10),
            ha='center')

plt.legend()
plt.show()
Output:
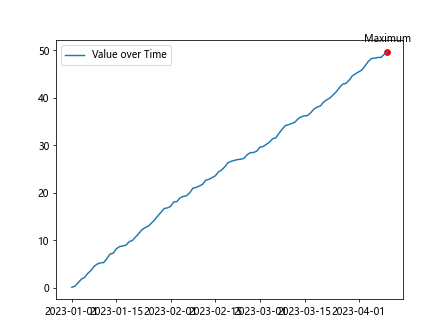
在这个例子中,我们首先创建了一个包含100个日期和随机累积值的DataFrame。我们绘制了时间序列图,并找到了值最大的点进行标注。
8. 在散点图中使用条件标注
有时候,我们可能只想在满足特定条件的情况下才进行标注。接下来的示例展示了如何在散点图中实现条件标注。
示例代码 8:在散点图中使用条件标注
import matplotlib.pyplot as plt
import pandas as pd
import numpy as np

# 创建数据
data = pd.DataFrame({
    'x': np.random.rand(50),
    'y': np.random.rand(50),
    'label': ['group1' if x > 0.5 else 'group2' for x in np.random.rand(50)]
})

# 绘图
fig, ax = plt.subplots()
scatter = ax.scatter(data['x'], data['y'], c=(data['x'] > 0.5), cmap='bwr')

# 只标注group1的点
group1_data = data[data['label'] == 'group1']
for i, txt in enumerate(group1_data['label']):
    ax.annotate(txt, (group1_data['x'].iloc[i], group1_data['y'].iloc[i]),
                textcoords="offset points",
                xytext=(0,10),
                ha='center')

plt.show()
Output:
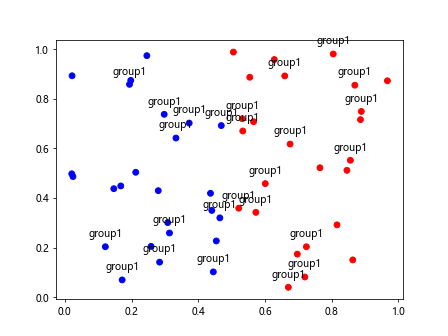
在这个例子中,我们根据x值的大小将数据分为两组,并用不同的颜色表示。我们只对group1的数据点进行了标注。
9. 在条形图上进行多重标注
在条形图上进行标注时,我们可能需要在同一个条形上添加多个标注。接下来的示例展示了如何实现这一点。
示例代码 9:在条形图上进行多重标注
import matplotlib.pyplot as plt
import pandas as pd
import numpy as np

# 创建数据
data = pd.DataFrame({
    'category': ['A', 'B', 'C'],
    'value1': [10, 20, 15],
    'value2': [5, 15, 10]
})

# 绘图
fig, ax = plt.subplots()
bars1 = ax.bar(data['category'], data['value1'], color='blue', label='Value 1')
bars2 = ax.bar(data['category'], data['value2'], bottom=data['value1'], color='red', label='Value 2')

# 标注
for bars, value in zip([bars1, bars2], ['value1', 'value2']):
    for bar in bars:
        height = bar.get_height()
        ax.annotate('{}: {}'.format(value, height),
                    (bar.get_x() + bar.get_width() / 2, bar.get_y() + height),
                    textcoords="offset points",
                    xytext=(0, 10),
                    ha='center')

plt.legend()
plt.show()
Output:
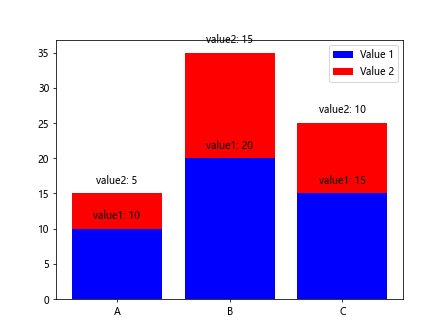
在这个例子中,我们创建了一个堆叠条形图,其中包含两组数据。我们在每个条形上分别标注了两个值,即value1和value2。
10. 在饼图上进行标注
饼图是展示比例关系的常用图表类型。在饼图上进行标注可以帮助观众更好地理解每个部分的具体比例。
示例代码 10:在饼图上进行标注
import matplotlib.pyplot as plt
import pandas as pd
import numpy as np

# 创建数据
data = pd.Series([30, 15, 45, 10], index=['A', 'B', 'C', 'D'], name='Example Data')

# 绘图
fig, ax = plt.subplots()
wedges, texts, autotexts = ax.pie(data, labels=data.index, autopct='%1.1f%%', startangle=90, colors=['red', 'green', 'blue', 'yellow'])

# 自定义标注样式
for text in autotexts:
    text.set_color('white')
    text.set_fontsize(12)

plt.show()
Output:
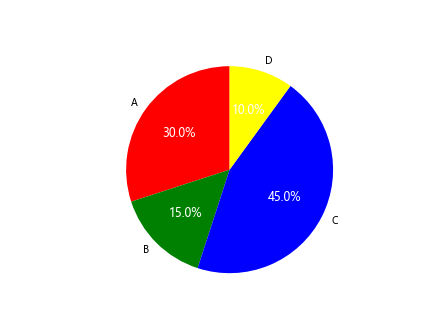
在这个例子中,我们创建了一个饼图,并通过autopct参数自动添加了百分比标注。我们还自定义了标注文本的颜色和字体大小,以提高可读性。
以上示例展示了在不同类型的Matplotlib图表中如何进行有效的数据点标注。通过这些技巧,你可以更好地向观众传达图表中的关键信息,增强数据的表达力。
 极客笔记
极客笔记